

BOC Report and accounts 2005 - Alle jaarverslagen
BOC Report and accounts 2005 - Alle jaarverslagen
BOC Report and accounts 2005 - Alle jaarverslagen

Create successful ePaper yourself
Turn your PDF publications into a flip-book with our unique Google optimized e-Paper software.
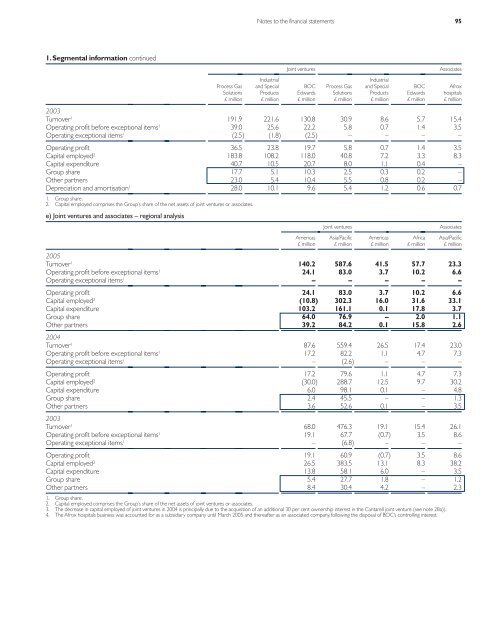
Notes to the financial statements 95<br />
1. Segmental information continued<br />
Joint ventures<br />
Associates<br />
Industrial<br />
Industrial<br />
Process Gas <strong>and</strong> Special <strong>BOC</strong> Process Gas <strong>and</strong> Special <strong>BOC</strong> Afrox<br />
Solutions Products Edwards Solutions Products Edwards hospitals<br />
£ million £ million £ million £ million £ million £ million £ million<br />
2003<br />
Turnover 1 191.9 221.6 130.8 30.9 8.6 5.7 15.4<br />
Operating profit before exceptional items 1 39.0 25.6 22.2 5.8 0.7 1.4 3.5<br />
Operating exceptional items 1 (2.5) (1.8) (2.5) – – – –<br />
Operating profit 36.5 23.8 19.7 5.8 0.7 1.4 3.5<br />
Capital employed 2 183.8 108.2 118.0 40.8 7.2 3.3 8.3<br />
Capital expenditure 40.7 10.5 20.7 8.0 1.1 0.4 –<br />
Group share 17.7 5.1 10.3 2.5 0.3 0.2 –<br />
Other partners 23.0 5.4 10.4 5.5 0.8 0.2 –<br />
Depreciation <strong>and</strong> amortisation 1 28.0 10.1 9.6 5.4 1.2 0.6 0.7<br />
1. Group share.<br />
2. Capital employed comprises the Group’s share of the net assets of joint ventures or associates.<br />
e) Joint ventures <strong>and</strong> associates – regional analysis<br />
Joint ventures<br />
Associates<br />
Americas Asia/Pacific Americas Africa Asia/Pacific<br />
£ million £ million £ million £ million £ million<br />
<strong>2005</strong><br />
Turnover 1 140.2 587.6 41.5 57.7 23.3<br />
Operating profit before exceptional items 1 24.1 83.0 3.7 10.2 6.6<br />
Operating exceptional items 1 – – – – –<br />
Operating profit 24.1 83.0 3.7 10.2 6.6<br />
Capital employed 2 (10.8) 302.3 16.0 31.6 33.1<br />
Capital expenditure 103.2 161.1 0.1 17.8 3.7<br />
Group share 64.0 76.9 – 2.0 1.1<br />
Other partners 39.2 84.2 0.1 15.8 2.6<br />
2004<br />
Turnover 1 87.6 559.4 26.5 17.4 23.0<br />
Operating profit before exceptional items 1 17.2 82.2 1.1 4.7 7.3<br />
Operating exceptional items 1 – (2.6) – – –<br />
Operating profit 17.2 79.6 1.1 4.7 7.3<br />
Capital employed 2 (30.0) 288.7 12.5 9.7 30.2<br />
Capital expenditure 6.0 98.1 0.1 – 4.8<br />
Group share 2.4 45.5 – – 1.3<br />
Other partners 3.6 52.6 0.1 – 3.5<br />
2003<br />
Turnover 1 68.0 476.3 19.1 15.4 26.1<br />
Operating profit before exceptional items 1 19.1 67.7 (0.7) 3.5 8.6<br />
Operating exceptional items 1 – (6.8) – – –<br />
Operating profit 19.1 60.9 (0.7) 3.5 8.6<br />
Capital employed 2 26.5 383.5 13.1 8.3 38.2<br />
Capital expenditure 13.8 58.1 6.0 – 3.5<br />
Group share 5.4 27.7 1.8 – 1.2<br />
Other partners 8.4 30.4 4.2 – 2.3<br />
1. Group share.<br />
2. Capital employed comprises the Group’s share of the net assets of joint ventures or associates.<br />
3. The decrease in capital employed of joint ventures in 2004 is principally due to the acquisition of an additional 30 per cent ownership interest in the Cantarell joint venture (see note 28a)).<br />
4. The Afrox hospitals business was accounted for as a subsidiary company until March <strong>2005</strong> <strong>and</strong> thereafter as an associated company, following the disposal of <strong>BOC</strong>’s controlling interest.


