

BOC Report and accounts 2005 - Alle jaarverslagen
BOC Report and accounts 2005 - Alle jaarverslagen
BOC Report and accounts 2005 - Alle jaarverslagen

You also want an ePaper? Increase the reach of your titles
YUMPU automatically turns print PDFs into web optimized ePapers that Google loves.
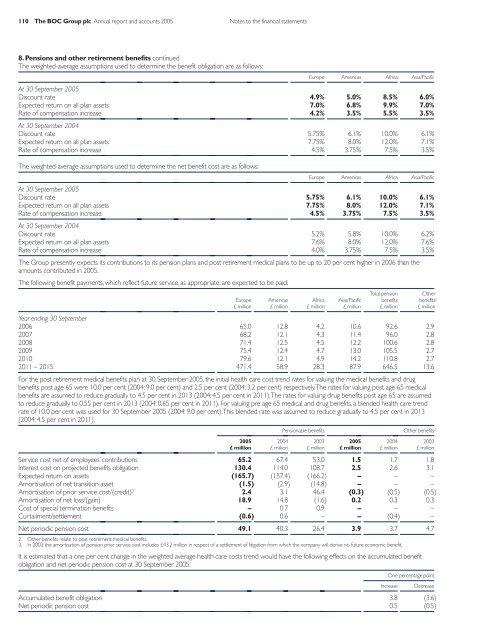
110 The <strong>BOC</strong> Group plc Annual report <strong>and</strong> <strong>accounts</strong> <strong>2005</strong> Notes to the financial statements<br />
8. Pensions <strong>and</strong> other retirement benefits continued<br />
The weighted-average assumptions used to determine the benefit obligation are as follows:<br />
Europe Americas Africa Asia/Pacific<br />
At 30 September <strong>2005</strong><br />
Discount rate 4.9% 5.0% 8.5% 6.0%<br />
Expected return on all plan assets 7.0% 6.8% 9.9% 7.0%<br />
Rate of compensation increase 4.2% 3.5% 5.5% 3.5%<br />
At 30 September 2004<br />
Discount rate 5.75% 6.1% 10.0% 6.1%<br />
Expected return on all plan assets 7.75% 8.0% 12.0% 7.1%<br />
Rate of compensation increase 4.5% 3.75% 7.5% 3.5%<br />
The weighted-average assumptions used to determine the net benefit cost are as follows:<br />
Europe Americas Africa Asia/Pacific<br />
At 30 September <strong>2005</strong><br />
Discount rate 5.75% 6.1% 10.0% 6.1%<br />
Expected return on all plan assets 7.75% 8.0% 12.0% 7.1%<br />
Rate of compensation increase 4.5% 3.75% 7.5% 3.5%<br />
At 30 September 2004<br />
Discount rate 5.2% 5.8% 10.0% 6.2%<br />
Expected return on all plan assets 7.6% 8.0% 12.0% 7.6%<br />
Rate of compensation increase 4.0% 3.75% 7.5% 3.5%<br />
The Group presently expects its contributions to its pension plans <strong>and</strong> post retirement medical plans to be up to 20 per cent higher in 2006 than the<br />
amounts contributed in <strong>2005</strong>.<br />
The following benefit payments, which reflect future service, as appropriate, are expected to be paid:<br />
Total pension Other<br />
Europe Americas Africa Asia/Pacific benefits benefits 2<br />
£ million £ million £ million £ million £ million £ million<br />
Year ending 30 September<br />
2006 65.0 12.8 4.2 10.6 92.6 2.9<br />
2007 68.2 12.1 4.3 11.4 96.0 2.8<br />
2008 71.4 12.5 4.5 12.2 100.6 2.8<br />
2009 75.4 12.4 4.7 13.0 105.5 2.7<br />
2010 79.6 12.1 4.9 14.2 110.8 2.7<br />
2011 – 2015 471.4 58.9 28.3 87.9 646.5 13.6<br />
For the post retirement medical benefits plan at 30 September <strong>2005</strong>, the initial health care cost trend rates for valuing the medical benefits <strong>and</strong> drug<br />
benefits post age 65 were 10.0 per cent (2004: 9.0 per cent) <strong>and</strong> 2.5 per cent (2004: 3.2 per cent) respectively.The rates for valuing post age 65 medical<br />
benefits are assumed to reduce gradually to 4.5 per cent in 2013 (2004: 4.5 per cent in 2011).The rates for valuing drug benefits post age 65 are assumed<br />
to reduce gradually to 0.55 per cent in 2013 (2004: 0.65 per cent in 2011). For valuing pre age 65 medical <strong>and</strong> drug benefits, a blended health care trend<br />
rate of 10.0 per cent was used for 30 September <strong>2005</strong> (2004: 9.0 per cent).This blended rate was assumed to reduce gradually to 4.5 per cent in 2013<br />
(2004: 4.5 per cent in 2011).<br />
Pensionable benefits Other benefits 2<br />
<strong>2005</strong> 2004 2003 <strong>2005</strong> 2004 2003<br />
£ million £ million £ million £ million £ million £ million<br />
Service cost net of employees’ contributions 65.2 67.4 53.0 1.5 1.7 1.8<br />
Interest cost on projected benefits obligation 130.4 114.0 108.7 2.5 2.6 3.1<br />
Expected return on assets (165.7) (157.4) (166.2) – – –<br />
Amortisation of net transition asset (1.5) (2.9) (14.8) – – –<br />
Amortisation of prior service cost/(credit) 3 2.4 3.1 46.4 (0.3) (0.5) (0.5)<br />
Amortisation of net loss/(gain) 18.9 14.8 (1.6) 0.2 0.3 0.3<br />
Cost of special termination benefits – 0.7 0.9 – – –<br />
Curtailment/settlement (0.6) 0.6 – – (0.4) –<br />
Net periodic pension cost 49.1 40.3 26.4 3.9 3.7 4.7<br />
2. Other benefits relate to post retirement medical benefits.<br />
3. In 2003 the amortisation of pension prior service cost includes £43.2 million in respect of a settlement of litigation from which the company will derive no future economic benefit.<br />
It is estimated that a one per cent change in the weighted average health care costs trend would have the following effects on the accumulated benefit<br />
obligation <strong>and</strong> net periodic pension cost at 30 September <strong>2005</strong>:<br />
One percentage point<br />
Accumulated benefit obligation 3.8 (3.6)<br />
Net periodic pension cost 0.5 (0.5)<br />
Increase<br />
Decrease


