E3 Interpreting Motion Graphs
E3 Interpreting Motion Graphs
E3 Interpreting Motion Graphs

Create successful ePaper yourself
Turn your PDF publications into a flip-book with our unique Google optimized e-Paper software.
<strong>E3</strong> <strong>Interpreting</strong> <strong>Motion</strong> <strong>Graphs</strong><br />
I N V E S T<br />
I O N<br />
I G AT<br />
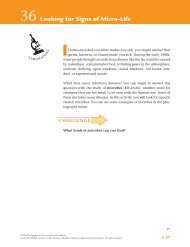
In the previous activity, you calculated the speed of a cart during its<br />
trip on a track. Sometimes, however, the speed of an object changes<br />
during a trip. For example, the driver of a car often changes the speed<br />
of the car because of traffic or road conditions. When the speed of an<br />
object changes over the course of a trip, a motion graph is useful<br />
because it shows the speed during all parts of the trip.<br />
Teasha and Josh live next door to each other at the end of a long straight<br />
road that goes directly to their school. They live four miles from the school,<br />
and their parents drive them there in the mornings.<br />
CHALLENGE<br />
How can you use a graph to describe motion?<br />
Teasha<br />
4 miles<br />
School<br />
Josh<br />
2561 LabAids SEPUP IAPS SB<br />
Figure: PhysSB E 03.01<br />
LegacySansMedium 10/11.5<br />
E-12
<strong>Interpreting</strong> <strong>Motion</strong> <strong>Graphs</strong> • Activity <strong>E3</strong><br />
MATERIALS<br />
For each pair of students<br />
1 set of 8 strips cut from Student Sheet <strong>E3</strong>.1, “Trip Strips”<br />
1 Student Sheet <strong>E3</strong>.2, “Teasha’s and Josh’s Trips<br />
to School”<br />
1 pair of scissors<br />
tape or glue<br />
PROCEDURE<br />
1. Cut apart the 8 trip strips along the dotted lines.<br />
2. Read the trip strips. Each strip represents a story or one or more<br />
pieces of a story for two stories mixed together. Some of the strips<br />
describe Teasha’s trip to school. The others describe Josh’s trip.<br />
3. With your partner, identify the strip that matches each segment of<br />
the two motion graphs shown on Student Sheet <strong>E3</strong>.2, “Teasha’s and<br />
Josh’s Trips to School.”<br />
4. Glue or tape each strip onto the segment of the graph that it<br />
describes.<br />
5. Explain your choices in your science notebook.<br />
E-13
Activity <strong>E3</strong> • <strong>Interpreting</strong> <strong>Motion</strong> <strong>Graphs</strong><br />
ANALYSIS<br />
1. Identify a place on each graph where the slope of the line changes.<br />
What does a change in the slope of a motion graph indicate?<br />
2. Which student—Teasha or Josh—started out faster? Explain how<br />
you know this.<br />
3. How far into the trip did Josh turn around? Describe what the<br />
graph looks like at this point in the trip.<br />
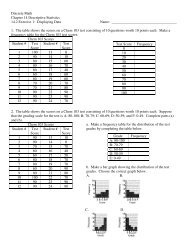
4. Look at the motion graphs shown below. Match the descriptions<br />
here to the correct graphs:<br />
a. A car moving at a constant speed stops and then moves in the<br />
opposite direction at the same speed.<br />
b. A car moving at a constant speed stops and then moves faster<br />
in the same direction.<br />
c. A car moving at a constant speed changes to a higher constant<br />
speed.<br />
d. A car moving at a constant speed changes to a lower constant<br />
speed.<br />
Graph 1 Graph 2<br />
Distance<br />
Distance<br />
Time<br />
Time<br />
2561 Graph LabAids 3 SEPUP IAPS SB 2561 Graph LabAids 4 SEPUP IAPS SB<br />
Figure: PhysSB E 03.02a<br />
Figure: PhysSB E 03.02b<br />
LegacySansMedium 10/11.5<br />
LegacySansMedium 10/11.5<br />
Distance<br />
Distance<br />
Time<br />
Time<br />
E-14<br />
2561 LabAids SEPUP IAPS SB<br />
Figure: PhysSB E 03.02c<br />
LegacySansMedium 10/11.5<br />
2561 LabAids SEPUP IAPS SB<br />
Figure: PhysSB E 03.02d<br />
LegacySansMedium 10/11.5
<strong>Interpreting</strong> <strong>Motion</strong> <strong>Graphs</strong> • Activity <strong>E3</strong><br />
5. A car that accelerates (ak-SELL-ur-ates) is one that changes speed<br />
or direction. Which graph below shows a car continually accelerating?<br />
Explain how the shape of the graph shows this.<br />
Distance<br />
Distance<br />
Time<br />
Time<br />
EXTENSION<br />
2561 LabAids SEPUP IAPS SB<br />
2561 LabAids SEPUP IAPS SB<br />
Figure: PhysSB E 03.03a<br />
Figure: PhysSB E 03.03b<br />
Create LegacySansMedium one or more 10/11.5 new character(s) also LegacySansMedium riding in cars for 10/11.5 the scenario<br />
of this activity. For each character, make up another set of trip<br />
strips and a motion graph to go with them.<br />
E-15