Dashboards Cheat Sheet
Dashboards Cheat Sheet
Dashboards Cheat Sheet

Create successful ePaper yourself
Turn your PDF publications into a flip-book with our unique Google optimized e-Paper software.
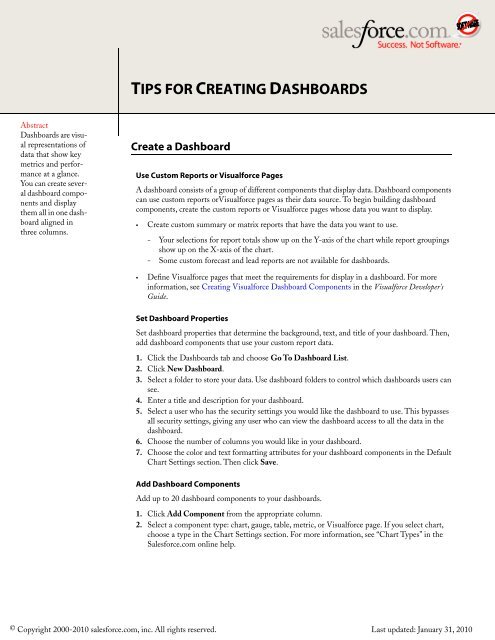
TIPS FOR CREATING DASHBOARDS<br />
Abstract<br />
<strong>Dashboards</strong> are visual<br />
representations of<br />
data that show key<br />
metrics and performance<br />
at a glance.<br />
You can create several<br />
dashboard components<br />
and display<br />
them all in one dashboard<br />
aligned in<br />
three columns.<br />
Create a Dashboard<br />
Use Custom Reports or Visualforce Pages<br />
A dashboard consists of a group of different components that display data. Dashboard components<br />
can use custom reports orVisualforce pages as their data source. To begin building dashboard<br />
components, create the custom reports or Visualforce pages whose data you want to display.<br />
• Create custom summary or matrix reports that have the data you want to use.<br />
- Your selections for report totals show up on the Y-axis of the chart while report groupings<br />
show up on the X-axis of the chart.<br />
- Some custom forecast and lead reports are not available for dashboards.<br />
• Define Visualforce pages that meet the requirements for display in a dashboard. For more<br />
information, see Creating Visualforce Dashboard Components in the Visualforce Developer's<br />
Guide.<br />
Set Dashboard Properties<br />
Set dashboard properties that determine the background, text, and title of your dashboard. Then,<br />
add dashboard components that use your custom report data.<br />
1. Click the <strong>Dashboards</strong> tab and choose Go To Dashboard List.<br />
2. Click New Dashboard.<br />
3. Select a folder to store your data. Use dashboard folders to control which dashboards users can<br />
see.<br />
4. Enter a title and description for your dashboard.<br />
5. Select a user who has the security settings you would like the dashboard to use. This bypasses<br />
all security settings, giving any user who can view the dashboard access to all the data in the<br />
dashboard.<br />
6. Choose the number of columns you would like in your dashboard.<br />
7. Choose the color and text formatting attributes for your dashboard components in the Default<br />
Chart Settings section. Then click Save.<br />
Add Dashboard Components<br />
Add up to 20 dashboard components to your dashboards.<br />
1. Click Add Component from the appropriate column.<br />
2. Select a component type: chart, gauge, table, metric, or Visualforce page. If you select chart,<br />
choose a type in the Chart Settings section. For more information, see “Chart Types” in the<br />
Salesforce.com online help.<br />
© Copyright 2000-2010 salesforce.com, inc. All rights reserved. Last updated: January 31, 2010
Tips for Creating <strong>Dashboards</strong><br />
• If you select a chart type, you can embed a URL other than the source report to allow users<br />
to click the dashboard component and drill down to another dashboard, report, record detail<br />
page, or another system that uses a Web interface.<br />
• Visualforce pages must meet certain requirements to be displayed in dashboards; otherwise,<br />
they don't appear in the Visualforce Page drop-down list.Dashboard components that<br />
use Visualforce ignore the Running User; content displays only if the viewing user has<br />
access to the Visualforce page. Other components in the dashboard are not affected.<br />
3. Optionally, enter a header, footer, and unit of measurement.<br />
4. Depending on the chart type, select appropriate chart settings. (See the following sections for<br />
examples.)<br />
5. Click Save. Repeat this process for each new dashboard component.<br />
Chart types include:<br />
Chart: Horizontal Bar<br />
Chart: Horizontal Bar, Grouped<br />
Chart: Horizontal Bar, Stacked<br />
Chart: Horizontal Bar, Stacked to 100%<br />
Chart: Vertical Column<br />
Chart: Vertical Column, Grouped<br />
Chart: Vertical Column, Stacked<br />
Chart: Vertical Column, Stacked to 100%<br />
Chart: Line<br />
Chart: Line, Grouped<br />
Chart: Line, Cumulative<br />
2
Tips for Creating <strong>Dashboards</strong><br />
Chart: Line, Grouped Cumulative<br />
Chart: Pie<br />
Chart: Donut<br />
Chart: Funnel<br />
Organize Your Dashboard Components<br />
Organize your dashboard components in up to three columns. Each column can be a different<br />
width and your components automatically resize as you move them around.<br />
1. Set column width with Column Size options: Narrow, Medium, or Wide.<br />
2. Move components using the appropriate arrow buttons.<br />
3. Click Refresh to update the data in your dashboard.<br />
4. Click Edit just above any component to change its attributes.<br />
Creating Gauge Components<br />
Use the gauge to see how far you are from reaching your goal. For example, create a summary<br />
opportunity report sorted by Opportunity Owner and total by the amounts of each opportunity<br />
in your pipeline. Then create a dashboard component using this report as a source and set your<br />
own gauge colors and breakpoint values. Note that if you do not define the breakpoints,<br />
Salesforce.com uses 0, 1, 2, and 3 by default.<br />
Creating Pie Charts<br />
Use pie charts to compare values of a similar type. For example, create an activity report summarized<br />
by assignee that shows the total number of activities modified within the year, month, or week.<br />
Then create a dashboard component using this report and the pie chart type with the following<br />
settings:<br />
Chart Setting<br />
Chart Type<br />
Values<br />
Description<br />
Choose Pie.<br />
Choose the type of data to display as values for your chart.<br />
3
Tips for Creating <strong>Dashboards</strong><br />
Chart Setting<br />
Wedges<br />
Title<br />
Sort By<br />
Maximum Values<br />
Displayed<br />
Legend Position<br />
Show Labels<br />
Show Values<br />
Show Wedge %<br />
Show Details on<br />
Hover<br />
Description<br />
Choose the type of data to display as wedges for your chart.<br />
Enter an identifying name for the pie chart.<br />
This option does not affect pie charts.<br />
Enter the maximum number of elements to include in the pie chart.<br />
For example, if you only want to see the top 4 people with the most<br />
activities, enter 4.<br />
Choose where you want the legend displayed with respect to the chart.<br />
Check this option to display labels on the chart.<br />
Check this option to display the values of individual records or groups<br />
on the chart.<br />
Check this option to display the percentage value for each wedge of<br />
the pie chart.<br />
Check this option to display values, labels, and percentages when<br />
hovering over each wedge.<br />
Creating Bar and Column Charts<br />
Use bar or column charts to compare totals using horizontal bars or vertical columns. For example,<br />
create a stacked column chart that indicates which reps are selling which products. Start by building<br />
a matrix opportunity report that includes products. Group your data by Opportunity Owner and<br />
Product Name and total by Quantity. Then, create a dashboard component using the following<br />
chart settings:<br />
Chart Setting<br />
Chart Type<br />
Title<br />
Sort By<br />
Maximum Values<br />
Displayed<br />
Legend Position<br />
Description<br />
Choose Vertical Column - Stacked.<br />
Enter a name for your chart.<br />
Enter a sorting option. For example, use Row Value Descending to<br />
show the name of the rep with the most first from left to right.<br />
Leave this blank to see all opportunity owners. For example, if you<br />
only want to see the top five salespeople, enter 5.<br />
Choose where you want the legend displayed with respect to the chart.<br />
4
Tips for Creating <strong>Dashboards</strong><br />
Refreshing <strong>Dashboards</strong><br />
• On a dashboard, users can click Refresh to replenish the dashboard with the most recent data.<br />
• Users with the “Schedule <strong>Dashboards</strong>” permission in Enterprise and Unlimited Editions can<br />
schedule dashboards to refresh daily, weekly, or monthly so that users do not have to wait for<br />
the most recent data to refresh.<br />
• Upon completion of the dashboard refresh, Salesforce.com sends an email notification to selected<br />
users and groups that includes the refreshed dashboard.<br />
• Dashboard components that include Visualforce pages and s-controls may not display in<br />
dashboard refresh notifications. Users must log in to Salesforce.com to view Visualforce and<br />
s-control data displayed in real-time.<br />
• For more information on how to schedule a dashboard refresh, see the Salesforce.com online<br />
help.<br />
Troubleshooting <strong>Dashboards</strong><br />
Why does my chart look blank?<br />
Are you using a tabular report? Dashboard components can only display data from “Top<br />
Item” tabular reports, summary, and matrix reports.<br />
Why are my grouped charts not grouping correctly?<br />
Are you using a summary or matrix report? Grouped or stacked charts must reference summary<br />
or matrix reports.<br />
How do I create dashboard components out of standard reports?<br />
Use the Save As option to save a report as a custom report.<br />
5