Negative bias temperature instability: What do we understand?
Negative bias temperature instability: What do we understand?
Negative bias temperature instability: What do we understand?

You also want an ePaper? Increase the reach of your titles
YUMPU automatically turns print PDFs into web optimized ePapers that Google loves.
Microelectronics Reliability 47 (2007) 841–852<br />
www.elsevier.com/locate/microrel<br />
<strong>Negative</strong> <strong>bias</strong> <strong>temperature</strong> <strong>instability</strong>: <strong>What</strong> <strong>do</strong> <strong>we</strong> <strong>understand</strong>?<br />
Dieter K. Schroder<br />
Department of Electrical Engineering and Center for Solid State Electronics Research, Arizona State University, Tempe, AZ 85287-5706, USA<br />
Received 24 May 2006; received in revised form 31 August 2006<br />
Available online 1 December 2006<br />
Abstract<br />
We present a brief overview of negative <strong>bias</strong> <strong>temperature</strong> <strong>instability</strong> (NBTI) commonly observed for in p-channel metal–oxide–semiconductor<br />
field-effect transistors (MOSFETs) when stressed with negative gate voltages at elevated <strong>temperature</strong>s and discuss the results<br />
of such stress on device and circuit performance and review interface traps and oxide charges, their origin, present <strong>understand</strong>ing, and<br />
changes due to NBTI. Next <strong>we</strong> discuss some of the models that have been proposed for both NBTI degradation and recovery and<br />
p- versus n-MOSFETs. We also address the time and energy dependence effects of NBTI and crystal orientation. Finally <strong>we</strong> mention<br />
some aspect of circuit degradation. The general conclusion is that although <strong>we</strong> <strong>understand</strong> much about NBTI, several aspects are poorly<br />
understood. This may be due to a lack of a basic <strong>understand</strong>ing or due to varying experimental data that are likely the result of sample<br />
preparation and measurement conditions.<br />
Ó 2006 Published by Elsevier Ltd.<br />
1. Introduction<br />
<strong>Negative</strong> <strong>bias</strong> <strong>temperature</strong> <strong>instability</strong> has been known<br />
since 1966 [1]. It is only during the last few years, ho<strong>we</strong>ver,<br />
that it has become a reliability issue in silicon integrated<br />
circuits, because the gate electric fields have increased as<br />
a result of scaling, increased chip operating <strong>temperature</strong>,<br />
surface p-channel MOSFETs have replaced buried channel<br />
devices, and nitrogen is routinely added to thermally grown<br />
SiO 2 . In 2003, <strong>we</strong> wrote a review paper on NBTI and tried<br />
to include most of the published literature up to that time<br />
[2]. Although many papers had been published at that time,<br />
there was much discrepancy bet<strong>we</strong>en the various models<br />
and the experimental data. For example, it was poorly<br />
understood that the time bet<strong>we</strong>en NBTI stress and measuring<br />
the effect after terminating the stress was important,<br />
because the NBTI recovery was just beginning to be understood.<br />
Now it is understood that the sooner a degraded<br />
device is measured after stress, i.e., within ms or sooner,<br />
the more relevant are the data. Since the publication of<br />
our paper, many more papers have been published and<br />
NBTI is beginning to be understood better. Nevertheless,<br />
E-mail address: schroder@asu.edu<br />
there are still many gaps and experimental data sometimes<br />
contradict each other. Several excellent review papers have<br />
since been published. In this paper, I will draw upon the<br />
excellent recent reviews by Stathis and Zafar [3], Huard<br />
et al. [4], and Alam and Mahapatra [5] as <strong>we</strong>ll as many<br />
other papers published in the last few years. In particular,<br />
the careful, detailed measurements of Huard et al. have<br />
confirmed or debunked some earlier assumptions and I<br />
draw heavily on their results. I have attempted to highlight<br />
those NBTI areas where there is considerable uncertainty<br />
and where experimental results contradict each other. To<br />
highlight our <strong>understand</strong>ing or mis<strong>understand</strong>ing I have<br />
ended most sections with questions.<br />
2. <strong>What</strong> is NBTI?<br />
NBTI is an increase in the absolute threshold voltage, a<br />
degradation of the mobility, drain current, and transconductance<br />
of p-channel MOSFETs. It is almost universally<br />
attributed to the creation of interface traps and oxide<br />
charge by a negative gate <strong>bias</strong> at elevated <strong>temperature</strong>.<br />
The oxide electric field is usually, but not always, lo<strong>we</strong>r<br />
than that leading to hot carrier degradation. The oxide<br />
electric field and <strong>temperature</strong> are similar to those typically<br />
0026-2714/$ - see front matter Ó 2006 Published by Elsevier Ltd.<br />
<strong>do</strong>i:10.1016/j.microrel.2006.10.006
842 D.K. Schroder / Microelectronics Reliability 47 (2007) 841–852<br />
encountered during burn-in and sometimes encountered<br />
during high-performance chip operation. The details of<br />
how NBTI occurs are not entirely clear, ho<strong>we</strong>ver. Since<br />
much has been written about the origin of NBTI, <strong>we</strong> will<br />
touch on it only briefly. The mechanism is ascribed to<br />
breaking of SiH bonds at the SiO 2 /Si substrate interface<br />
by a combination of electric field, <strong>temperature</strong>, and holes,<br />
resulting in dangling bonds or interface traps at that interface,<br />
designated as D it and N it , and positive oxide charge,<br />
N ot , that may be due to H + or trapped holes. Detailed measurements<br />
by various researchers have shown the activation<br />
energy and time dependence to differ for D it and N ot<br />
generation.<br />
3. NBTI models<br />
ΔN it<br />
(cm -2 )<br />
10 12<br />
10 11<br />
10 10<br />
V G =-2.2 V<br />
T=125 o C<br />
t ox =1.8 nm<br />
10 9<br />
10 -3 10 -2 10 -1 10 0 10 1 10 2<br />
Various NBTI models have been proposed, of which the<br />
Reaction–Diffusion (R–D) model is the most prevalent [5–<br />
7]. In this model, interface traps are generated at the<br />
SiO 2 /Si interface (reaction) with a linear dependence on<br />
stress time. Hydrogen is released during this reaction<br />
phase. In the subsequent diffusion phase, the hydrogen diffuses<br />
from the interface into the oxide (diffusion) with the<br />
time dependence t n , where n for neutral hydrogen species<br />
is frequently given as 0.25. It may also be possible for<br />
hydrogen to diffuse into the substrate. While the diffusion-limited<br />
regime has been verified many times, the reaction-limiting<br />
regime has not as frequently been observed,<br />
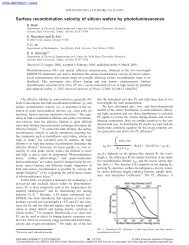
because it occurs during a very short time. Yang et al.<br />
extended the stress measurement times from 10 3 to 10 2 s<br />
and show the n = 1 and n = 0.25 dependence, with the<br />
breakpoint bet<strong>we</strong>en the two regimes occurring at<br />
t 0.02–0.03 s, shown in Fig. 1 [8]. A caution about the<br />
data in Ref. [8]. The measurements are affected by the<br />
stress-to-measure delay and the n = 1 value is likely to be<br />
lo<strong>we</strong>r if this delay is considered. By measuring NBTI degradation<br />
as a function of nitrogen density in nitrided oxides,<br />
they conclude that D it generation is enhanced by<br />
nitrogen and it is mainly due to enhanced hydrogen diffusion<br />
in the nitrided oxide. This enhanced diffusion aids<br />
D it generation.<br />
The generation of interface traps is given by [8]<br />
2At<br />
DN it ðtÞ ¼ pffiffiffiffiffiffiffiffiffiffiffiffiffiffiffiffiffiffiffiffiffiffiffi<br />
1 þ 1 þ 4ABt 3=2<br />
2k F N 0 t<br />
¼ p<br />
1 þ ffiffiffiffiffiffiffiffiffiffiffiffiffiffiffiffiffiffiffiffiffiffiffiffiffiffiffiffiffiffiffiffiffiffiffiffiffiffiffiffiffiffiffiffiffiffiffiffiffiffiffiffiffiffiffi p<br />
1 þ 4k F N 0 k R t 3=2 =ð0:5 ð1Þ<br />
D HÞ<br />
where k F is the forward reaction rate, k R the reverse reaction<br />
rate, N 0 the initial defect density, and D H the hydrogen<br />
diffusion coefficient. According to Eq. (1), for small t during<br />
the reaction phase of NBTI degradation<br />
DN it ðtÞ At ¼ k F N 0 t<br />
ð2aÞ<br />
and during the diffusion phase at later times<br />
rffiffiffi<br />
rffiffiffiffiffiffiffiffiffiffi<br />
A<br />
DN it ðtÞ t 1=4 k F N 0<br />
¼ ðD H tÞ 1=4<br />
ð2bÞ<br />
B 2k R<br />
Eq. (1) is plotted in Fig. 1 together with experimental data.<br />
There is little controversy about the applicability of the<br />
R–D model to NBTI. <strong>What</strong> is still debated is the time exponent<br />
n, which is predicted to be 0.25 above, but frequently<br />
observed to be lo<strong>we</strong>r. The true value is important to be able<br />
to predict NBTI lifetimes. The generation of interface traps<br />
is universally accepted, but, the nature of the positive<br />
oxide charge generated during NBTI stress is not clear<br />
yet. It has been attributed to hole traps and also to trapped<br />
hydrogen.<br />
Question: Is the R&D model the best model? Does reaction<br />
<strong>do</strong>minate at short times and diffusion at longer times?<br />
<strong>What</strong> is the true n value?<br />
4. Interface traps and oxide charges<br />
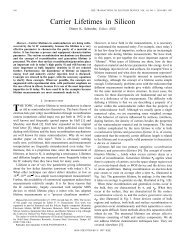
Silicon is tetrahedrally bonded with each Si atom<br />
bonded to four Si atoms in the wafer bulk. When the Si<br />
is oxidized, the bonding configuration at the surface is as<br />
shown in Fig. 2(a) for (111) and (b) for (100) orientation<br />
with most Si atoms bonded to oxygen. Some Si atoms bond<br />
to hydrogen. An interface trapped charge, often called<br />
interface trap, is an interface trivalent Si atom with an<br />
unsaturated (unpaired) valence electron at the SiO 2 /Si<br />
interface, denoted by<br />
Si 3 Si<br />
ð3Þ<br />
Si O H P b<br />
P b0<br />
P b1<br />
Stress Time (s)<br />
Fig. 1. Measured and simulated interface trap density change DN it versus<br />
stress time for 15% nitrogen concentration. In Eq. (1): A = 2.67 ·<br />
10 12 cm 2 /s, B = 6.95 · 10 11 cm 2 /s 1/2 , D H = 8.28 · 10 16 cm 2 /s, W/L =<br />
20 lm/0.15 lm. After Yang et al. [8].<br />
Silicon (111)<br />
Silicon (100)<br />
Fig. 2. Structural model of the (a): (111)Si surface and (b): (100)Si<br />
surface.
D.K. Schroder / Microelectronics Reliability 47 (2007) 841–852 843<br />
The ‘‘’’ represents three complete bonds to other Si atoms<br />
(the Si 3 ) and the ‘‘•’’ represents the fourth, unpaired electron<br />
in a dangling orbital (dangling bond). Interface traps<br />
are also known as P b centers [9]. Interface traps are designated<br />
as D it (cm 2 eV 1 ), Q it (C/cm 2 ), and N it (cm 2 ).<br />
On (111)-oriented wafers, the P b center is a Si 3 Si•<br />
center, situated at the Si/SiO 2 interface with its unbonded<br />
central-atom orbital perpendicular to the interface and<br />
aimed into a vacancy in the oxide immediately above it,<br />
as shown in Fig. 2(a). On (100)Si, the four tetrahedral<br />
Si–Si directions intersect the interface plane at the same<br />
angle. Two defects, named P b1 and P b0 , have been detected<br />
by electron spin resonance (ESR), shown in Fig. 2(b). The<br />
P b1 center was originally thought to be a Si atom backbonded<br />
to two substrate Si atoms, with the third saturated<br />
bond attached to an oxygen atom, designated as<br />
Si 2 O Si•. This identification was found to be incorrect,<br />
as the calculated energy levels for this defect <strong>do</strong> not agree<br />
with experiment [10]. A recent calculation suggests the<br />
P b1 center to be an asymmetrically oxidized dimer, with<br />
no first neighbor oxygen atoms [11]. By 1999, it was unambiguously<br />
established that both P b0 and P b1 are chemically<br />
identical to the P b center [12]. Ho<strong>we</strong>ver, there is a charge<br />
state difference bet<strong>we</strong>en these two centers indicating P b0<br />
is electrically active, while some authors believe the P b1<br />
to be electrically inactive [13]. The two different effects<br />
are the result of strain relief in (100) silicon. The defects<br />
result from the naturally occurring mismatch-induced<br />
stress at the SiO 2 /Si interface during oxide growth.<br />
P b0 centers result when strain relaxation occurs with a<br />
defect residing at (111) microfacets at the Si/SiO 2 interface,<br />
while P b1 centers result when strain relaxation occurs<br />
with a defect at (100)Si/SiO 2 transition regions. Based on<br />
these results and the fact that P b1 centers are believed to<br />
be electrically inactive, defects resulting from P b0 centers<br />
are considered the key culprits in creating interface traps<br />
in (100) silicon. It is worth mentioning that recent work<br />
indicates P b1 centers to be electrically inactive at low <strong>temperature</strong>s<br />
(T = 77 K). Ho<strong>we</strong>ver, at room <strong>temperature</strong> and<br />
higher these defects contribute to the electrical activity of<br />
total interface traps [14]. Recent ESR measurements show<br />
the P b1 center to be electrically active with two distinct,<br />
narrow peaks close to midgap in the silicon band gap<br />
[15]. Ho<strong>we</strong>ver, P b1 centers are typically generated at densities<br />
considerably lo<strong>we</strong>r than P b0 centers, making them<br />
potentially less important.<br />
Interface traps are electrically active defects with an<br />
energy distribution throughout the Si band gap. They act<br />
as generation/recombination centers and contribute to<br />
leakage current, low-frequency noise, and reduced mobility,<br />
drain current, and transconductance. Since electrons<br />
or holes occupy interface traps, they become charged and<br />
contribute to threshold voltage shifts. The surface potential<br />
dependence of the occupancy of interface traps is illustrated<br />
in Fig. 3.<br />
Interface traps at the SiO 2 /Si interface are acceptor-like<br />
in the upper half and <strong>do</strong>nor-like in the lo<strong>we</strong>r half of the<br />
Acceptors<br />
Donors "0"<br />
"0"<br />
D it<br />
E<br />
"0"<br />
C<br />
"+"<br />
E<br />
"-" F "0"<br />
E i<br />
band gap [16]. Hence, as shown in Fig. 3(a), at flatband,<br />
with electrons occupying states below the Fermi energy,<br />
the states in the lo<strong>we</strong>r half of the band gap are neutral<br />
(occupied <strong>do</strong>nors designated by ‘‘0’’). Those bet<strong>we</strong>en midgap<br />
and the Fermi energy are negatively charged (occupied<br />
acceptors designated by ‘‘ ‘‘), and those above E F are neutral<br />
(unoccupied acceptors). For an inverted p-MOSFET,<br />
shown in Fig. 3(b), the fraction of interface traps bet<strong>we</strong>en<br />
mid gap and the Fermi level is now unoccupied <strong>do</strong>nors,<br />
leading to positively charged interface traps (designated<br />
by ‘‘+’’). Hence interface traps in p-channel devices in<br />
inversion are positively charged, leading to negative threshold<br />
voltage shifts. <strong>Negative</strong> <strong>bias</strong> stress generates <strong>do</strong>nor<br />
states in the lo<strong>we</strong>r half of the band gap [17,18].<br />
The oxide charge that contributes to NBTI is not <strong>we</strong>ll<br />
understood. Oxide charge can consist of various entities,<br />
including mobile charge, e.g., Na, K, Li, oxide trapped<br />
charge, e.g., electrons and/or holes, and fixed charge. We<br />
exclude mobile charge, because NBTI is observed when<br />
there is no mobile charge. Oxide charge is located within<br />
the oxide and may communicate with the Si conduction<br />
and valence bands and it is positive. Some believe it is<br />
H + trapped in the oxide near the SiO 2 /Si interface. Ho<strong>we</strong>ver,<br />
it is generally believed that hole trapping is the <strong>do</strong>minant<br />
mechanism and that the hole traps or their precursors<br />
may exist in the insulator prior to the stress.<br />
The traps are positively charged when occupied by holes<br />
and neutral when unoccupied. It is possible that such positively<br />
charged traps can be neutralized by electrons when<br />
the n-substrate is at flatband and in accumulation. Similar<br />
traps have been proposed to be responsible for lowfrequency<br />
(lf) noise where electrons or holes tunnel into<br />
traps [19]. The trap distance from the SiO 2 /Si interface<br />
determines the tunnel time and hence the lf noise frequency<br />
response. Typical trap distances are 1–2 nm. The range 0.9–<br />
1.75 nm covers the frequency range 1–10 4 Hz where 10 Hz<br />
corresponds to 2 nm distance. If carriers can tunnel over<br />
this frequency range that would correspond to tunnel times<br />
of 10 4 –1 s and suggests that the positive charge can be discharged<br />
in very short times, as suggested by NBTI experiments.<br />
Oxide charge located closer to the oxide/substrate<br />
E V<br />
E C<br />
E F<br />
E i<br />
Fig. 3. Band diagrams of the Si substrate of a p-channel MOS device<br />
showing the occupancy of interface traps and the various charge polarities<br />
for a p-substrate with (a) negative interface trap charge at flatband and (b)<br />
positive interface trap charge at inversion. Each of the small horizontal<br />
lines represents an interface trap. It is either occupied by an electron (solid<br />
circle) or occupied by a hole (unoccupied by an electron), shown by the<br />
lines.<br />
E V
844 D.K. Schroder / Microelectronics Reliability 47 (2007) 841–852<br />
after low-<strong>temperature</strong> forming gas anneal. This suggests<br />
interface leads to higher threshold voltage shifts than charge<br />
10 13 cm 2 which is reduced to approximately 10 10 cm 2 to be primarily due to interface trap passivation, not due<br />
near the gate/oxide interface. It is rarely pointed out that that DV T may approach 100 mV or higher after prolonged<br />
charge build-up in the oxide also alters the oxide electric<br />
field. Depending on the charge and their location, the oxide<br />
electric field may increase or decrease locally, e.g., near the<br />
SiO 2 /substrate interface.<br />
The NBTI threshold voltage change <strong>do</strong>es not depend on<br />
the hole density, determined by changing the channel hole<br />
stress before the 10 12 –10 13 cm 2 SiH bonds are broken.<br />
Question: While it is generally accepted that interface<br />
traps are one of the NBTI culprits, the oxide charge is less<br />
<strong>we</strong>ll understood. Is the positive charge due to hydrogen or<br />
trapped holes? Are the hole traps induced by NBTI stress<br />
or are they pre-existent in the oxide?<br />
density and measuring the threshold voltage change. The<br />
hole density can be changed by changing V T through fabrication<br />
or substrate <strong>bias</strong>. When this was <strong>do</strong>ne, there was<br />
very little change in interface trap generation, indicating 5. NBTI recovery<br />
that hole density is a secondary effect [4,20]. Ho<strong>we</strong>ver, it<br />
appears that holes are required for NBTI degradation. Until recently, most NBTI measurements <strong>we</strong>re made by<br />
The p-MOSFET threshold voltage is<br />
stressing the device, then measuring the threshold voltage,<br />
interface trap density, drain current, transconductance or<br />
Q<br />
V T ¼ / ox Q it ð2/ F Þ Q<br />
MS<br />
2/ S<br />
C ox C F ð4Þ other device parameter. But, there is usually a time delay<br />
ox C ox<br />
bet<strong>we</strong>en stress and characterization and that delay time<br />
where / MS is the work function difference bet<strong>we</strong>en the gate was frequently not given in the published papers and it<br />
and substrate, / F the Fermi potential, Q ox the positive may have varied widely. More recently, it was found that<br />
oxide charge density, Q S the semiconductor charge density, the time delay is very important, because the stress damage<br />
and C ox the oxide capacitance/unit area. Q it , shown to be recovers very rapidly. It may take many seconds to generate<br />
dependent on the surface potential in Fig. 3, is given by NBTI damage, but it recovers within a few seconds! Does<br />
the NBTI damage recover completely? That is not clear<br />
Q it ¼ qD it DE ¼ qN it<br />
ð5Þ and the reported values depend on the authors. Ershov<br />
where DE is the energy range over which interface traps are et al. propose that there are two degradation components:<br />
active. Q it may be positive or negative (Fig. 3).<br />
a permanent component which remains after stress removal<br />
Since neither gate nor substrate <strong>do</strong>ping density nor and a reversible component that recovers [21]. Rangan<br />
oxide thickness change during stress, the threshold voltage et al., on the other hand, show complete recovery with the<br />
change is due to changes in Q ox and Q it as<br />
device being reset to its original state after the stress is<br />
removed [22]. Huard et al. have <strong>do</strong>ne extensive measurements<br />
DV T ¼<br />
DQ and find partial recovery [4]. They attribute NBTI<br />
ox þ DQ it<br />
¼ qðDN ox þ DN it Þ<br />
t ox<br />
C ox K ox e 0<br />
degradation to interface trap generation and hole trapping,<br />
¼ 4:6 10 7 ðDN ox þ DN it Þt ox ð6Þ<br />
N ot and claim the recovery to be due to N ot recovery with<br />
D it remaining largely unchanged during the recovery phase.<br />
In today’s ICs, N ox and N it are approximately 10 10 cm 2 or<br />
slightly less before stress. Typical DV T is on the order of<br />
Fig. 4 shows the threshold voltage and interface trap density<br />
change during stress and recovery periods. Both DV T and<br />
10 mV leading to DN ox + DN it 10 11 cm 2 for t ox = DN it change proportionally during stress, but only DV T<br />
2 nm, showing the NBTI-generated charges/states are typically<br />
higher than the starting values. How many SiH bonds<br />
are there to be dissociated? After Si oxidation, N it =10 12 –<br />
shows a significant drop during the recovery phase with<br />
DN it remaining almost constant. In contrast, Yang et al.<br />
show the threshold voltage recovery after stress cessation<br />
1<br />
1<br />
0.8<br />
0.8<br />
Relative ΔV T<br />
0.6<br />
0.4<br />
Relative ΔN it<br />
0.6<br />
0.4<br />
0.2<br />
V G 0<br />
T=125<br />
0<br />
o C<br />
0 1000 2000 3000<br />
Stress Time (s)<br />
0.2<br />
V G 0<br />
T=125<br />
0<br />
o C<br />
0 1000 2000 3000<br />
Stress Time (s)<br />
Fig. 4. Relative shifts for (a) DV T and (b) DN it versus stress time for negative and positive gate voltages [4].
D.K. Schroder / Microelectronics Reliability 47 (2007) 841–852 845<br />
to hole de-trapping [23]. This passivation effect is enhanced<br />
by positive gate <strong>bias</strong> during the recovery phase.<br />
Why <strong>do</strong>es the N ot -controlled portion of V T recovery<br />
occur? If N ot is due to trapped holes, then the holes can<br />
be emitted during recovery. For +V G recovery <strong>bias</strong>, it is<br />
possible that accumulation electrons near the Si surface<br />
are injected or tunnel into the oxide to neutralize the<br />
trapped holes or that holes are ‘‘pushed’’ out of the traps.<br />
How <strong>do</strong> the hole traps originate? The trap generation is<br />
possibly related to hydrogen released from the SiH bonds<br />
at the interface and more traps are generated in nitrided<br />
oxides than in SiO 2 . But what is the mechanism?<br />
Tsujikawa et al. investigated NBTI recovery and found<br />
that V T recovered more than D it with zero or positive gate<br />
voltage during recovery [24]. They attributed N ot to hole<br />
trapping induced by hydrogen and these positive charges<br />
are neutralized by electrons in the accumulation layer when<br />
the MOSFET is <strong>bias</strong>ed to +V G . They correlated NBTI damage<br />
to stress-induced leakage current (SILC) and timedependent<br />
dielectric break<strong>do</strong>wn (TDDB) through oxide<br />
traps generated during NBTI stress. Ang, during NBTI<br />
recovery measurements, found that while V T recovers for<br />
V G = 0 and V G >0, D it hardly recovers at all for V G >0<br />
[25] in agreement with Huard et al., showing that D it recovery<br />
is suppressed under +V G recovery <strong>bias</strong>. Ho<strong>we</strong>ver, the<br />
mechanism is not yet understood. If D it hardly recovers,<br />
<strong>do</strong>es that imply that hydrogen <strong>do</strong>es not diffuse back to the<br />
SiO 2 /Si substrate interface during recovery?<br />
NBTI recovery leads to less severe device/circuit degradation<br />
under ac operation compared to dc and depends on<br />
the gate voltage duty cycle [21]. Most NBTI degradation<br />
measurements, ho<strong>we</strong>ver, are made with dc <strong>bias</strong>. The lifetime<br />
enhancement can be significant. The accelerated lifetime<br />
factor for ac operation is<br />
<br />
F ¼ t n<br />
2<br />
) t 2 ¼ t 1 F 1=n<br />
ð7Þ<br />
t 1<br />
Eq. (7) predicts lifetime enhancements of t 2 /t 1 = 16 for<br />
n = 0.25 and 76 for n = 0.16 for 50% ac NBTI degradation,<br />
pointing out the importance of an accurate knowledge of<br />
the n-factor. Since, as <strong>we</strong> show later, n depends on the time<br />
lag bet<strong>we</strong>en stress and recovery, it then also depends on the<br />
frequency or duty cycle of the ac signal.<br />
Question: <strong>What</strong> fraction of recovery is due to interface<br />
traps and oxide charge? Are oxide traps generated during<br />
NBTI stress? How <strong>do</strong>es N ot recovery work?<br />
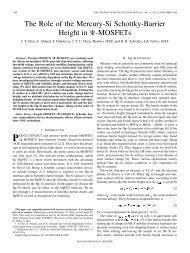
6. Why are p-MOSFETs different from n-MOSFETs?<br />
NBTI is observed in both p-MOSFETs and n-MOS-<br />
FETs. Ho<strong>we</strong>ver, the effect is more extreme in p-MOSFETs.<br />
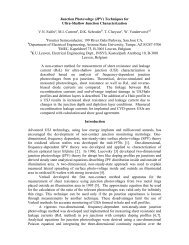
<strong>What</strong> is the reason for this? Fig. 5 shows the threshold voltage<br />
shift from two different research groups when p- and<br />
n-MOSFETs are <strong>bias</strong>ed with positive and negative gate<br />
voltages [17,4]. Clearly p-MOSFETs under negative gate<br />
<strong>bias</strong> are the most severely affected. It is commonly assumed<br />
that holes are necessary for NBTI degradation and since n-<br />
MOSFETs <strong>bias</strong>ed into accumulation also have holes at the<br />
surface, they should show similar V T degradation. But they<br />
<strong>do</strong> not. We will put forward several explanations for this.<br />
Tsetseris et al. propose the following NBTI model [26].<br />
Their first-principles calculations show that positively<br />
charged hydrogen or protons, H + , react directly with the<br />
SiH to form interface traps, according to the reaction<br />
Si 3 SiH þ H þ ! Si 3 Si þH 2<br />
where Si 3 SiH is a hydrogen-terminated interface trap<br />
and Si 3 Si• an interface trap with the <strong>do</strong>t representing<br />
the dangling bond. As shown in Fig. 6, the hydrogen is assumed<br />
to originate from phosphorus-hydrogen bonds in<br />
the n-Si substrate. The P–H bonds dissociate and the<br />
hydrogen on the way to the SiO 2 /Si interface ‘‘picks up’’<br />
a hole to become H + , then reacts with the H from the<br />
SiH bond to form H 2 leaving behind a positively charged<br />
H<br />
_<br />
Si<br />
-V G H<br />
_ H-P<br />
Si<br />
H<br />
_<br />
Si n -Si<br />
_<br />
H Si P<br />
-V H 2 _ H<br />
G Si<br />
H + _<br />
Si<br />
n -Si<br />
Fig. 6. Possible interface trap creation by hydrogen.<br />
ð8Þ<br />
10<br />
|V G |= 2.8 V<br />
T=105 o C<br />
p-MOS NBTI<br />
10<br />
p-MOS NBTI<br />
p-MOS PBTI<br />
-ΔV T (mV)<br />
1<br />
0.1<br />
n-MOS NBTI<br />
n-MOS PBTI<br />
p-MOS PBTI<br />
0.01<br />
10 0 10 1 10 2 10 3 10 4<br />
Stress Time (s)<br />
-ΔV T (au)<br />
1<br />
n-MOS NBTI<br />
0.1<br />
n-MOS PBTI<br />
|V G |= V<br />
T=125 o C<br />
0.01<br />
10 0 10 1 10 2 10 3 10 4<br />
Stress Time (s)<br />
Fig. 5. Threshold voltage shifts for p- and n-MOSFETs for positive and negative gate <strong>bias</strong> [17,4].
846 D.K. Schroder / Microelectronics Reliability 47 (2007) 841–852<br />
Si dangling bond (or trapping center). The H 2 diffuses from<br />
the interface into the oxide or poly-Si gate. It can later passivate<br />
a dangling bond by diffusing back to the interface<br />
when the stress voltage is interrupted. The reason for the<br />
reduced NBTI activity in n-MOSFETs in this model is that<br />
it is more difficult for boron-hydrogen bonds to be broken<br />
in p-Si substrates. So the different behavior of p- versus n-<br />
MOSFETs in this model is due to the ease or difficulty of<br />
breaking P–H and B-H bonds in the Si substrate. Threshold<br />
voltage shifts in this case are due to interface traps,<br />
oxide charge, and a change in the substrate <strong>do</strong>ping density<br />
after P–H or B-H depassivation.<br />
Another explanation depends on the N it and N ot charge<br />
states. Interface traps, being acceptors in the upper half of<br />
the band gap and <strong>do</strong>nors in the lo<strong>we</strong>r half, affect V T shifts<br />
in n- and p-MOSFETs differently. Fig. 7 shows the band<br />
diagram of n-channel in (a) and p-channel devices in (b).<br />
At flatband, the n-channel has positive and the p-channel<br />
has negative interface trap charge. At inversion, / s j2/ F j,<br />
the n-channel has negative and the p-channel has positive<br />
interface trap charge. Since the oxide charge is positive<br />
in both cases, <strong>we</strong> have at inversion: n-channel: Q ox Q it ,<br />
p-channel: Q ox + Q it , hence p-channel MOSFETs are more<br />
severely affected. This was clearly shown by Sinha and<br />
Smith where the threshold voltage of MOS capacitors on<br />
(111)n-Si decreases by 1.5 V while V T of (111)p-Si<br />
decreases by only about 0.2 V [27].<br />
Let us put this into quantitative terms. For DN ox =<br />
10 11 cm 2 and DD it =10 11 cm 2 eV 1 ,<strong>we</strong>have<br />
DV T ðp-MOSFETÞ ¼ 4:6 10 7 ðDN ox þ DD it E G =2Þt ox<br />
¼ 14:3 mV ð9aÞ<br />
DV T ðn-MOSFETÞ ¼ 4:6 10 7 ðDN ox DD it E G =2Þt ox<br />
¼ 4:3 mV ð9bÞ<br />
assuming that under strong inversion, the Fermi level at the<br />
surface coincides with the valence band in p-MOSFETs<br />
Acceptors<br />
Donors<br />
"0"<br />
"+"<br />
"0"<br />
D it<br />
E C<br />
E i<br />
E F<br />
E V<br />
Acceptors<br />
"0"<br />
"-"<br />
Donors "0"<br />
D it<br />
E C<br />
E F<br />
E i<br />
E V<br />
and with the conduction band in n-MOSFETs, giving<br />
DE E G /2. So the different behavior of p- versus n-MOS-<br />
FETs in this model is due to the opposing sign of the interface<br />
traps.<br />
Another reason for the n- versus p-channel behavior has<br />
to <strong>do</strong> with the surface potential–gate voltage behavior, i.e.,<br />
the gate voltages on n- and p-channel devices are not the<br />
same for a given oxide electric field [5]. Since this has not<br />
been treated in detail, I give the relevant equations. Consider<br />
the band diagrams in Fig. 8, drawn for uniformly<br />
<strong>do</strong>ped substrates without threshold voltage adjust implants<br />
for simplicity. I use the band diagrams to explain the effect<br />
and then use more exact equations for numerical values.<br />
The flatband voltages differ by about one band gap, assuming<br />
a p + poly-Si gate with E F = E V for the p-channel and<br />
E F = E C for the n + gate of the n-channel devices. For<br />
NBTI, the p-channel device is <strong>bias</strong>ed into inversion and<br />
the n-channel device into accumulation, causing the p + gate<br />
to be depleted and the n + gate to be accumulated. Clearly,<br />
the band diagrams for negative NBTI gate <strong>bias</strong> are not<br />
symmetrical, although they are symmetrical at flatband.<br />
With threshold voltage adjust implant, the gate voltage<br />
is given by<br />
V G ¼ V FB þ / s;S þ / s;G þ V ox þ V i<br />
ð10Þ<br />
where V FB is the flatband voltage, / s,S and / s,G the substrate<br />
and gate surface potentials, V ox = Q S /C ox the oxide<br />
voltage, and V i = Q i /C ox (Q i = qN i ) the threshold voltage<br />
adjust implant voltage with N i the implant <strong>do</strong>se.<br />
I will use: N A,D =10 17 cm 3 , N G =5· 10 19 cm 3 , n i =<br />
10 10 cm 3 , t ox = 2 nm, T = 300 K, and E G /q = 1.12 V.<br />
The flatband voltages for the p- and n-channel devices,<br />
assumed to be due only to work function differences, are<br />
V FB;p ¼ E G<br />
2q þ / F;p ¼ E G<br />
2q þ kT <br />
q ln N <br />
D<br />
n i<br />
V FB;n ¼<br />
E G<br />
2q<br />
¼ 0:56 þ 0:42 ¼ 0:98 V<br />
ð11aÞ<br />
/ F;n ¼ E <br />
G kT<br />
2q q ln N <br />
A<br />
n i<br />
¼ 0:56 0:42 ¼ 0:98 V ð11bÞ<br />
E C<br />
V ox<br />
"0"<br />
"-"<br />
"0"<br />
E i<br />
E F<br />
E V<br />
"+"<br />
"0"<br />
E C<br />
E F<br />
E i<br />
V ox V G,p V G,n<br />
φ s,G<br />
φ F,p V =V G FB E C<br />
Fig. 7. Band diagrams of the Si substrate showing the occupancy of<br />
interface traps and the various charge polarities. (a) p-Substrate with<br />
positive interface trap charge at flat band and negative interface trap<br />
charge at inversion. (b) n-Substrate with negative interface trap charge at<br />
flat band and positive interface trap charge at inversion.<br />
E V<br />
V G<br />
=V FB<br />
φ s,S<br />
Fig. 8. Band diagrams for (a) p-channel and (b) n-channel MOSFETs.<br />
The poly-Si gate Fermi level is taken to be E V,G in (a) and E C,G in (b). The<br />
light lines are for V G = V FB and the heavy lines for strong inversion/<br />
accumulation for the same V ox .<br />
φ F,n<br />
E V<br />
E F
D.K. Schroder / Microelectronics Reliability 47 (2007) 841–852 847<br />
Nitrogen (cm -3 )<br />
x<br />
8x10 21<br />
6x10 21<br />
4x10 21<br />
2x10 21<br />
1 10 22 0 0.5 1 1.5 2 2.5 3<br />
t ox =3 nm<br />
NO Annealed<br />
Plasma Nitrided Oxide<br />
ΔI Dsat (%)<br />
10<br />
1<br />
0.1<br />
t ox =6 nm<br />
T=125 o C<br />
V G<br />
=-3.6 V<br />
NO Annealed<br />
Plasma Nitrided Oxide<br />
0<br />
Depth (nm)<br />
0.01<br />
10 0 10 1 10 2 10 3 10 4<br />
Stress Time (s)<br />
Fig. 9. (a) Nitrogen concentration versus depth and (b) drain current change versus stress time for nitrous oxide and plasma nitrided oxides showing the<br />
beneficial effects of plasma nitridation [29].<br />
where / F is the Fermi potential. Assuming for the substrate<br />
E V = E F at the surface for both devices for NBTI negative<br />
gate voltage <strong>bias</strong> gives<br />
/ s;Sp ðinversionÞ ¼ 0:98 V;<br />
/ s;Sn ðaccumulationÞ ¼ 0:14 V ð12Þ<br />
To determine V i , the two threshold voltages need to be considered.<br />
V T is<br />
V T ¼ V FB þ 2/ F þ / s;G þ Q S =C ox þ V i<br />
ð13Þ<br />
p<br />
Substituting numerical values with Q S ¼<br />
ffiffiffiffiffiffiffiffiffiffiffiffiffiffiffiffiffiffiffiffiffiffiffiffiffiffiffi<br />
2qK s e 0 N S 2/ F ¼<br />
0:14 V, / F = ± 0.42 V, and using<br />
V T;p ¼ 0:4 V; V T;n ¼ 0:4 V gives<br />
V T;p ¼ 0:4 ¼ 0:98 0:84 0:14 þ V i )V i ¼ 0:4V ð14aÞ<br />
V T;n ¼ 0:4 ¼ 0:98 þ 0:84 þ 0:14 þ V i ) V i ¼ 0:4V ð14bÞ<br />
assuming the gate surface potential is around zero at<br />
threshold.<br />
For strong inversion<br />
V G;p ¼ V FB þ / s;Sinv þ / s;G þ V ox þ V i<br />
0:98 0:94 0:56 þ V ox 0:4<br />
¼ V ox 0:92 V ð15aÞ<br />
assuming / s,Sinv (2/ F + 0.1) = 0.94 V and for the<br />
depleted gate / s,G E G /2q = 0.56 V. Similarly for<br />
n-channel in accumulation<br />
V G;n ¼ V FB þ / s;Sacc þ / s;G þ V ox þ V i<br />
0:98 0:14 þ V ox þ 0:4 ¼ V ox 0:72 V ð15bÞ<br />
assuming / s,Sacc 0.14 V and / s,G 0. Eqs. (15) show<br />
that for a given oxide voltage or given oxide electric field<br />
the gate voltages on the p- and the n-channel devices differ<br />
by 0.2 V in this fairly realistic example, i.e., the voltage difference<br />
for the same oxide electric field <strong>do</strong>es not differ by<br />
the band gap, as sometimes inferred. Hence, measurements<br />
on p- and n-channel devices should take into account these<br />
considerations for equivalent oxide electric field.<br />
Question: Is the p-channel/n-channel NBTI difference<br />
due to interface trap charge dependence on surface potential,<br />
hydrogen diffusing from the substrate or work function<br />
difference?<br />
7. Nitrogen and fluorine<br />
Nitrogen, water and hydrogen in the oxide degrade<br />
NBTI. Nitrogen is especially important as it is incorporated<br />
into many oxides today and its role in NBTI degradation<br />
is poorly understood. It has been suggested that<br />
nitrogen creates hole traps [28]. Plasma nitridation leads<br />
to reduced NBTI degradation compared to nitrous oxide<br />
illustrated in Fig. 9 [29]. During plasma nitridation the<br />
nitrogen diffuses from the top into the oxide with the nitrogen<br />
concentration ske<strong>we</strong>d more heavily toward the gate/<br />
oxide part of the oxide. Excess nitrogen near the oxide/substrate<br />
interface leads not only to enhanced NBTI degradation<br />
but also to higher fixed oxide charge density [30].<br />
Nitrogen should be located near the gate/oxide interface<br />
rather than the oxide/substrate interface for minimum<br />
NBTI degradation. Fluorine, on the other hand generally<br />
helps. Fluorine atoms release the distortion at the SiO 2 /Si<br />
interface. Interface-state generation for fluorinated oxides<br />
under Fowler–Nordheim stress is suppressed and one<br />
might suspect that this also applies to NBTI [31]. NBTI<br />
has also been observed in high-K dielectrics.<br />
8. Activation energy and time dependence<br />
NBTI depends on <strong>temperature</strong>, oxide electric field, and<br />
time and the threshold voltage shift can be expressed by<br />
DV T ¼ A expðce ox Þ expð E A =kT Þt n ð16Þ<br />
where A is a constant, c the electric field factor, E A the activation<br />
energy and n the time exponent. It is obviously<br />
important to determine the various parameters in this equation<br />
to predict NBTI degradation for any time, <strong>temperature</strong><br />
and oxide electric field. The degradation mechanism of hole<br />
trapping and hydrogen diffusion from the SiO 2 /Si interface<br />
into the oxide is usually described by an activation energy<br />
and a time dependence, shown in Eq. (16). Neutral H 2<br />
diffusion is described with E A 0.2–0.3 eV and the time
848 D.K. Schroder / Microelectronics Reliability 47 (2007) 841–852<br />
exponent n 0.25. Frequently, ho<strong>we</strong>ver, very different values<br />
are measured for these parameters and various explanations<br />
have been forwarded. Recent measurements of<br />
nitrided oxides gave 0.019 eV 6 E A 6 0.24 eV and 0.095 6<br />
n 6 0.158 over the 183–513 K <strong>temperature</strong> range, in contrast<br />
to E A 0.27 eV and n 0.27 for pure SiO 2 [32]. A more<br />
commonly-accepted value for dry SiO 2 is 0.1–0.15 eV. The<br />
value of 0.27 eV is likely due to partial <strong>we</strong>t oxide. Ang and<br />
Wang attribute the non-Arrhenius behavior to the superposition<br />
of two defect generation mechanisms with differing n<br />
and E A : hole trapping with n 0.1 and E A 0.02 eV and<br />
hydrogen diffusion with n 0.25 and E A 0.25 eV [32].<br />
At low <strong>temperature</strong>s the V T shift is determined by hole trapping<br />
at nitrogen defect precursors. At the higher <strong>temperature</strong>s,<br />
classical hydrogen diffusion takes over. They suggest<br />
that previously published reports of <strong>temperature</strong>-dependent<br />
n values in thin SiO 2 [33] may be due to trace amounts of<br />
nitrogen in those oxides. This mechanism may account for<br />
the V T recovery being due to ‘‘oxide charges’’ and not interface<br />
traps, observed by Huard et al. [4]. Why is NBTI oxide<br />
electric field dependent? This implies either a charged oxide<br />
species or the field aids the electrochemical reaction.<br />
The threshold voltage degradation has also been modeled<br />
by the concept of disorder by [34].<br />
<br />
jDV T j ¼ DV T max 1 exp<br />
t<br />
s<br />
b<br />
<br />
ð17Þ<br />
where<br />
<br />
s ¼<br />
N 1=b<br />
i<br />
kT b D DE<br />
0e ox exp<br />
;<br />
kT<br />
D H ¼ D 0 t a ¼ D 0 t ð1 bÞ ð18Þ<br />
where N i is the interstitial site density at the SiO 2 /Si interface,<br />
b the dispersion coefficient, D H the dispersive hydrogen<br />
diffusion coefficient, a the dispersion coefficient, e ox the<br />
oxide electric field, and DE the hydrogen dissociation energy.<br />
For short times, jDV T jDV Tmax (t/s) b .<br />
Huard et al. find n to increase with <strong>temperature</strong> and E A<br />
to vary with stress time [4]. They explain this behavior with<br />
the SiH dispersed dissociation energy having various E A .<br />
Each SiH bond follows its own Arrhenius behavior, but<br />
the multitude of bonds exhibits a non-Arrhenius behavior.<br />
Kaczer et al. use a disorder-controlled kinetics model in<br />
which the disorder due to energy distribution of deep localized<br />
hydrogen states in the SiO 2 leads to a wide distribution<br />
of hydrogen hopping times [35]. This predicts a <strong>temperature</strong>-dependent<br />
n factor. Nitrogen introduces deeper hydrogen<br />
states leading to lo<strong>we</strong>r n. The n exponent appears to<br />
depend on the measurement conditions. When there is a<br />
delay bet<strong>we</strong>en NBTI stress and its characterization,<br />
n 0.25. Ho<strong>we</strong>ver, when the delay is zero, n decreases to<br />
0.15.<br />
Krishnan et al. show the n exponent for interface trap<br />
generation to be 0.16 under the assumption that neutral<br />
H 2 diffuses from the SiO 2 /Si interface into the oxide and<br />
diffusion, not interfacial reaction, is the rate-limiting process<br />
[36]. Their data are shown in Fig. 10(a). They posit<br />
that the n = 0.25 value frequently quoted, is due to the time<br />
delay bet<strong>we</strong>en stress and measurement. In their measurements,<br />
they obtain n = 0.3 with 1 s delay bet<strong>we</strong>en stress<br />
and N it measurement. Varghese et al. show n = 0.14 for<br />
‘‘no delay’’ measurements and n > 0.14 when there is a<br />
delay bet<strong>we</strong>en stress and measurement, shown in<br />
Fig. 10(b) [37].<br />
NBTI shows a tendency to saturate for long stress<br />
times, as shown in Fig. 4. This has been attributed to various<br />
causes. A recent paper by Alam and Kufluoglu lists<br />
four possible causes [38]. One suggests that a change of<br />
hydrogen diffusion from H to H 2 diffusion changes n from<br />
0.25 to 0.16 leading to quasi-saturation of the DV T vs. t<br />
characteristics. Another cause may be H 2 pile up at the<br />
gate/oxide interface if hydrogen diffuses slo<strong>we</strong>r in the<br />
poly-Si gate than in the oxide, leading to hydrogen back<br />
diffusion and subsequent D it passivation. On the other<br />
hand, if hydrogen diffuses faster in the poly-Si gate, then<br />
hydrogen ‘‘disappears’’ from the oxide and saturation<br />
occurs when all SiH bonds are broken. The dispersion of<br />
the bond-breaking dissociation energies leads to low E A<br />
bonds breaking first making it progressively more difficult<br />
for stronger bonds to dissociate. Finally, saturation may<br />
be a measurement artifact. Delays bet<strong>we</strong>en stress and<br />
NBTI damage measurement lead to repassivation of interface<br />
traps. In the model in which NBTI is due to hydrogen<br />
10 12 10 2 10 3 10 4<br />
t ox =7 nm<br />
40<br />
30<br />
T=50 o C<br />
V G =-3 V<br />
No delay<br />
n =0.138<br />
ΔN it<br />
(cm -2 )<br />
10 11<br />
No delay<br />
n=0.19<br />
1 s delay<br />
n=0.3<br />
ΔV T (mV)<br />
20<br />
10<br />
50 ms delay<br />
n =0.189<br />
10 10<br />
Stress Time (s)<br />
7 89<br />
6<br />
10 0 10 1 10 2 10 3<br />
Stress Time (s)<br />
Fig. 10. (a) DN it 36 and (b) DV T 37 versus stress time with and without stress/measurement delay.
D.K. Schroder / Microelectronics Reliability 47 (2007) 841–852 849<br />
diffusion from the substrate, is it possible for the P–H<br />
bonds to deplete thereby leading to saturation?<br />
Question: <strong>What</strong> is the true time dependence? Is it<br />
n 0.16? <strong>What</strong> is the activation energy? Is the disordercontrolled<br />
diffusion mechanism correct? Which mechanism(s)<br />
is (are) responsible for the quasi-saturation?<br />
9. Wafer orientation<br />
Most ICs are fabricated on (100) oriented Si wafers.<br />
Ho<strong>we</strong>ver, it has been known since 1968 that hole mobility<br />
is higher for p-MOSFETs on (110) oriented wafers with<br />
the channel in the h110i direction [39,40]. Along with the<br />
higher hole mobility, ho<strong>we</strong>ver, is a higher interface trap<br />
density. D it has been reported as D it (100) = 7.7 · 10 10<br />
and D it (110) = 1.4 · 10 11 cm 2 eV 1 [41]. Hence one<br />
would expect more severe NBTI degradation on (110) oriented<br />
wafers, as indeed has been observed, as shown in<br />
Fig. 11 [42,43]. This is a potential problem if (110) oriented<br />
wafers become important. For certain three-dimensional<br />
devices, e.g., FinFETs, when fabricated on (100) wafers<br />
with the channel in the conventional h110i direction, the<br />
vertical sidewalls are (110) oriented, leading to NBTI<br />
problems [42]. Ho<strong>we</strong>ver, forming FinFETs on (100) wafers<br />
with the channel in the h100i direction, leads to (100) vertical<br />
sidewalls, illustrated in Fig. 12. Three-dimensional<br />
structures lead to various difficulties, e.g., gate length critical<br />
dimension control and the nature of three-dimensional<br />
100<br />
structures. It is possible, ho<strong>we</strong>ver, to form planar (100)<br />
and (110) oriented surfaces on one wafer using SOI layer<br />
transfer technology [44].<br />
10. Measurements<br />
Traditionally NBTI has been characterized by stressing<br />
a device, then interrupting the stress to measure a device<br />
parameter, e.g., V T , I D , l eff , D it , N ot , stress again, measure,<br />
etc. V T , I D ,andl eff are determined from I D –V D and I D –V G<br />
measurements. The interface trap density D it is usually<br />
measured with charge pumping [45] or log(I D )–V G subthreshold<br />
swing measurements. Usually source, drain and<br />
substrate are grounded during the stress period. The<br />
‘‘dead’’ time bet<strong>we</strong>en ‘‘stress’’ and ‘‘measure’’ varied from<br />
researcher to researcher and was frequently not given in<br />
publications. When it was discovered that that time was<br />
quite important, techniques <strong>we</strong>re developed to minimize<br />
and eliminate the ‘‘dead’’ time. Rangan et al. use<br />
V D = 50 mV and monitor the drain current during stress<br />
and recovery [22]. Drain current depends on effective<br />
mobility and threshold voltage and in this method neither<br />
is measured explicitly, but the drain current degradation<br />
is determined.<br />
Huard et al. in their ‘‘on the fly’’ method, apply a low<br />
drain voltage pulse of 50 mV and record the drain current<br />
at the end of the stress period, without interrupting the<br />
stress, illustrated in Fig. 13(a) [4]. This was repeated and<br />
in this way drain current degradation was recorded with<br />
no ‘‘dead’’ time. Since the current depends on threshold<br />
voltage, mobility and other device parameters, it is not<br />
(110)<br />
ΔV T (mV)<br />
10<br />
(100)<br />
V G<br />
V Gstress<br />
V G<br />
V Gstress<br />
T=125 o C<br />
ε<br />
ox =-7.6 MV/cm<br />
1<br />
10 0 10 1 10 2 10 3 10 4 10 5 10 6<br />
Stress Time (s)<br />
Fig. 11. DV T versus stress time for SiON (2%) with (110) and (100)<br />
orientation. Points: experiment, lines: Eq. (17) with s = 1.3 · 10 4 s, b =<br />
0.3, DV Tmax (110) = 91 mV and DV Tmax (100) = 53 mV [43].<br />
V D<br />
V Dmeas<br />
Stress Time<br />
V D<br />
V Dmeas<br />
ΔV G<br />
Stress Time<br />
Fig. 13. Measurement schematics for (a) drain current and (b) drain<br />
current and transconductance without interrupting stress.<br />
Fig. 12. Top view of (100) oriented Si wafer with FinFET-like transistors with channels in the h110i and h100i directions.
850 D.K. Schroder / Microelectronics Reliability 47 (2007) 841–852<br />
possible to extract DV T . In a modification of this method,<br />
shown in Fig. 13(b), small gate voltage pulses are superimposed<br />
on the dc gate stress voltage. The drain current is<br />
also pulsed and the drain current is measured at three different<br />
gate voltages, allowing the transconductance to be<br />
determined.<br />
In yet another method, the I D –V G characteristic of an<br />
unstressed device is measured. Then the gate voltage is lo<strong>we</strong>red<br />
briefly from its stress value to a voltage near V T and<br />
the drain current is measured [35]. The gate voltage shift<br />
of the stressed drain current is converted to DV T .<br />
From the linear drain current a number of parameters<br />
can be derived. The linear drain currents I Dlin for p-MOS-<br />
FETs in the mobility-<strong>do</strong>minated and velocity saturationlimited<br />
regimes are [46]<br />
I Dlin kl eff ðV GS V T ÞV DS ;<br />
kl<br />
I Dlin <br />
eff<br />
1 þ l eff V DS =v sat L ðV GS V T ÞV DS ; ð19Þ<br />
l eff ¼<br />
l 0<br />
1 þ hðV GS V T Þ ; k ¼ WC ox<br />
L<br />
where l 0 is the low-field mobility, h the mobility degradation<br />
factor, and v sat the saturation velocity. All voltages<br />
are negative for p-channel MOSFETs and given as absolute<br />
values in Eq. (19). If the change in drain current is<br />
compared to the unstressed, I Dlin0 , the change in I Dlin is [47]<br />
DI Dlin<br />
I Dlin0<br />
¼<br />
DV T<br />
V GS V T0<br />
) DV T ¼ ðV GS V T0 Þ DI Dlin<br />
I Dlin0<br />
ð20Þ<br />
where V T0 is the unstressed threshold voltage and any<br />
change in mobility in deriving Eq. (19) is neglected. This,<br />
of course, is an approximation since <strong>we</strong> know that interface<br />
traps generated during NBTI stress degrade the mobility by<br />
introducing scattering centers. Ho<strong>we</strong>ver, the mobility<br />
dependence on gate voltage decreases at higher gate<br />
voltages.<br />
The mobility dependence can be eliminated by measuring<br />
the transconductance in Fig. 13(b) according to<br />
kl<br />
g m <br />
0 V DS<br />
½1 þ hðV GS V T ÞŠ ; 2<br />
kl<br />
g m 0 V DS ð1 þ l 0 V DS =v sat LÞ<br />
ð21Þ<br />
½1 þ hðV GS V T Þþl 0 V DS =v sat LŠ 2<br />
and<br />
I Dlin<br />
p<br />
pffiffiffiffiffi<br />
¼ ffiffiffiffiffiffiffiffiffiffiffiffiffiffiffi<br />
kl<br />
g 0 V DS ðV GS V T Þ;<br />
m<br />
pffiffiffiffiffiffiffiffiffiffiffiffiffiffiffi<br />
I Dlin kl<br />
pffiffiffiffiffi<br />
¼ 0 V DS ðV GS V T Þ<br />
pffiffiffiffiffiffiffiffiffiffiffiffiffiffiffiffiffiffiffiffiffiffiffiffiffiffiffiffiffiffiffiffi<br />
1 þ l 0 V DS =v sat L<br />
g m<br />
ð22Þ<br />
Eq. (19) neglects the source/drain parasitic resistance.<br />
Including it adds another term, but <strong>do</strong>es not alter Eq.<br />
(22) [48]. The mobility degradation factor h has been eliminated<br />
in Eq. (22), but it still contains the low field mobility.<br />
The determination of l 0 is discussed in detail by Huard<br />
et al. [4].<br />
Question: How much time can be allo<strong>we</strong>d bet<strong>we</strong>en stress<br />
and measurement? Must it be zero?<br />
11. Effect on circuits<br />
The drain or on current is important in analog and digital<br />
circuits. In digital circuits, with MOSFETs being<br />
switches, charging and discharging capacitors, higher drain<br />
current leads to faster capacitor charging and higher frequency<br />
operation. The delay time is<br />
t d ¼ CjV DDj<br />
I D<br />
¼<br />
2LC<br />
W l eff C ox ðV DD V T Þ 2 ð23Þ<br />
where C is the capacitance and V DD the supply voltage.<br />
NBTI stress leads to l eff reduction and V T increase, both<br />
giving delay time increases – clearly undesirable. In analog<br />
circuits the drain current is also important. An interesting<br />
effect that occurs due to NBTI degradation is an increased<br />
gate-to-drain overlap capacitance increase due to generated<br />
interface traps. Such increased C GD degrades analog circuits<br />
due to the Miller effect. For digital circuits V T and<br />
C GD degradation contribute about equally to circuit degradation<br />
while for analog circuits, C GD is the major circuit<br />
degrader, e.g., frequency response of operational amplifiers.<br />
The fractional change of drain current due to threshold<br />
voltage change is<br />
I D W l effC ox<br />
ðV G V T ÞV D ) 1 dI D DV T<br />
¼<br />
L<br />
I D dV T V G V T<br />
ð24Þ<br />
for MOSFETs in the linear region, and<br />
I Dsat W l effC ox<br />
ðV G V T Þ 2 ) 1 dI D<br />
¼<br />
2L<br />
I D dV T<br />
2DV T<br />
V G V T<br />
ð25Þ<br />
for the saturation region, showing twice the degradation in<br />
saturation, as observed experimentally [47]. With scaling,<br />
device dimensions and voltages shrink. Ho<strong>we</strong>ver, the gate<br />
voltage typically shrinks more than V T , hence the headroom<br />
(V G –V T ) is smaller for shorter channel devices resulting<br />
in more degradation. For example, with V G = 1.5 V,<br />
V T = 0.4 V and DV T = 0.05 V, the fractional drain<br />
current degradation from Eqs. (24) and (25) becomes<br />
4.5% and 9%, respectively. The fractional change due to<br />
mobility change is<br />
1 dI D<br />
¼ Dl eff<br />
ð26Þ<br />
I D dl eff l eff<br />
The mobility degrades due to interface trap generation,<br />
since l eff depends inversely on D it .<br />
The one parameter that appears to be positively influenced<br />
by NBTI is the off current, i.e., the drain current<br />
for V G = 0. The off current for p-MOSFETs is given by
I off ¼ I T exp<br />
qV <br />
T<br />
; n ¼ 1 þ C b þ C it<br />
¼ 1 þ K p ffiffiffiffiffiffiffi N D<br />
nkT<br />
C ox<br />
C ox<br />
þ qDit<br />
ð27Þ<br />
where to first order I T and K are constants. As V T becomes<br />
more negative, I off decreases. Ho<strong>we</strong>ver, D it increases resulting<br />
in higher n and reduced slope of the log(I D )–V G characteristics.<br />
This leads to a slight I off increase, but the V T<br />
change generally <strong>do</strong>minates. The n-factor also becomes less<br />
important as the oxide capacitance increases for thinner<br />
oxides.<br />
For SRAM cells the static noise margin (SNM), which is<br />
a measure of the read stability of the 6-T SRAM cell, is<br />
degraded. A simple solution to recover the SNM uses a<br />
data flipping technique [49]. Knowing the threshold voltage<br />
degradation of a single transistor due to NBTI, one can<br />
predict the performance degradation of a digital circuit<br />
with a reasonable degree of accuracy.<br />
Digital circuits are less sensitive (approximately 9.2%<br />
performance degradation in ten years for 70 nm technology)<br />
to NBTI degradation than previously anticipated [50].<br />
Question: How severe a problem is NBTI for digital and<br />
analog circuits? Which circuits are most severely affected?<br />
How much threshold voltage shift can a circuit tolerate?<br />
12. Conclusions<br />
A brief review of NBTI is follo<strong>we</strong>d by a summary of<br />
recent publications elucidating various NBTI mechanisms.<br />
I have tried to highlight those aspects of NBTI that are still<br />
not fully understood – at least not by me. I have used the<br />
most relevant equations to bring out particular points. At<br />
the end of most sections I have posed some questions that<br />
I believe are still unans<strong>we</strong>red. Although NBTI is much better<br />
understood today than a few years ago, the very mechanism<br />
causing NBTI is not completely understood. For<br />
example, I <strong>do</strong> not believe that <strong>we</strong> really know what causes<br />
the positive oxide charge, although there is little <strong>do</strong>ubt<br />
about what causes interface trap changes. There is a fair<br />
amount of discrepancy on the time dependence of NBTI<br />
degradation; is it n = 0.15 or 0.25? While that may appear<br />
marginally important, it becomes very important in predicting<br />
long-term NBTI degradation. The reported activation<br />
energy also covers a wide range. <strong>What</strong> exactly <strong>do</strong>es<br />
nitrogen in nitrided oxides <strong>do</strong>? It appears that the amount<br />
and location of nitrogen are important. The further the<br />
nitrogen is from the oxide/substrate interface, the less is<br />
the NBTI degradation. Most NBTI measurements are<br />
made at elevated <strong>temperature</strong>s and some high-performance<br />
ICs operate at or near those <strong>temperature</strong>s. Ho<strong>we</strong>ver, many<br />
ICs operate at lo<strong>we</strong>r <strong>temperature</strong>. Is the degradation mechanism<br />
the same at various <strong>temperature</strong>s? This, of course, is<br />
always a problem when devices are stressed during reliability<br />
measurements. The stress (electromigration, gate oxide<br />
integrity, hot carriers) is usually carried out at higher current,<br />
voltage, <strong>temperature</strong> and the degradation is extrapolated<br />
to normal operating conditions to very long times,<br />
D.K. Schroder / Microelectronics Reliability 47 (2007) 841–852 851<br />
e.g., 10 years. This relies on the degradation mechanisms<br />
during stress and operation being the same. Several important<br />
NBTI degradation questions remain unans<strong>we</strong>red.<br />
Ho<strong>we</strong>ver, I am confident that the world-wide attention it<br />
has garnered will lead to a better <strong>understand</strong>ing. Also, very<br />
little has been published on NBTI reduction/elimination,<br />
perhaps because much of this is proprietary information.<br />
Acknowledgements<br />
I thank the revie<strong>we</strong>rs for constructive and thoughtful<br />
comments and suggestions, many of which <strong>we</strong>re incorporated<br />
into the paper.<br />
References<br />
[1] Miura Y, Matukura Y. Investigation of silicon–silicon dioxide<br />
interface using MOS structure. Jpn J Appl Phys 1966;5:180;<br />
Goetzberger A, Nigh HE. Surface charge after annealing of Al–SiO 2 –<br />
Si structures under <strong>bias</strong>. Proc IEEE 1966;54:1454.<br />
[2] Schroder DK, Babcock JA. <strong>Negative</strong> <strong>bias</strong> <strong>temperature</strong> <strong>instability</strong>: a<br />
road to cross in deep submicron silicon semiconductor manufacturing.<br />
J Appl Phys 2003;94:1–18.<br />
[3] Stathis JH, Zafar S. The negative <strong>bias</strong> <strong>temperature</strong> <strong>instability</strong> in MOS<br />
devices: a review. Microelectron Rel 2006;46:270–86.<br />
[4] Huard V, Denais M, Parthasarathy C. NBTI degradation: from<br />
physical mechanisms to modeling. Microelectron Rel 2006;46:1–23.<br />
[5] Alam MA, Mahapatra S. A comprehensive model of PMOS NBTI<br />
degradation. Microelectron Rel 2005;45:71–81.<br />
[6] Jeppson KO, Svensson CM. <strong>Negative</strong> <strong>bias</strong> stress of MOS devices at<br />
high electric fields and degradation of MNOS devices. J Appl Phys<br />
1977;48:2004–14.<br />
[7] Ogawa S, Shiono N. Generalized diffusion–reaction model for the<br />
low-field charge build up <strong>instability</strong> at the Si–SiO 2 interface. Phys Rev<br />
1995;51:4218–30.<br />
[8] Yang JB, Chen TP, Tan SS, Chan L. Analytical reaction–diffusion<br />
model and the modeling of nitrogen-enhanced negative <strong>bias</strong> <strong>temperature</strong><br />
<strong>instability</strong>. Appl Phys Lett 2006;88:172109-1–9-3.<br />
[9] Poindexter EH, Caplan PJ. Characterization of Si/SiO 2 interface<br />
defects by electron spin resonance. Progr Surf Sci 1983;14:201–94.<br />
[10] Reed ML, Plummer JD. Chemistry of Si–SiO 2 interface trap<br />
annealing. J Appl Phys 1988;63:5776–93.<br />
[11] Stirling A, Pasquarello A, Charlier JC, Car R. Dangling bond defects<br />
at SiO 2 /Si interfaces: atomic structure of the P b1 center. Phys Rev<br />
Lett 2000;85:2773–6.<br />
[12] Stesmans A, Afanasév VV. Nature of the P b1 defect in (100)Si/SiO 2<br />
as revealed by electron spin resonance 29 Si hyperfine structure.<br />
Microelectron Eng 1999;48:113–6.<br />
[13] Stesmans A, Afanasév VV. Electrical activity of interfacial paramagnetic<br />
defects in thermal (100)Si/SiO 2 . Phys Rev 1998;57:10030–4.<br />
[14] Lenahan P, IEEE Rel. Phys. Tutorial Notes, Adv. Rel. Topics, IEEE<br />
IRPS, 2002; section 223.<br />
[15] Mishima TD, Lenahan PM, Weber W. Do P b1 centers have levels in<br />
the Si band gap? Spin-dependent recombination study of the P b1<br />
‘‘hyperfine spectrum’’. Appl Phys Lett 2000;76:3771–3;<br />
Campbell JC, Lenahan PM. Density of states of P b1 Si/SiO 2 interface<br />
trap centers. Appl Phys Lett 2002;80:1945–7.<br />
[16] Gray PV, Brown DM. Density of SiO 2 –Si interface states. Appl Phys<br />
Lett 1966;8:31–3;<br />
Fleetwood DM. Long-term annealing study of midgap interface-trap<br />
charge neutrality. Appl Phys Lett 1992;60:2883–5.<br />
[17] Reddy V, Krishnan AT, Marshall A, Rodriguez J, Natarajan S, Rost<br />
Y, et al. Impact of negative <strong>bias</strong> <strong>temperature</strong> <strong>instability</strong> on digital<br />
circuit reliability. IEEE Ann Int Rel Symp 2002;40:248–54.
852 D.K. Schroder / Microelectronics Reliability 47 (2007) 841–852<br />
[18] Saminadayar K, Pfister JC. Evolution of surface-states density of<br />
Si/<strong>we</strong>t thermal SiO 2 interface during <strong>bias</strong>-<strong>temperature</strong> treatment.<br />
Solid-State Electron 1977;20:891–6.<br />
[19] Jayaraman R, Sodini CG. A 1/f noise technique to extract the oxidetrap<br />
density near the conduction band edge of silicon. IEEE Trans<br />
Electron Dev 1989;36:1773–82.<br />
[20] Mitani Y, Nagamine M, Satake H, Toriumi A. NBTI mechanism in<br />
ultra-thin gate dielectric-nitrogen-originated mechanism in SiON.<br />
IEEE Int Electron Dev Meet 2002:509–12.<br />
[21] Ershov M, Saxena S, Karbasi H, Winters S, Minehane S, Babcock J,<br />
et al. Dynamic recovery of negative <strong>bias</strong> <strong>temperature</strong> <strong>instability</strong> in<br />
p-type metal–oxide–semiconductor field-effect transistors. Appl Phys<br />
Lett 2003;83:1647–9.<br />
[22] Rangan S, Mielke N, Yeh ECC. Universal recovery behavior of<br />
negative <strong>bias</strong> <strong>temperature</strong> <strong>instability</strong>. IEEE Int Electron Dev Meet<br />
2003:341–4.<br />
[23] Yang T, Shen C, Li MF, Ang CH, Zhu CX, Yeo YC, et al. Interface<br />
trap passivation effect in NBTI measurement for p-MOSFET with<br />
SiON gate dielectric. IEEE Electron Dev Lett 2006;26:758–60.<br />
[24] Tsujikawa S, Watanabe K, Tsuchiya R, Ohnishi K, Yugami J.<br />
Experimental evidence for the generation of bulk traps by negative<br />
<strong>bias</strong> <strong>temperature</strong> stress and their impact on the integrity of directtunneling<br />
gate dielectrics. IEEE VLSI Technol 2003:139–40.<br />
[25] Ang DS. Observation of suppressed interface state relaxation under<br />
positive gate <strong>bias</strong>ing of the ultrathin oxynitride gate p-MOSFET<br />
subjected to negative-<strong>bias</strong> <strong>temperature</strong> stressing. IEEE Electron Dev<br />
Lett 2006;27:412–5.<br />
[26] Tsetseris L, Zhou XJ, Fleetwood DM, Schrimpf RD, Pantelides ST.<br />
Physical mechanism of negative-<strong>bias</strong> <strong>temperature</strong> <strong>instability</strong>. Appl<br />
Phys Lett 2005;86:142103-1–3-3.<br />
[27] Sinha AK, Smith TE. Kinetics of the slow-trapping <strong>instability</strong> at the<br />
Si/SiO 2 interface. J Electrochem Soc 1978;125:743–6.<br />
[28] Kushida-Abdelghafar K, Watanabe K, Ushio J, Murakami E. Effect<br />
of nitrogen at SiO 2 /Si interface on reliability issues – negative-<strong>bias</strong><strong>temperature</strong><br />
<strong>instability</strong> and Fowler–Nordheim-stress degradation.<br />
Appl Phys Lett 2002;81:4362–4.<br />
[29] Tavel B, Bidaud M, Emonet N, Barge D, Planes N, Brut H, et al.<br />
Thin oxynitride solution for digital and mixed-signal 65 nm CMOS<br />
platform. IEEE Int Electron Dev Meet 2003:643–6.<br />
[30] Ishimaru K, Takayangi M, Watanabe T. Scaled CMOS with SiON<br />
and high k. In: Huff H, Iwai H, Richter H, editors. Silicon materials<br />
science and technology. Pennington, NJ: Electrochem. Soc.; 2006. p.<br />
317–27.<br />
[31] Mitani Y, Satake H, Nakasaki Y, Toriumi A. Improvement of<br />
charge-to-break<strong>do</strong>wn distribution by fluorine incorporation into thin<br />
gate oxides. IEEE Trans Electron Dev 2003;50:2221–6.<br />
[32] Ang DS, Wang S. On the non-Arrhenius behavior of negative-<strong>bias</strong><br />
<strong>temperature</strong> <strong>instability</strong>. Appl Phys Lett 2006;88:093506-1–6-3.<br />
[33] Kaczer B, Arkhipov V, Jurczak M, Groeseneken G. <strong>Negative</strong> <strong>bias</strong><br />
<strong>temperature</strong> <strong>instability</strong> (NBTI) in SiO 2 and SiON gate dielectrics<br />
understood through disorder-controlled kinetics. Microelectron Eng<br />
2005;80:122–5.<br />
[34] Zafar S, Lee BH, Stathis J, Callegari A, Ning T. A model for negative<br />
<strong>bias</strong> <strong>temperature</strong> <strong>instability</strong> (NBTI) in oxide and high K pFETs. IEEE<br />
VLSI Technol 2004:208–9.<br />
[35] Kaczer B, Arkhipov V, Degraeve R, Collard N, Groeseneken G,<br />
Goodwin M. Disorder-controlled-kinetics model for negative <strong>bias</strong><br />
<strong>temperature</strong> <strong>instability</strong> and its experimental verification. IEEE Ann<br />
Int Rel Symp 2005;43:381–7.<br />
[36] Krishnan AT, Chakravarthi S, Nicollian P, Reddy V, Krishnan S.<br />
<strong>Negative</strong> <strong>bias</strong> <strong>temperature</strong> <strong>instability</strong> mechanism: the role of molecular<br />
hydrogen. Appl Phys Lett 2006;88:153518-1–8-3.<br />
[37] Varghese D, Saha D, Mahapatra S, Ahmed K, Nouri F, Alam A. On<br />
the dispersive versus Arrhenius <strong>temperature</strong> activation of NBTI time<br />
evolution in plasma nitrided gate oxides: measurements, theory, and<br />
implications. IEEE Int Electron Dev Meet 2005:684–7.<br />
[38] Alam M, Kufluoglu H. On quasi-saturation of negative <strong>bias</strong><br />
<strong>temperature</strong> degradation. In: Massoud HZ, Stathis JH, Hattori T,<br />
Misra D, Baumvol I, editors. Physics and chemistry of SiO 2 and the<br />
Si–SiO 2 interface – 5. Pennington, NJ: Electrochem. Soc.; 2005. p.<br />
139–46.<br />
[39] Colman D, Bate RT, Mize JP. Mobility anisotropy and piezoresistance<br />
in silicon p-type inversion layers. J Appl Phys 1968;39:1923–<br />
31.<br />
[40] Sato T, Takeishi Y, Hara H. Effect of crystallographic orientation on<br />
mobility, surface state density, and noise in p-type inversion layers on<br />
oxidized silicon surfaces. Jpn J Appl Phys 1969;8:588–98.<br />
[41] Sze SM, editor. VLSI Technology. 2nd ed. NY: McGraw-Hill; 1988.<br />
p. 110.<br />
[42] Maeda S, Choi JA, Yang JH, Jin YS, Bae SK, Kim YW, et al.<br />
<strong>Negative</strong> <strong>bias</strong> <strong>temperature</strong> <strong>instability</strong> in triple gate transistors. IEEE<br />
Int Reliab Phys Symp 2004;42:8–12.<br />
[43] Zafar S, Yang M, Gusev E, Callegari A, Stathis J, Ning T, et al. A<br />
comparative study of NBTI as a function of Si substrate orientation<br />
and gate dielectrics (SiON) and SiON/HfO 2 . IEEE VLSI Technol<br />
2005:128–9.<br />
[44] Yang M, Chan VWC, Chan KK, Shi L, Fried DM, Stathis JH, et al.<br />
Hybrid-orientation technology (HOT): opportunities and challenges.<br />
IEEE Trans Electron Dev 2006;53:965–78.<br />
[45] Schlünder C, Brederlow R, Wieczorek P, Dahl C, Holz J, Röhner M,<br />
et al. Trapping mechanisms in negative <strong>bias</strong> <strong>temperature</strong> stressed p-<br />
MOSFETs. Microelectron Rel 1999;39:821–6.<br />
[46] Taur Y, Ning TH. Fundamentals of Modern VLSI Devices. Cambridge<br />
University Press; 1998. p. 150–1.<br />
[47] Krishnan AT, Reddy V, Chakravarthi S, Rodriguez J, John S,<br />
Krishnan S. NBTI impact on transistor and circuit: models, mechanisms,<br />
and scaling effects. IEEE Int Electron Dev Meet 2003:349–52.<br />
[48] Ghibau<strong>do</strong> G. New method for the extraction of MOSFET parameters.<br />
Electron Lett 1988;24:543–5.<br />
[49] .<br />
[50] Paul BC, Kang K, Kufluoglu H, Alam MA, Roy K. Impact of NBTI<br />
on the temporal performance degradation of digital circuits. IEEE<br />
Electron Dev Lett 2005;26:560–2.