2001 THE NATIONAL CLIMATIC DATA CENTER
2001 THE NATIONAL CLIMATIC DATA CENTER
2001 THE NATIONAL CLIMATIC DATA CENTER

Create successful ePaper yourself
Turn your PDF publications into a flip-book with our unique Google optimized e-Paper software.
<strong>2001</strong><br />
<strong>THE</strong> <strong>NATIONAL</strong><br />
<strong>CLIMATIC</strong> <strong>DATA</strong> <strong>CENTER</strong>
1951-1995<br />
Post 1995<br />
Department of Commerce<br />
Donald L. Evans, Secretary<br />
National Oceanic and Atmospheric Administration<br />
Vice Admiral Conrad C. Lautenbacher, Jr., USN (Ret.),<br />
Under Secretary for Oceans and Atmosphere and NOAA Administrator<br />
National Environmental Satellite, Data, and Information Service<br />
Gregory W. Withee, Assistant Administrator<br />
National Climatic Data Center<br />
Thomas R. Karl, Director
<strong>THE</strong> HISTORY AND DIRECTORS OF NCDC<br />
Modern climatology owes much to Thomas Jefferson, who<br />
recognized a need for systematically recording the climate of the<br />
United States. In view of his prominence and lifelong enthusiasm<br />
for climatology, it is difficult to understand why nearly a full<br />
century elapsed between publication of his first climatological<br />
notes and the emergence of a firm framework to survey this<br />
vital natural resource. There was no organized system of taking<br />
weather observations until the 19th century, when successive<br />
advances were made by agencies of the Federal government.<br />
The United States Weather Bureau, created in 1870 under the<br />
United States Signal Service (later Signal Corps) was made a<br />
civilian agency and transferred to the Department of Agriculture<br />
in 1891. The Act of Congress effecting this change charged the<br />
Weather Bureau, among other duties, with “... the taking of such<br />
meteorological observations as may be necessary to establish and<br />
record the climatic conditions of the United States...”<br />
By 1952, the move from New Orleans was completed. Through<br />
an understanding with the National Archives, NWRC was the<br />
collection center and custodian for all weather (climatological)<br />
records of the United States. The World Data Center (WDC)<br />
system for international exchange of scientific data related to<br />
the physical environment of the earth was established to ensure<br />
the permanent availability of the worldwide observations taken<br />
during the International Geophysical Year, 1957-58. The<br />
WDC-A for Meteorology was collocated at the NWRC to assist<br />
scientists who need unique data not available from the regular<br />
sources covered by intergovernmental arrangements under the<br />
auspices of the World Meteorological Organization (WMO).<br />
The new civilian Weather Bureau inherited an operating<br />
Climatological Service. Government operated stations numbered<br />
about 180 but the bulk of data used to establish the climate came<br />
from public-minded citizens who volunteered to record temperature<br />
extremes and daily amounts of precipitation. There were more<br />
than 2000 of these cooperative stations at the time. These surface<br />
observations from land stations grew in number, as did the collection<br />
of ocean and upper air observations. By the late 1920’s data holdings<br />
in Weather Bureau files had reached staggering proportions. The<br />
New Orleans (LA) Tabulation Unit was established during the<br />
early stages of World War II with the primary responsibility of<br />
conducting climatological investigations as requested by the Armed<br />
Forces. The Federal Records Act of 1950 established the National<br />
Weather Records Center (NWRC ) as the official depository of all<br />
United States weather records. In July 1951, approval was granted to<br />
form the center in Asheville, NC.<br />
The Weather Bureau’s regional processing units were consolidated<br />
at the NWRC during late 1962 and early 1963 as a measure to<br />
increase the economy, efficiency, and effectiveness of the overall<br />
program. In June 1970, the facility’s name was changed from the<br />
NWRC, to the National Climatic Center to more truly reflect its<br />
functions as the world’s largest center for climatic data. In October<br />
1970, the National Oceanic and Atmospheric Administration<br />
(NOAA) was formed. Two years later, the Center began archiving<br />
and servicing data from environmental satellites. The National<br />
Climate Program Act of 1978 established a Climate Service System<br />
with a renewed emphasis on local, state, regional and national<br />
aspects. A name change in 1984 brought forth NCDC, the<br />
National Climatic Data Center.<br />
NCDC <strong>2001</strong> Report 1
A MESSAGE FROM <strong>THE</strong> DIRECTOR .....4<br />
NCDC MANAGEMENT AND STAFF ......5<br />
CLIMATE SERVICES..................................6<br />
NCDC is responsible for providing user access to climate data<br />
and information resources.<br />
CLIMATE <strong>DATA</strong> MANAGEMENT ...........9<br />
Contents<br />
<strong>2001</strong> MISSION ACCOMPLISHMENTS<br />
NCDC is responsible for retrieving, quality controlling, and<br />
assembling climate data and information resources and their<br />
metadata. NCDC is also responsible for the operation, development,<br />
and maintenance of the Center’s data archival infrastructure,<br />
including operations relating to adherence to the National<br />
Archives and Records Administration guidelines.<br />
CLIMATE MONITORING ......................14<br />
NCDC’s climate monitoring responsibilities include scientific<br />
analysis of climate data, monitoring of climate networks, and<br />
climate product development.<br />
<strong>NATIONAL</strong> AND INTER<strong>NATIONAL</strong><br />
COLLABORATIONS AND<br />
PARTNERSHIPS .......................................18<br />
In collaboration with other national and international partners,<br />
NCDC takes a leadership role in efforts to improve<br />
climate system monitoring and climate data management and<br />
participates in the preparation of national and global climate<br />
assessments.<br />
NEW PRODUCTS....................................22<br />
NCDC responds to the ever evolving needs of the users of<br />
climate data and information by constantly expanding the use of<br />
Internet technology, enhancing climate analyses and monitoring<br />
reports, and improving the availability of data and information<br />
through media such as CD-ROM’s and digital Technical Reports.<br />
BIBLIOGRAPHY.......................................24<br />
NCDC’s strong presence in the climate science community<br />
is reflected in the professional scientific journal article and<br />
presentations published in conference proceedings during in <strong>2001</strong>.<br />
OUTREACH .............................................27<br />
NCDC has developed a vigorous outreach program in the<br />
local community and across the Nation to inform our<br />
users of the rich and varied history of climatology and<br />
meteorology as well as the mission of NCDC.<br />
<strong>THE</strong> EMPLOYEES OF NCDC.................28<br />
<strong>2001</strong> TROPICAL CYCLONES OF <strong>THE</strong><br />
WORLD.......................................(TEAR-OUT)<br />
ACRONYMS..............................................29<br />
CONTACTS ..............................................29<br />
CREDITS...................................................29<br />
2 NCDC <strong>2001</strong> Report
Contents<br />
FEATURES<br />
<strong>THE</strong> HISTORY AND DIRECTORS<br />
OF NCDC ...................................................1<br />
No organized system of<br />
taking and collecting<br />
weather observations<br />
existed in the United States<br />
until the 19th Century.<br />
Congress acted in 1891<br />
with a charge to archive<br />
and distribute “...such<br />
meteorological observations<br />
as may be necessary to establish and record the climatic<br />
conditions.” Nearly 60 years later, The Federal Records Act of<br />
1950 established the NWRC, beginning a 50-year history of the<br />
official stewardship of the Nation’s climatological ground-based<br />
and remotely sensed data and information.<br />
DROUGHT MONITORING...................15<br />
No single definition of drought works for all circumstances. The<br />
Drought Monitor web page depicts current drought conditions<br />
based on a consensus of Federal and academic scientists.<br />
STATE OF <strong>THE</strong> CLIMATE REPORTS ....16<br />
Producing NCDC’s monthly State of the Climate Reports,<br />
calculating the data, comparing it to past years’ data, and<br />
presenting it in a way that everyone can undestand it is a a rather<br />
complex process.<br />
NOMADS..................................................20<br />
The NOAA Operational Model Archive and Distribution System<br />
(NOMADS) project was initiated to address a growing need for<br />
remote access to high volume numerical weather prediction and<br />
global climate models and data.<br />
<strong>THE</strong> EVOLUTION OF CLIMATE<br />
SERVICES....................................................7<br />
The nature of climate services has evolved over the past 65 years<br />
from compiling simple tabulations of data to providing climate<br />
assessments, State of the Climate reports, and near real-time data.<br />
The complex and demanding aspects of climate service today<br />
require a sophisticated response.<br />
CLIMATE <strong>DATA</strong>BASE<br />
MODERNIZATION PROGRAM.............10<br />
NOAA’s Climate Database Modernization Program (CDMP) has<br />
a very simple goal: to make major climate databases available via<br />
the World Wide Web. Over 1.75 terabytes of climate data are<br />
now online. Such access will increase the utilization of climate<br />
information.<br />
NCDC <strong>2001</strong> Report 3
Foreword<br />
The NCDC has enjoyed an extremely productive and<br />
very successful year in <strong>2001</strong>. The Center marked its<br />
50 th Anniversary in October<br />
as we continued to provide<br />
excellent weather and<br />
climate data products<br />
to a Nation that relies<br />
on the Center to assist<br />
with national security,<br />
protection of property,<br />
public safety, and sustained<br />
economic development.<br />
We, as an organization, have been entrusted with a<br />
challenging and important mission for all Americans:<br />
the responsibility for the stewardship and<br />
access to the Nation’s climate-related data and<br />
information, as well as monitoring the national<br />
and global climate.<br />
As we continue to look forward to the opportunities<br />
of the future, the Center will continue to build<br />
partnerships with national and international agencies<br />
and organizations, as well as our contract partners, to<br />
deliver the best environmental data sets and products<br />
possible. In 2002,<br />
• We will continue to operate and modernize the<br />
World’s premier environmental data center, fulfilling<br />
our customer’s requirements for quality data provided<br />
in a timely manner.<br />
• We will collaborate with other agencies and<br />
organizations to describe changes to our climate and<br />
the implications of those changes.<br />
• We will strengthen and expand collaborations<br />
with other NOAA offices to implement NOAA’s<br />
environmental prediction and stewardship<br />
responsibilities.<br />
• We will foster understanding of the value of<br />
our information to stakeholders and partners in the<br />
media and private sector.<br />
• We will deliver state-of-the-art products and<br />
services based on cutting edge operations, science, and<br />
applications.<br />
• We will continue to develop and maintain a<br />
world class, diverse, dedicated, and skilled workforce<br />
through teamwork, motivation, and training.<br />
With the Center’s talented and dedicated workforce,<br />
and the opportunities before us, the future is bright.<br />
I personally look forward to 2002 as we move into our<br />
next fifty years.<br />
Thomas R. Karl<br />
Director<br />
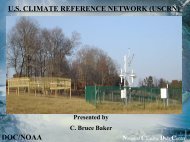
• We will implement a national Climate<br />
Reference Network (CRN).<br />
4 NCDC <strong>2001</strong> Report
NCDC MANAGEMENT AND STAFF<br />
Thomas R. Karl<br />
Director<br />
Sharon LeDuc<br />
Deputy Director<br />
Michael Crowe<br />
Science Planning Officer<br />
Benjamin Watkins<br />
Operations Planning Officer<br />
John A. Jensen<br />
Program Manager, Climate Reference Network<br />
Stephen R. Doty<br />
Program Manager, Climate Data Base Modernization<br />
Scientific Services Division<br />
David R. Easterling (acting)<br />
Division Chief<br />
Russell S. Vose<br />
Climate Archaeology and Analysis Branch<br />
Jay H. Lawrimore<br />
Climate Monitoring Branch<br />
Marc S. Plantico<br />
Product Development Branch<br />
Climate Data Division<br />
Wayne M. Faas<br />
Division Chief<br />
Arthur G. DeCotiis<br />
Data Ingest and Processing Branch<br />
August L. Shumbera<br />
Active Archive Branch<br />
Climate Services Division<br />
Peter M. Steurer<br />
Division Chief<br />
Vernell M. Woldu<br />
Customer Services Branch<br />
J. Neal Lott<br />
Data Access Branch<br />
Charles F. Carpenter<br />
Satellite Services Branch<br />
Support Services Division<br />
Robert L. Money<br />
Division Chief<br />
Kendra L. Tarver<br />
Systems Branch<br />
Pamela Y. Hughes<br />
Mission Support Branch<br />
NCDC <strong>2001</strong> Report 5
CLIMATE SERVICES<br />
LEVERAGING E-GOVERNMENT<br />
NCDC continued to show a dramatic shift to online<br />
ordering of climate data and products in FY01. By the<br />
end of FY01, online data sales increased 30% - to more<br />
than $600K - compared to FY00. In addition, online<br />
orders totalled more than 60% of all orders with more<br />
traditional offline orders totaling less than 40%.<br />
NCDC has improved customer service efficiency<br />
dramatically. Due to online web access, the timeliness of<br />
ordering NCDC data and products was reduced from five<br />
days in FY95 to less than one day in FY01. By transitioning<br />
the delivery of climate data and products to the web,<br />
NCDC has effected a major cost reduction in servicing<br />
customer requests. In FY95 almost 50 government and<br />
contractor employees serviced customer requests; in FY01,<br />
a total of 35 employees were required for this same<br />
function.<br />
ONLINE ORDERING OF CERTIFIED<br />
WEA<strong>THE</strong>R RECORDS<br />
A new E-commerce module was added to the NCDC<br />
Online Store allowing customers to purchase Certified<br />
Data online. Most states require that all records submitted<br />
as evidence in a court of law be certified. The certified data<br />
includes weather observation forms, summary publications<br />
and products, and weather charts. To transition this<br />
requirement for certification to the goals of E-government,<br />
NCDC made it possible to purchase online certified data<br />
at a price of $52.00, discounted from the usual offline rate<br />
of $60.00. Orders are still filled and shipped offline until<br />
such a time as court approval is granted for certifying data<br />
for online delivery. This system should prove very popular<br />
for customers and result in a decrease in the number of<br />
telephone calls received for certification orders.<br />
6 NCDC <strong>2001</strong> Report
<strong>THE</strong> EVOLUTION OF CLIMATE SERVICES<br />
In all areas of business and government, and even among<br />
the general public, there has been an ever-increasing<br />
awareness of climate change, especially in the last 10-<br />
20 years. Never before have people been so aware of the<br />
impact of the environment and climate variability on the<br />
quality of life and the economic health of a Nation, its<br />
citizens, and<br />
the population<br />
of the world.<br />
Government<br />
and business<br />
decisionmakers<br />
who<br />
are formulating<br />
long range<br />
strategic policies<br />
and plans<br />
require data of the highest quality and dependability. This<br />
growing ‘user community’ has increasing expectations of<br />
receiving very current information of excellent quality very<br />
quickly.<br />
In March 1936, a Works Progress Administration (WPA)<br />
project was assigned to the Weather Bureau to tabulate<br />
five million weather observations to formulate the Weather<br />
Bureau’s “Climatological Atlas of the Oceans.” During<br />
World War II, all United States observational weather<br />
records were forwarded to this Tabulating Unit, which<br />
was then in New Orleans, Louisiana. In the early 1950’s,<br />
the complete operation was moved to Asheville, North<br />
Carolina ,and designated the NWRC. During the 1950’s<br />
and 60’s the NWRC continued to process “enormous” --<br />
by the standards of that day -- volumes of observational<br />
records. These data were processed for “national civil<br />
requirements.” The NWRC prepared routine publications<br />
and conducted special studies for other government<br />
agencies, industry, and educational institutions. The<br />
NWRC also performed climatological studies under<br />
contract for the United States Navy and pursued scientific<br />
research.<br />
During the 1970’s, and 80’s, there was growing concern<br />
that the Earth’s climate was changing. This concern<br />
increased the demand for timely, accurate, and complete<br />
data for research and analysis. In 1978, Congress passed<br />
the National Climate Program Act. This act established<br />
a program which was to include “assessment of the effect<br />
of climate on the natural environment, agricultural<br />
production, energy supply and demand, land and water<br />
resources, transportation, human health, and national<br />
security.” This program was also to include “global data<br />
collection and monitoring and analysis activities to provide<br />
reliable, useful, and readily available information ...<br />
systems for the management and active dissemination of<br />
climatological data, information, and assessments ... and<br />
mechanisms for intergovernmental climate-related studies<br />
and services.”<br />
The mission of NCDC is in large part focused on<br />
stewardship and access to the Nation’s climate-related data<br />
and information, as well as monitoring the national and<br />
global climate. Because of its resources, NCDC is in an<br />
excellent position to advance the science of providing the<br />
most reliable information possible related to changes and<br />
variations of weather and climate, including its extremes.<br />
Not only are NCDC’s data of the highest quality, but the<br />
health of the world’s<br />
observing networks will<br />
soon be monitored to<br />
ensure their continued<br />
quality. The amount<br />
and diversity of<br />
NCDC’s data bases are<br />
also increasing. The<br />
growth of information<br />
technology and computer systems allows more effective<br />
archiving of ever-greater amounts of data from satellites,<br />
Doppler radars, automated sensors, and observing<br />
networks. In the wake of costly and devastating weatherrelated<br />
disasters like hurricanes, floods, and drought, there<br />
is an increased emphasis on climate monitoring.<br />
NCDC <strong>2001</strong> Report 7
Climate variations and change are critical environmental<br />
issues, which can have profound consequences on the<br />
environment and societies. Long-term observations and<br />
careful scientific study show that the climate is now<br />
changing at a rapid rate. The ability to make judgments<br />
concerning the magnitude and the rate of climate change<br />
and the attribution to specific causes is dependent on long<br />
historical series of reliable climate records. Daily decisions<br />
related to planning and design are dependent on these<br />
series. Therefore, NCDC is implementing and managing<br />
the United States CRN. This new climate-observing<br />
network is the first observing network to adhere to the ten<br />
principles of climate monitoring endorsed by the National<br />
Research Council. CRN fulfills the Nation’s need for long-<br />
term, high quality climate observations.<br />
NCDC<br />
is able to<br />
provide<br />
a unique<br />
and broad<br />
look at the<br />
present and<br />
past climate.<br />
Working<br />
with other<br />
scientists and experts from governments, universities,<br />
industry, and non-governmental agencies, NCDC<br />
scientists are able to project future changes in climate at<br />
the global, national, and regional scale. NCDC scientists<br />
provide scientific leadership, scholarly research, data,<br />
and information to these assessment activities. The<br />
needs of policy makers dealing with issues affected by<br />
global and regional climate change make such in-depth<br />
assessments vital to all aspects, impacts, and components<br />
of climate change. Some of these assessments address<br />
regional vulnerabilities, potential regional impacts, and<br />
what Americans can do to adapt to an uncertain and<br />
continuously changing climate.<br />
Users accessing NCDC’s more than one billion megabytes<br />
of data and products continue to increase at rapid rates.<br />
Currently, more than four<br />
million requests are made each<br />
year to NCDC, mainly through<br />
the Internet. This number<br />
is expected to increase to six<br />
million in 2002. In <strong>2001</strong>, 82<br />
million files were accessed<br />
from NCDC’s web site and<br />
almost five million megabytes<br />
(five terabytes) of data were<br />
downloaded. As NCDC leads the way in the area of E-<br />
government, it still places a high emphasis on traditional<br />
customer service with almost 80,000 telephone calls,<br />
letters, emails, and faxes arriving during <strong>2001</strong> requesting<br />
information on environmental data.<br />
These complex and demanding aspects of climate service<br />
require a sophisticated response. Therefore, NCDC and<br />
other agencies and departments of government have<br />
proposed a comprehensive Climate Services Plan. The goal<br />
of NOAA’s Climate Services Plan is to bring together data,<br />
knowledge, and partnerships (universities, state agencies,<br />
and Federal agencies) at all levels to create a climate service<br />
system which will<br />
apply climate data<br />
bases and information<br />
for use by decision<br />
makers whether it<br />
be the general public<br />
seeking a retirement<br />
home, a small business<br />
looking to expand, a<br />
multi-national corporation investing in new technologies,<br />
or a Federal agency responding to an extreme climate event<br />
- a coherent system which improves efficiency for the US<br />
economy because of improved decision making through<br />
the use of better climate data.<br />
8 NCDC <strong>2001</strong> Report
WSR-88D (NEXRAD) - DOPPLER RADAR<br />
NCDC made extraordinary progress in the ingest,<br />
archive and access to WSR-88D data. By ingesting the<br />
raw data onto the NCDC mass storage system as it was<br />
received (either by tape or electronically), the data are<br />
now 10-40 times more accessible, and the number of<br />
users has increased significantly. As more sites transmit<br />
data electronically, the time to access the data will<br />
continue to decrease. Likewise, the data capture rate<br />
by electronic receipt improved from 65 to 95%.One of<br />
the most significant storms of <strong>2001</strong> was Tropical Storm<br />
Allison which caused significant flooding. The Storm<br />
Total Precipitation product from NEXRAD estimates<br />
the amount of rainfall during the storm. All of these<br />
images are contained on the Climate - Watch, June<br />
<strong>2001</strong> page at the following url on the NCDC web site:<br />
http://lwf.ncdc.noaa.gov/oa/climate/extremes/<strong>2001</strong>/june/<br />
extremes0601.html<br />
NASA EARTH OBSERVING SYSTEM (EOS)<br />
LONG TERM ARCHIVE COLLABORATIONS<br />
In July <strong>2001</strong>, NOAA and the National Atmospheric and Space<br />
Administration (NASA) signed a Statement<br />
of Intent to collaborate on the long-term<br />
archive of NASA Earth Observing System<br />
(EOS) data and other of NASA’s related<br />
atmospheric and oceanographic data. This<br />
SOI, which stems from a Memorandum<br />
of Understanding from 1989, calls<br />
for NASA’s Easth Science Enterprise<br />
and NOAA’s National Environmental<br />
Satellite, Data, and Information Service<br />
(NESDIS) to agree that the NOAA /<br />
NESDIS Comprehensive Large Array-data<br />
Stewardship System (CLASS) shall serve as<br />
the national atmospheric and oceanic longterm<br />
data archive for datasets such as from<br />
the National Polar-orbiting Operational<br />
Environmental Satellite System<br />
(NPOESS) and the NPOESS Preparatory<br />
Project (NPP). NCDC will play a major<br />
role in establishing this archive.<br />
CLIMATE <strong>DATA</strong> MANAGEMENT<br />
MODIS AVERAGE TEMPERATURES<br />
DURING NOVEMBER <strong>2001</strong>.<strong>THE</strong> COLDEST<br />
TEMPERATURES APPEAR BLACK, WHILE<br />
DARK GREEN, BLUE, RED, YELLOW, AND<br />
WHITE INDICATE PROGRESSIVELY WARMER<br />
TEMPERATURES. (NASA)<br />
MODIS SNOW COVER MAP FOR <strong>THE</strong><br />
US AND CANADA, NOVEMBER <strong>2001</strong><br />
SHOWS BELOW AVERAGE SNOW COVER<br />
FOR MUCH OF <strong>THE</strong> U.S. <strong>THE</strong> SOLID RED<br />
LINE MARKS <strong>THE</strong> AVERAGE LOCATION<br />
OF <strong>THE</strong> MONTHLY SNOW EXTENT; WHITE<br />
AREAS ARE SNOW-COVERED GROUND.<br />
(NASA)<br />
NEXRAD STORM TOTAL PRECIPITATION IMAGES FROM RADAR SITES IN <strong>THE</strong> RANGE OF THIS STORM:<br />
(CLOCKWISE FROM TOP LEFT) LAKE CHARLES, LA, 22:27, GALVESTON, TX, 22:34, NEW<br />
ORLEANS, LA, 22:36, 10 JUNE, <strong>2001</strong>; PHILADELPHIA, PA, 19:32, 17 JUNE 17, <strong>2001</strong>.<br />
COLLABORATION WITH UNITED<br />
STATES GEOLOGICAL SURVEY (USGS)<br />
EARTH RESOURCES OBSERVATION<br />
SYSTEM (EROS)<br />
NESDIS/NCDC and USGS/EROS expanded their<br />
Memorandum of Agreement to permit real-time access to<br />
Advanced Very High Resolution Radiometer (AVHRR)<br />
data. The agreement was expanded to include a sharing of<br />
facilities for back-up storage. NCDC received 22 pallets<br />
of tapes and shipped to EROS 48 pallets of microfilm.<br />
This results in a cost savings for each agency.<br />
NCDC <strong>2001</strong> Report 9
CLIMATE <strong>DATA</strong>BASE MODERNIZATION PROGRAM<br />
CDMP has a very simple goal: to make major climate<br />
databases available via the World Wide Web. Over 1.75<br />
terabytes of climate data are now only a mouse click<br />
away. Such access will increase the utilization of climate<br />
information. During the year <strong>2001</strong>, the modernization<br />
program took on many different forms, from imaging and<br />
keying weather observations as they were received from<br />
the field, to making shoreline data usable in Geographic<br />
Information Systems, to imaging historical paper records<br />
and books containing climate observations from the<br />
United States and around the world. Major advances were<br />
made in making these records available on the web through<br />
the use of a number of web sites.<br />
Due to CDMP efforts and earlier projects that imaged<br />
historical paper climate records, CDMP was able to make<br />
these data available online during <strong>2001</strong>. Information<br />
Manufacturing Corporation (IMC) of Rocket Center,<br />
WV, developed a document management system called<br />
Web, Search, Store, Retrieve, Display. This system is more<br />
commonly known by its acronym: WSSRD (pronounced<br />
WIZARD). WSSRD is housed in a state-of-the-art data<br />
center where environmental conditions and security are<br />
fully maintained. Hardware is up-to-date and software is<br />
user-friendly.<br />
By the end<br />
of FY01,<br />
WSSRD<br />
was loaded<br />
with over<br />
21 million<br />
records<br />
covering 21<br />
different<br />
data types such as surface<br />
airways observational forms,<br />
cooperative data forms,<br />
climate record books and<br />
marine observations.<br />
Before CDMP and the<br />
WSSRD system, records<br />
were stored in the basement<br />
of the NCDC. When a<br />
request for information<br />
was received, NCDC staff<br />
located the paper document and the requested information<br />
was sent to the customer via fax or mail. CDMP efforts<br />
have greatly improved the efficiency of the process. Today<br />
these data are online and instantly available. Users without<br />
Internet access can contact NCDC through its modern<br />
publication subscription and distribution center in Rocket<br />
Center, WV. The staff located at this facility will respond<br />
to a toll-free telephone number, e-mail, and fax inquiries.<br />
A total of seven monthly publications are distributed from<br />
Rocket Center: six publications from the NCDC and one<br />
from the National Geophysical Data Center (NGDC).<br />
The largest data type contained within WSSRD is the<br />
Surface Airways Observational form. These forms date<br />
from 1949 to the current month and record hourly<br />
weather observations taken from civilian airports and<br />
military installations. This data set alone contains over 19<br />
million indices and images. Data are accessible by station<br />
name, state, and date. The next largest data set with<br />
765,000 indices and images, and one of the most popular<br />
with users, is the set of COOP forms. COOP observers,<br />
a network of over 8,000 members throughout the United<br />
States, most of whom are volunteers, record daily climate<br />
information. These monthly records are imaged and<br />
available in WSSRD for the period 1995 to the current<br />
month, and are also accessible via NCDC’s Online Store<br />
system.<br />
10 NCDC <strong>2001</strong> Report
Over 30 data related tasks were undertaken during<br />
FY01, with four of the five NOAA line offices actively<br />
participating in this year’s program. These tasks made<br />
a variety of climate data more accessible: foreign<br />
data journals<br />
from the NOAA<br />
Central Library<br />
and the National<br />
Oceanographic Data<br />
Center (NODC),<br />
shoreline charts from<br />
the Coastal Services<br />
Center (CSC),<br />
historical water levels<br />
from the National<br />
Ocean Survey<br />
and images from<br />
NGDC’s Defense<br />
Meteorological<br />
Satellite Program<br />
(DMSP).<br />
Access to NOAA’s collection of data sets is not restricted to<br />
WSSRD. Many agencies built or enhanced their own web<br />
sites to allow instant access to data and information. The<br />
web site of the CSC located in Charleston, SC, provides<br />
access to over 5,000 shoreline charts from across the<br />
United States. Efforts are currently underway to convert<br />
these charts from raster images to vectors. This conversion<br />
process will enable the information to be loaded into<br />
Geographical Information Systems (GIS) processes.<br />
NGDC in Boulder, CO, is converting photographic<br />
negatives of historical data from DMSP film into digital<br />
images. The DMSP film details satellite imagery of<br />
clouds, snow and ice, fires, and human settlements<br />
collected from the early 1970s. These images are being<br />
made available online through the DMSP web site. The<br />
NOAA Central Library in Silver Spring, MD, is imaging<br />
foreign meteorological data summaries. These priceless<br />
data documenting the climate of many countries over the<br />
past two centuries are being made available on the NOAA<br />
Library web site. Other tasks included efforts to modernize<br />
lightship data from the coast of America, water level data<br />
from the Great Lakes, nautical charts from United States<br />
harbors, storm data reports, pre-1890 station history<br />
information, and marine meteorological observations from<br />
the mid-1800s.<br />
Scanning paper<br />
and film is<br />
only one way<br />
that CDMP is<br />
converting data<br />
into digital form.<br />
Image Entry (IE)<br />
of London, KY,<br />
has completed a<br />
multi-year effort<br />
to key daily observations from 1892 - 1947 from the<br />
COOP network. These data were keyed from over 50,000<br />
pieces of microfiche. It took an incredible 2 billion key<br />
strokes to create this new data set. Once these data have<br />
undergone full quality control and are combined with<br />
the post-1948 data, the more than 100-year historical<br />
daily climate of the United States will have been fully<br />
documented.<br />
NCDC <strong>2001</strong> Report 11
subcontractor to SER Solutions, Dulles, VA, imaged the<br />
microfilm resulting in approximately 178,000 images being<br />
added to WSSRD. Data contained on these images were<br />
subsequently keyed. These digital data will be made available<br />
in early 2002.<br />
To facilitate this vast amount of data imaging, CDMP has<br />
established IE in London, KY, as an incoming records<br />
processing center. This facility receives paper climate<br />
records on a daily basis. Within 48 hours, these paper<br />
records are imaged, placed online through WSSRD, and<br />
the digital data are transmitted to NCDC for immediate<br />
addition to its web-based Online Store system. This quick<br />
turn-around time converting paper documents to digital<br />
images and data made these records very popular with a<br />
variety of users.<br />
The Federal Government has published climate reports and<br />
summaries since the mid-1800s. Over the years, the content,<br />
format and style of these publications have changed, while the<br />
data continues to be a valuable national resource. In <strong>2001</strong>,<br />
Lason imaged the full collection of five historical publication<br />
series, which documents the climate of states, river basins, and<br />
individual cities. These data will be made available in WSSRD<br />
early in 2002.<br />
As the American population moved west in the early 19th<br />
Century, weather conditions were routinely recorded. In a<br />
task, commonly known as the Forts Project, CDMP imaged<br />
and keyed Forts data from 600 rolls of microfilm, thereby<br />
recording data for over 5,000 locations and observations<br />
for various periods of time from the 1820s into the 1890s.<br />
Additional original records, currently located in the National<br />
Archives in Washington, DC, are slated to be<br />
imaged and keyed during the coming year.<br />
Since 1860, the United States weather observing agencies<br />
have compiled Climate Record Books. These books were<br />
previously archived on microfilm, subsequently limiting their<br />
access. During <strong>2001</strong>, Lason Systems, Inc., of Beltsville, MD,<br />
Improved access is only one part of the<br />
CDMP. The understanding of how and<br />
where observations were taken and recorded<br />
are equally important. NCDC has station<br />
history information documenting how and<br />
where observations were conducted, both<br />
in digital form and more complete records<br />
on paper. To allow the electronic ingest<br />
of current information, future expansion,<br />
and web access, CDMP has sponsored the<br />
complete redesign and implementation of<br />
a new station history database. The paper forms are also<br />
being made available by inventorying and imaging the<br />
500,000 existing pages.<br />
12 NCDC <strong>2001</strong> Report
To understand the parameters under which these original<br />
observations were taken, a search was completed to locate<br />
pristine copies of the guidelines issued since the late<br />
1800s. Known as Circulars and Federal Meteorological<br />
Handbooks, these documents are now being imaged and<br />
placed on WSSRD.<br />
Not content to limit climate<br />
history to daily temperatures<br />
and precipitation, CDMP<br />
embarked on a task to digitize<br />
hourly observations from<br />
1900 to 1948. These hourly<br />
observations contain a variety of<br />
data including pressure, winds,<br />
weather, visibility, and clouds. In<br />
<strong>2001</strong>, a priority list of stations<br />
was established and work was begun to define keying<br />
formats and instructions. Actual keying will begin in 2002.<br />
This year’s accomplishments of the CDMP would not<br />
have been possible without the efforts of many people<br />
throughout the country, all working as part of the CDMP<br />
team. By utilizing private sector contractors, the CDMP<br />
gained a pool of quality team members, while in-turn<br />
providing much-needed employment opportunities in<br />
WV, KY, and MD. IMC’s development of a streamlined,<br />
customer-oriented subscription services center at their<br />
facility in Rocket<br />
Center, WV,<br />
earned IMC<br />
employee Ms.<br />
Randie Powell<br />
the NOAA Team<br />
Member of the<br />
Month award.<br />
The Nation’s<br />
Regional Climate<br />
Centers (RCCs) also joined the CDMP team this year,<br />
lending their expertise to several CDMP projects.<br />
They worked in conjunction with IE for the Forts<br />
and pre-1949 surface forms keying tasks. The<br />
Northeast RCC , located at Cornell University in<br />
Ithaca, NY, and the Midwestern RCC in Champaign,<br />
IL, provided station selection and keying formats for<br />
IE. They will perform quality assurance on these data<br />
once the keying is completed.<br />
NODC has collected a unique set of ocean climate reports<br />
covering the last century. Reports from around the World<br />
and in a variety of paper formats have been boxed and<br />
shipped to IE for inventory and imaging. This task will<br />
make yet another data set, once buried in file cabinets,<br />
accessible via the internet.<br />
CDMP has proven quite successful, both at creating<br />
jobs and in making climate data from across NOAA<br />
more accessible. NOAA agencies and the participating<br />
partners are working together to serve the American<br />
people both now and for future generations. A great<br />
deal has been accomplished, yet much remains to be done.<br />
The CDMP staff, both public and private, look forward<br />
to achieving their goal of a greater utilization of a true<br />
national resource for years to come.<br />
NCDC <strong>2001</strong> Report 13
CLIMATE MONITORING<br />
CROP MOISTURE INDEX<br />
CLIMATE<br />
ASESSMENT<br />
REPORT FOR <strong>2001</strong><br />
NCDC took the lead in<br />
authoring the Bulletin<br />
of the American<br />
Meteorological<br />
Society article Climate<br />
Assessment for <strong>2001</strong>.<br />
The Moisture Stress Index for corn and soybean crops is a<br />
measure of the effects of drought and catastrophic wetness<br />
on national crop yield and is calculated through the use<br />
of a drought index (the Palmer Z Index) and annual<br />
average crop productivity values within each U.S. climate<br />
division. Moisture stress, either a lack or an abundance<br />
of soil moisture during critical phases of the crop growth<br />
and development cycle, affects US average crop yield,<br />
particularly when moisture stress occurs in the most highly<br />
productive crop growing areas. Soil moisture conditions<br />
in July and August were found to be the best indicators of<br />
average crop yield for corn and soybeans and, as such, are<br />
used in creating the Moisture Stress Index.<br />
In <strong>2001</strong>, NCDC expanded the<br />
operational State of the Climate<br />
reports to include Weekly<br />
Temperature and Precipitation<br />
reports as well as preliminary<br />
monthly reports which are<br />
available by the 5th day of<br />
the following month. The production of these reports is<br />
primarily automated.<br />
WEEKLY TEMPERATURE<br />
AND PRECIPITATION<br />
REPORTS<br />
RESIDENTIAL ENERGY DEMAND<br />
TEMPERATURE INDEX<br />
The Residential Energy Demand Temperature Index<br />
(REDTI) is calculated to provide retrospective information<br />
on the impact of monthly and seasonal temperatures on<br />
residential energy demand from 1895 to the present.<br />
REDTI is based on heating and cooling degree day totals,<br />
population weighted for the Nation. To simplify yearto-year<br />
comparisons, the index is scaled from 0 to 100.<br />
An index of 100 is assigned to the year with the greatest<br />
population weighted degree day average while the year<br />
with the smallest degree day average receives an index of 0.<br />
More information is avalable at:<br />
http://lwf.ncdc.noaa.gov/oa/climate/research/cie/redti.html<br />
Calculations of the Moisture Stress Index are based on<br />
the extent of severe to catastrophic drought or catastrophic<br />
wetness within the crop growing regions and the average<br />
annual crop productivity of each climate division within<br />
the crop growing region. More information can be found<br />
at:<br />
http://lwf.ncdc.noaa.gov/oa/climate/research/cie/cmsi.html<br />
14 NCDC <strong>2001</strong> Report
DROUGHT MONITORING<br />
As noted on the Drought Monitor web page:<br />
http://enso.unl.edu/monitor/about.html<br />
no single definition of drought works for all circumstances.<br />
The complexity of drought and the large variety of<br />
sectors affected by the phenomenon has resulted in the<br />
development over the years of many different indices to<br />
detect and measure droughts. But no single index works<br />
under all circumstances.<br />
The Drought<br />
Monitor was<br />
created as a<br />
synthesis of<br />
multiple indices,<br />
outlooks and<br />
news accounts,<br />
and depicts<br />
current drought<br />
conditions based<br />
on a consensus<br />
of Federal and academic scientists. Although initiated<br />
before the National Drought Policy Commission<br />
(http://www.fsa.usda.gov/indc/) issued its May 2000 report<br />
to the President and Congress, the Drought Monitor is an<br />
effective example of the Commission’s recommendation<br />
to “improve collaboration among scientists and managers<br />
to enhance the effectiveness of observation networks,<br />
monitoring, prediction, information delivery, and applied<br />
research.”<br />
The Drought Monitor is<br />
prepared on a weekly basis<br />
by Federal and academic<br />
partners. The authors rotate<br />
from among scientists at<br />
NCDC (U.S. Department of<br />
Commerce (DOC)/NOAA/<br />
NESDIS), Climate Prediction<br />
Center (CPC) (DOC/NOAA/NWS), Joint Agricultural<br />
Weather Facility (U.S. Department of Agriculture (USDA)<br />
& DOC/NOAA), and National Drought Mitigation<br />
Center (University of Nebraska-Lincoln). The authors<br />
prepare a map and narrative based on several indicators<br />
and input from local field experts. The indicators include<br />
such indices as the Palmer Drought Index, Keetch-Byram<br />
Drought Index, Standardized Precipitation Index (SPI),<br />
satellite Vegetation Health Index, percent of normal<br />
precipitation, soil moisture model percentiles, and U.S.<br />
Geological Survey (USGS) weekly stream flow percentiles,<br />
among many others. The local field experts include the<br />
NOAA Climate Diagnostics Center, NWS field offices,<br />
USGS, National Water and Climate Center (USDA/<br />
Natural Resources Conservation Service), NOAA Regional<br />
Climate Centers, state climatologists, and additional local,<br />
state and federal experts.<br />
The primary users of<br />
the Drought Monitor<br />
include the NWS,<br />
USDA Farm Service<br />
Agency, state water<br />
agencies and other<br />
resource management<br />
institutions and<br />
organizations, the<br />
Weather Channel and<br />
other specialized media,<br />
the general media and<br />
the general public.<br />
NCDC <strong>2001</strong> Report 15
STATE OF <strong>THE</strong> CLIMATE REPORTS<br />
Calculating all the data, comparing it to past years’ data,<br />
and presenting it in a way that everyone can understand is<br />
a rather complex process - not a simple matter of collecting<br />
surface data from around the world and averaging the<br />
individual station data into a U.S. or global average.<br />
around the world. These data usually arrive during the first<br />
five to eight days of each month. The climate monitoring<br />
team uses a series of quality control processes developed<br />
at NCDC to ensure the quality of the collected data. The<br />
data are then merged with the existing data sets.<br />
To perform all the analyses necessary for producing<br />
NCDC’s State of the Climate reports each month, the<br />
team of experts at NCDC uses data from the world’s<br />
largest climate database. An investment in data set<br />
development began more than 15 years ago at NCDC<br />
to form the basis of NCDC’s climate monitoring efforts.<br />
Among the essential sources of data is the Global Historical<br />
Climatology Network (GHCN), a database containing<br />
data from around the world. The United States<br />
Historical Climatology Network (USHCN), a database<br />
of 1221 high quality stations throughout the contiguous<br />
United States, is used as well. Satellite data are also relied<br />
upon, including the Reynolds Optimum Interpolated<br />
sea surface temperature data set as well as a blended data set<br />
of satellite and surface station data.<br />
Monitoring climate conditions around the world in near<br />
real-time begins by obtaining the current data. NCDC<br />
receives temperature and precipitation data from stations<br />
Comparing the current global statistics for land areas with<br />
the historical statistics, the team relies most heavily on the<br />
GHCN database. This data set contains mean temperature<br />
data from more than 7000 stations and monthly<br />
precipitation totals for more than 20,000 stations. Some<br />
of the data go back to the 1700s, yet the core data are<br />
from 1880 to the present time. During the past century,<br />
global temperatures have increased approximately 1<br />
degreeF. To ensure that the observed trends and variability<br />
are not biased by non-climatic influences, the creation of<br />
the GHCN data set, and many of the other data sets at<br />
NCDC, have included the development of algorithms for<br />
removing artificial biases from the observed record. These<br />
non-climatic factors include such things as instrument<br />
changes, station moves, and changes in observer practices.<br />
For the ocean areas of the earth, the team uses a historical<br />
homogeneity adjusted sea surface temperature data set<br />
from the United Kingdom Meteorological Office that<br />
contains information from ocean-going vessels dating back<br />
to the 1800s. These data, as well as ocean buoy data, are<br />
blended with satellite data from NOAA’s AVHRR sensor<br />
using an Optimum Interpolation technique. To calculate<br />
the combined land and sea surface conditions, the team<br />
uses a technique for creating a land-sea temperature index.<br />
For the United States, the team receives data from several<br />
sources, and uses various databases in analyzing current<br />
conditions and placing them in historical perspective.<br />
NCDC works with CPC in rapidly acquiring data from<br />
sources such as the Nation’s 13 river forecast centers and<br />
the Nation’s Snotel (automated system for collecting<br />
snowpack and related climatic data in the Western U.S.)<br />
sites. Data are also received from approximately 900<br />
16 NCDC <strong>2001</strong> Report
Automated Surface Observing System (ASOS) stations.<br />
Of these, about 250 are NWS first order stations; the<br />
remainder are predominately military stations and small<br />
airport sites. The near realtime<br />
data are combined<br />
with NCDC’s Climate<br />
Division Database, as well as<br />
NCDC’s USHCN database<br />
using a first difference<br />
technique developed at<br />
NCDC, to place current<br />
climate conditions in<br />
historical perspective.<br />
In addition to<br />
monitoring the<br />
global and national<br />
climate, NCDC’s<br />
climate monitoring<br />
team is closely<br />
monitoring drought<br />
conditions in the<br />
United States. The<br />
team is working with the USDA, the National Drought<br />
Mitigation Center, and CPC to keep abreast of drought<br />
conditions around the nation through the weekly<br />
publication of the Drought Monitor.<br />
Historical perspective is also provided on current drought<br />
conditions throughout the United States each month.<br />
These analyses are part of NCDC’s State of the Climate<br />
reports and contain numerous drought indices and related<br />
indicators of drought from the late 1800’s to the present.<br />
In addition to the Palmer indices other indices such as<br />
the SPI are calculated at NCDC. While Palmer’s indices<br />
are water balance indices that consider water supply<br />
(precipitation), demand (evapotranspiration) and loss<br />
(runoff), the SPI is a probability index that considers only<br />
precipitation. The probabilities are standardized so that an<br />
index of zero indicates the median precipitation amount<br />
(half of the historical precipitation amounts are below<br />
the median, and half are above the median). The index is<br />
negative for drought, and positive for wet conditions. As<br />
the dry or wet conditions become more severe, the index<br />
becomes more negative or positive. The SPI is computed<br />
by NCDC for several time scales, ranging from one month<br />
to 24 months, to capture the various scales of both shortterm<br />
and long-term drought.<br />
A credit to NOAA and to the Nation, NCDC’s climate<br />
monitoring team takes raw data about the climate and<br />
turns it into information that we can all understand and<br />
use. To see examples of this work, see:<br />
http://lwf.ncdc.noaa.gov/oa/climate/research/monitoring.html<br />
NCDC <strong>2001</strong> Report 17
<strong>NATIONAL</strong> AND INTER<strong>NATIONAL</strong><br />
COLLABORATIONS AND PARTNERSHIPS<br />
STATUS OF GLOBAL CLIMATE REPORT<br />
TROIKA ON<br />
MONITORING<br />
NEAR REAL-<br />
TIME CLIMATE<br />
EXTREMES<br />
The Canada / Mexico/<br />
U.S. Troika hosted<br />
by NCDC was a big<br />
success. The results of the<br />
workshop included the<br />
development of a plan<br />
that begins with an annual<br />
extremes monitoring<br />
product for North America scheduled to be released in<br />
time for the WMO Annual Climate Statement for 2002.<br />
Each country was very enthusiastic about the establishment<br />
of this cooperative effort in monitoring and assessing<br />
climate extremes, particularly with the prospect of an<br />
eventual system for near real-time monitoring across all<br />
three countries. NCDC gave a presentation on the current<br />
data and product delivery systems, future plans for online<br />
data to be added to those systems, the overall data model<br />
and requirements for the systems, and the factors and<br />
impact of placing the data online.<br />
NCDC supported<br />
numerous press<br />
releases throughout the<br />
year and contributed<br />
to various publications<br />
and press releases<br />
issued by WMO, such<br />
as the annual press<br />
release on the climate<br />
of the year and the<br />
publication of the WMO Statement on the Status of the<br />
Global Climate in 2000.<br />
WMO COMMISSION FOR CLIMATOLOGY<br />
NCDC represented the United<br />
States at the Thirteenth Session<br />
of the WMO Commission for<br />
Climatology (CCl) in Geneva,<br />
Switzerland. The WMO<br />
meeting was attended by 150<br />
delegates representing more<br />
than 90 countries. The NCDC<br />
representative was chief United States delegate among<br />
a delegation of four. Other delegates from NCDC were<br />
appointed posts within the CCl, such as a committee<br />
chairperson, the Lead of the Open Program Area Group<br />
on The Monitoring and Analysis of Climate Variability<br />
and Change, and as a member of the CCl<br />
Management Group.<br />
INTER<strong>NATIONAL</strong> HAZARD<br />
SUPPORT WEB INTERFACE<br />
NCDC has created an online interface directing<br />
users to the key data and information which<br />
are most useful in responding to and addressing<br />
disasters and hazards - both natural and not,<br />
on local and regional scales, nationally and<br />
internationally. The url for the online interface<br />
is:<br />
http://lwf.ncdc.noaa.gov/oa/climate/intl-hazards.html<br />
18 NCDC <strong>2001</strong> Report
U.S. ARMY GLOBAL PRECIPITATION<br />
CLASSIFICATION PROJECT<br />
NWS SPACING STUDY<br />
NCDC completed a<br />
spacing study for the NWS<br />
to determine the optimum<br />
distribution of sites for<br />
their COOP Observer<br />
modernization initiative.<br />
Using operational and<br />
climate verification<br />
requirements from several<br />
Calibration for the model developed by NCDC to map<br />
precipitation statistics for the US Army Topographic<br />
Engineering Center for the Global Precipitation<br />
Classification Project was completed and preliminary<br />
precipitation maps were generated for the contiguous<br />
US. The model uses daily precipitation data, the NDVI<br />
(Normalized<br />
Difference<br />
Vegetation<br />
Index), and<br />
topography<br />
to estimate<br />
precipitation<br />
statistics.<br />
The initial maps for selected months were compared to<br />
maps produced for the US Climate Atlas using PRISM<br />
(Parameter-Regressions on Independent Slopes Model) and<br />
the results were very encouraging. Although the maps will<br />
undergo more detailed examination, this initial comparison<br />
provided the first indication that the method, data<br />
compilation, programs, and ArcView scripts were working<br />
correctly and producing reasonable results.<br />
Federal agencies, NCDC<br />
used GIS tools to provide<br />
pictorial information<br />
for use in their decision<br />
making process.<br />
CD-ROM AND WEB PAGE FOR AFGHANISTAN<br />
AND SURROUNDING AREAS<br />
NCDC developed a CD-ROM product which included a<br />
portion of the new web system providing data access and<br />
describing the climatology of Afghanistan and surrounding<br />
countries. The online system links<br />
to numerous online data sources<br />
and information concerning offline<br />
data sources. The key part of the<br />
system is an interactive map of<br />
the area which links to numerous<br />
climatological summaries,<br />
developed in the Federal Climate<br />
Complex (FCC) by the Air Force<br />
Combat Climatology Center (AFCCC), the United States<br />
Navy, and NCDC. The CD-ROM provides direct access<br />
(without Internet connection) to the station and country<br />
climate summaries and to satellite derived products. The<br />
url for the web site is:<br />
http://lwf.ncdc.noaa.gov/noaamil/afghan/<br />
Copies of the CD-ROM were built at NCDC and are<br />
available upon request.<br />
NCDC <strong>2001</strong> Report 19
NOMADS<br />
To address a growing need for remote access to high<br />
volume numerical weather prediction and global climate<br />
models and data, NCDC, along with the National<br />
Centers for Environmental Prediction (NCEP) and<br />
the Geophysical Fluid Dynamics Laboratory (GFDL),<br />
initiated the NOMADS project. NOMADS addresses<br />
model data access needs as outlined in the U.S. Weather<br />
Research Program (USWRP) Implementation Plan for<br />
Research in Quantitative Precipitation Forecasting and<br />
Data Assimilation to “redeem practical value of research<br />
findings and facilitate their transfer into operations.”<br />
The NOMADS framework was also developed to<br />
facilitate climate model and observational data intercomparison<br />
issues as discussed in documents such as the<br />
Intergovernmental Panel on Climate Change (IPCC 1990,<br />
1995, <strong>2001</strong>) and the U.S. National Assessment (2000).<br />
NOMADS is being developed as “A Unified Climate and<br />
Weather Archive” so that users can make decisions about<br />
their specific needs on time scales from days (weather), to<br />
months (El Niño), to decades (global warming).<br />
NOMADS is a network of data servers using established<br />
and emerging technologies to access and integrate model<br />
and other data stored in geographically distributed<br />
repositories in heterogeneous formats. NOMADS enables<br />
the sharing and inter-comparing of model results and is a<br />
major collaborative effort, spanning multiple Government<br />
agencies and academic institutions. The data available<br />
under the NOMADS framework include model input and<br />
Numerical Weather Prediction (NWP) gridded output<br />
from NCEP, and<br />
Global Climate<br />
Models (GCM) and<br />
simulations from<br />
GFDL and other<br />
leading institutions<br />
from around the<br />
world.<br />
The goals of NOMADS are to:<br />
• improve access to GCM and NWP model<br />
output and provide the observational and model data<br />
assimilation products for regional model initialization and<br />
forecast verification,<br />
• improve operational weather forecasts,<br />
• develop linkages between the research<br />
and operational modeling communities and foster<br />
collaborations between the climate and weather modeling<br />
communities,<br />
• promote product development and<br />
collaborations within the geo-science communities (ocean,<br />
weather, and climate) to study multiple earth systems using<br />
collections of distributed data under a sustainable system<br />
architecture.<br />
The NOMADS framework is actively partnering with<br />
existing and development activities including CLASS, the<br />
National Oceanographic Partnership Program’s (NOPP)<br />
National Virtual Ocean Data System (NVODS), the<br />
Department of Energy’s Earth System Grid (ESG), and<br />
20 NCDC <strong>2001</strong> Report
the Thematic Real-time Environmental Data Distributed<br />
Services (THREDDS) project being developed through<br />
the National Science Foundation and Unidata. To ensure<br />
that Agency and Institutional requirements are being met,<br />
the NOMADS collaborators have established Science and<br />
Technical Advisory Panels. These newly established panels<br />
would ensure the NOMADS<br />
system and metadata<br />
architecture could provide<br />
necessary inter-operability and<br />
would develop data archive<br />
requirement recommendations<br />
to NOAA.<br />
NOMADS fosters system<br />
inter-operability by integrating<br />
legacy systems, emerging<br />
technologies, and existing<br />
metadata conventions used<br />
for models and observational data. NOMADS relies on<br />
local decisions about data holdings. Loosely<br />
combining legacy systems, while developing<br />
new ways to support data access to valuable<br />
data, permits NOMADS to work on the<br />
cutting edge of distributed data systems.<br />
In this effort, no one institution carries<br />
the weight of data delivery since data are<br />
distributed across the network and served<br />
by the institutions that developed the data.<br />
The responsibility for documentation falls<br />
on the data generator, with the Advisory<br />
Panels ensuring overall quality, ensuring<br />
systems standards, and determining which<br />
NOMADS data are required for long-term<br />
storage. Further, NOMADS in no way precludes the need<br />
for national centers to maintain and support long-term<br />
archives. In fact, NOMADS and secure data archives are<br />
mutually supportive and necessary for long-term research.<br />
The primary science benefit of the NOMADS framework<br />
is that it enables a feedback mechanism to tie Government<br />
and university research directly back to the NOAA<br />
operational communities, numerical weather prediction<br />
quality control and diagnostics processes at NCEP, and<br />
climate model assessments and inter-comparisons from<br />
around the world.<br />
Both researchers<br />
and policy-makers<br />
alike now expect our<br />
national data assets<br />
to be easily accessible<br />
and interoperable with<br />
each other, regardless of<br />
their physical location.<br />
As a result, an effective interagency distributed data<br />
service requires coordination of data infrastructure and<br />
management extending beyond traditional organizational<br />
boundaries. Under NOMADS and its collaborators,<br />
NOAA will be at the forefront of a worldwide-distributed<br />
data-serving network. This will allow users at any level, to<br />
obtain weather and climate information. This will allow<br />
the users to make better, informed decisions about how<br />
nature will impact their future, either in their life or in<br />
their business decisions. For an example of a NOMADS<br />
web site see the GFDL NOMADS server at:<br />
http://www.nomads.gfdl.noaa.gov.<br />
NCDC <strong>2001</strong> Report 21
NEW PRODUCTS FOR <strong>2001</strong><br />
1971-2000 CLIMATE NORMALS<br />
NCDC has a responsibility to fulfill the mandate of<br />
Congress “... to establish and record the climatic conditions<br />
of the United States.” This mandate to describe the<br />
climate was combined with guidelines established through<br />
international agreement which requires the calculation of<br />
‘climatological normals.’ A climatological normal is the<br />
average value of a meteorological element over 30 years.<br />
Many WMO members, including the United States,<br />
update their normals at the completion of each decade.<br />
The normal climate helps in describing the climate<br />
and is used as a base to which current conditions can<br />
be compared. Every ten years, NCDC computes new<br />
thirty-year climate normals for selected temperature and<br />
precipitation elements for a large number of U.S. climate<br />
and weather stations. These normals are summarized in<br />
daily, monthly, divisional, and supplementary normals<br />
products. Monthly and daily normals were computed for<br />
nearly 8000 stations in the United States, Puerto Rico, the<br />
Virgin Islands, and the United States Pacific Islands. This<br />
represents an increase of over 15 percent in the number of<br />
stations from the previous 1961-1990 edition.<br />
The digital Normals files may be ordered online through<br />
the NCDC Online Store. Digital publication files (in<br />
PDF format) of the daily and monthly Normals are also<br />
available. The new Normals will be used by NOAA’s<br />
NWS in the daily and monthly climate reports, beginning<br />
January 2002. Additional information on the 1971-2000<br />
climate normals is available by going to:<br />
http://www.ncdc.noaa.gov/normals.html.<br />
EXTENDED SEA SURFACE TEMPERATURE<br />
ANALYSIS<br />
Since the oceans cover most of the earth’s surface, the sea<br />
surface temperature (SST) is an important component of<br />
global climate. A statistical reconstructed SST based on<br />
observations from ships is currently available at NCDC for<br />
the period 1950-<strong>2001</strong>. A new extended reconstructed SST<br />
has been developed at NCDC for the period beginning<br />
1854. The analysis produces a global SST map for each<br />
month and an error estimate for the analysis. The figure<br />
shows the average annual SST anomalies between 60S and<br />
60N with 95% confidence intervals.<br />
22 NCDC <strong>2001</strong> Report
COMPREHENSIVE U.S. SNOW<br />
CLIMATOLOGIES<br />
During FY <strong>2001</strong>, the Federal Emergency Management<br />
Agency (FEMA) funded NCDC to update U.S. Snow<br />
Climatologies. The funding enabled NCDC to process<br />
data through December 2000, convert the software to be<br />
run operationally, and put the database online. NCDC's<br />
U.S. Snow Climatology web page can be accessed at:<br />
http://lwf.ncdc.noaa.gov/oa/climate/monitoring/snowclim/<br />
mainpage.html<br />
A daily climatology and a monthly/seasonal climatology<br />
were created for each station. The statistics for the daily<br />
climatology were generated for each day from the years of<br />
data available for the day. The statistics for the monthly/<br />
seasonal climatology were generated from year-month or<br />
year-season sequential values. The climatic parameters<br />
include number of days with snowfall and snow cover,<br />
dates of first and last occurrence of daily snowfall, snow<br />
frequencies and return periods, and daily, monthly and<br />
seasonal total snowfall amount.<br />
The snow climatology data base consists of snowfall and<br />
snow depth statistics for several thousand stations in the<br />
COOP Network. Stations in the lower 48 States and<br />
Alaska were analyzed. A suite of statistics (mean, median,<br />
first and third quartiles, extremes [both amounts and<br />
dates of occurrence], and frequencies/probabilities) was<br />
generated for several climatic parameters. The specific<br />
statistics that were computed vary with parameter, but<br />
the number of years with non-missing data (NYRS) was<br />
computed for each parameter. The beginning and ending<br />
years and NYRS information are crucial for any interstation<br />
or inter-seasonal comparisons the user might wish<br />
to make.<br />
These snow climatologies enable NOAA to put snow<br />
events into historical perspective, support operational snow<br />
activities of the NWS, and aid FEMA in making disaster<br />
declarations for record or near-record snowstorms.<br />
NCDC <strong>2001</strong> Report 23
BIBLIOGRAPHY FOR <strong>2001</strong><br />
JOURNAL ARTICLES:<br />
Chernykh, I., O. Alduchov, and R.E. Eskridge, <strong>2001</strong>:<br />
Trends in low and high cloud boundaries and errors in<br />
height determination of cloud boundaries. Bulletin of the<br />
American Meteorological Society, 82, 1941-1947.<br />
Basist, A., C. Williams Jr., T.F. Ross, M.J. Menne, N.<br />
Grody, R. Ferraro, S. Shen, and A.T.C. Chang, <strong>2001</strong>:<br />
Using the Special Sensor Microwave Imager to monitor<br />
surface wetness. Journal of hydrometeorology, 2 (3), 297-308.<br />
Chang, H., B.M. Evans, and D.R. Easterling, <strong>2001</strong>: The<br />
effects of climate change on stream flow and nutrient<br />
loading, Journal of the American Water Resources Association,<br />
37 (4), 973-986.<br />
Chernykh, I., O. Alduchov, and R.E. Eskridge, <strong>2001</strong>:<br />
Trends in low and high cloud boundaries and errors in<br />
height determination of cloud boundaries. Bulletin of the<br />
American Meteorological Society, 82, 1941-1947.<br />
Durre, I., and J.M. Wallace, <strong>2001</strong>: Factors influencing the<br />
cold season diurnal temperature range in the United States.<br />
Journal of Climate, 14, 3263-3278.<br />
Durre, I., and J.M. Wallace, <strong>2001</strong>: The warm season dip<br />
in the diurnal temperature range over the eastern United<br />
States. Journal of Climate, 14, 354-360.<br />
Folland, C.K., N.A. Rayner, S.J. Brown, T.M. Smith,<br />
S.S. Shen, D.E. Parker, I. Macadam, P.D. Jones, R.N.<br />
Jones, N. Nicholls, and D.M.H. Sexton, <strong>2001</strong>: Global<br />
temperature change and its uncertainties since 1861.<br />
Geophysical Research Letters, 28, 2621-2624.<br />
Golubev, V.S., J.H. Lawrimore, P.Ya. Groisman, N.A.<br />
Speranskaya, S.A. Zhuravin, M.J. Menne, T.C. Peterson,<br />
and R.W. Malone, <strong>2001</strong>: Evaporation changes over<br />
the contiguous United States and the former USSR:<br />
a reassessment. Geophysical Research Letters, 28 (13),<br />
2665-2668. Online Copy<br />
Groisman, P.Ya., R.W. Knight, and T.R. Karl, <strong>2001</strong>:<br />
Heavy precipitation and high streamflow in the contiguous<br />
United States: Trends in the 20th century. Bulletin of the<br />
American Meteorological Society, 82, 219-246. Online Copy<br />
Groisman, P.Ya., and E.Ya. Rankova, <strong>2001</strong>: Precipitation<br />
trends over the Russian permafrost-free zone: removing<br />
the artifacts of pre-processing. International Journal of<br />
Climatology, 21, 657-678. Online Copy<br />
Hansen, J, R. Ruedy, M. Sato, M. Imhoff, W. Lawrence,<br />
D. Easterling, T. Peterson, and T. Karl, <strong>2001</strong>: A closer look<br />
at United States and global surface temperature change.<br />
Journal of Geophysical Research, 106 (D20), 23947-23963.<br />
Heim, R.R., Jr., <strong>2001</strong>: New network to monitor climate<br />
change. EOS, Transactions, 82 (12), 143 (Mar. 20, <strong>2001</strong>).<br />
Lawrimore, J.H., M.S. Halpert, G.D. Bell, M.J. Menne,<br />
B. Lyon, R.C. Schnell, K.L. Gleason, D.R. Easterling, W.<br />
Thiaw, W.J. Wright, R.R. Heim Jr., D.A. Robinson, and L.<br />
Alexander, <strong>2001</strong>: Climate Assessment for 2000. Bulletin of<br />
the American Meteorological Society, 82, S1-S55.<br />
Menne, M.J. and C.E. Duchon, <strong>2001</strong>: Monthly detection<br />
of inhomogeneities and errors in daily maximum and<br />
minimum temperature observations. Journal of Atmospheric<br />
and Oceanic Technology, 18, 1136-1149.<br />
Shindell, D.T., G.A. Schmidt, M.E. Mann, D. Rind, and<br />
A. Waple, <strong>2001</strong>: Solar forcing of regional climate change<br />
during the Maunder Minimum. Science 294, 2149-2152.<br />
24 NCDC <strong>2001</strong> Report
Smith, T.M., and R.W. Reynolds, <strong>2001</strong>: Bias corrections<br />
for historical sea surface temperatures based on marine air<br />
temperatures. Journal of Climate, 15, 73-87.<br />
Zhang, H.-M., M. Prater and T. Rossby, <strong>2001</strong>: Isopycnal<br />
Lagrangian statistics from the North Atlantic Current<br />
RAFOS float observations. Journal of Geophysical Research,<br />
106 (C7, July 15), 13817-13836.<br />
Rossby, T. and H.-M. Zhang, <strong>2001</strong>: The near-surface<br />
velocity and potential vorticity structure of the Gulf<br />
Stream. Journal of Marine Research, 59 (6, November),<br />
949-975.<br />
PROCEEDINGS:<br />
Arnfield, J.D., <strong>2001</strong>: A flexible system to manage<br />
and query NOAA station history information. 17th<br />
International Conference on Interactive Information and<br />
Processing Systems (IIPS), Albuquerque, NM, January 14-19,<br />
<strong>2001</strong>, American Meteorological Society, Boston, MA,<br />
468-472.<br />
Baker, C.B., T.P. Meyers, M.E. Hall, and R.R. Heim<br />
Jr., The precision and accuracy of the temperature<br />
measurements for the Climate Reference Network.<br />
Preprints, 11th Symposium on Meteorological Observations<br />
and Instrumentration, 14-18 January <strong>2001</strong>, Albuquerque,<br />
NM, American Meteorological Society, Boston, MA, 5-6.<br />
Creech, T.G., and A.L. McNab, <strong>2001</strong>: Using a GIS<br />
to estimate the spatial variation of precipitation due to<br />
topography. 17th International Conference on Interactive<br />
Information and Processing Systems (IIPS), Albuquerque,<br />
NM, January 14-19, <strong>2001</strong>, American Meteorological<br />
Society, Boston, MA, 30-33.<br />
Duchon, C.E., G.G. Wade, J. Cole, and R.R. Heim, Jr.,<br />
<strong>2001</strong>: Laboratory studies of a vibrating wire precipitation<br />
gage. Preprints, 11th Symposium on Meteorological<br />
Observations and Instrumentration, 14-18 January <strong>2001</strong>,<br />
Albuquerque, NM, American Meteorological Society,<br />
Boston, MA, 188-189.<br />
Gleason, B.E., and D.R. Easterling, <strong>2001</strong>: Tropical cyclone<br />
precipitation and dry spell mitigation. Preprints, 12th<br />
Symposium on Global Change and Climate Variations,<br />
14-18 January <strong>2001</strong>, Albuquerque, NM, American<br />
Meteorological Society, Boston, MA, 322.<br />
Gleason, B.E., and D.R. Easterling, <strong>2001</strong>: Revised U.S.<br />
climate change indices. Preprints, 12th Symposium on<br />
Global Change and Climate Variations, 14-18 January <strong>2001</strong>,<br />
Albuquerque, NM, American Meteorological Society,<br />
Boston, MA, 190.<br />
Heim, R.R., Jr., C.B. Baker, C.E. Duchon, and J.D.<br />
Arnfield, <strong>2001</strong>: A Climate Reference Network for the<br />
United States. Automated weather stations for applications<br />
in agriculture and water resources management: current<br />
use and future perspectives, proceedings of an international<br />
workshop, 6-10 March 2000, Lincoln, Nebraska, USA,<br />
(AGM-3, WMO/TD No. 1074), World Meteorological<br />
Organization, Geneva, Switzerland, 195-210.<br />
Heim, R.R. Jr., <strong>2001</strong>: Deployment of the U.S.<br />
Climate Reference Network: FY2000 status. Preprints,<br />
11th Symposium on Meteorological Observations and<br />
Instrumentration, 14-18 January <strong>2001</strong>, Albuquerque, NM,<br />
American Meteorological Society, Boston, MA, 231-234.<br />
Heim, R.R., Jr., M. Haylock, C.S. Frederiksen, and<br />
N. Nicholls, <strong>2001</strong>: Trends in climate change indicators,<br />
1950-1991. Preprints, 12th Symposium on Global Change<br />
and Climate Variations, 14-18 January <strong>2001</strong>, Albuquerque,<br />
NM, American Meteorological Society, Boston, MA,<br />
42-45.<br />
NCDC <strong>2001</strong> Report 25
O<strong>THE</strong>R:<br />
Lott, N., R. Baldwin, and P. Jones, <strong>2001</strong>: The FCC<br />
integrated surface hourly database, a new resource of global<br />
climate data. (National Climatic Data Center technical<br />
report <strong>2001</strong>-01). Asheville, N.C.: National Climatic Data<br />
Center, 42 pp. Online Copy<br />
Lott, N., T. Ross, and A. Graumann, <strong>2001</strong>: NCDC<br />
products and services guide. Asheville, N.C.: National<br />
Climatic Data Center, 93 pp. Online Copy<br />
Easterling, D.R., and T.R. Karl, <strong>2001</strong>: Potential<br />
consequences of climate variability and change for the<br />
Midwestern United States, Chapter 6. In: Climate change<br />
impacts on the United States: the potential consequences of<br />
climate variability and change, report to Congress of the<br />
National Assessment Synthesis Team. New York: Cambridge<br />
University Press, 167-189.<br />
Lott, N., T. Ross, S. Stephens, and T. Owen, <strong>2001</strong>: A<br />
climatology of northern Utah for the 2002 Winter Olympics.<br />
(National Climatic Data Center technical report <strong>2001</strong>-02).<br />
Asheville, N.C.: National Climatic Data Center, 26 pp.<br />
Online Copy<br />
MacCraken, M., E. Barron, D.R. Easterling, B. Felzer,<br />
and T.R. Karl, <strong>2001</strong>: Scenarios for climate variability and<br />
change, Chapter 1. In: Climate change impacts on the<br />
United States: the potential consequences of climate variability<br />
and change, report to Congress of the National Assessment<br />
Synthesis Team. New York: Cambridge University Press,<br />
13-73.<br />
Peterson, T.C., C. Folland, G. Gruza, W. Hogg, A. Mokssit,<br />
and N. Plummer, <strong>2001</strong>: Report of the activities of the Working<br />
Group on Climate Change Detection and Related Rapporteurs,<br />
1998-<strong>2001</strong> [Online, printed copies can also be mailed from],<br />
International CLIVAR Project Office, Southamption, UK.<br />
(Available online from WMO:<br />
http://www.clivar.org/publications/wg_reports/wgccd/<br />
wgccd_report_3.pdf<br />
as ICPO publication no. 48), March, <strong>2001</strong>, 143 pp.<br />
Reynolds, R.W., D.E. Harrison, and D.C. Stokes, <strong>2001</strong>:<br />
Specific contributions to the observing system, sea surface<br />
temperatures, Chapter 2.1. In: Observing the ocean in the<br />
21st century, edited by C.J. Koblinsky and N.R. Smith.<br />
Melbourne, Australia: Bureau of Meteorology, 87-101.<br />
Online Copy<br />
Ross, T., and N. Lott, <strong>2001</strong>: Billion dollar U.S. weather<br />
disasters, 1980-2000. Asheville, N.C.: National Climatic<br />
Data Center, 2pp.<br />
(http://www.ncdc.noaa.gov/ol/reports/billionz.html)<br />
26 NCDC <strong>2001</strong> Report
OUTREACH<br />
NCDC has developed a vigorous Outreach<br />
Program in the local community and<br />
across the nation. NCDC’s outreach effort<br />
is, in part, to inform our users of the rich<br />
and varied history of climatology and<br />
meteorology. Weather and climate records<br />
have their roots in one of the earliest<br />
observers, Rev. John Companius Holm who<br />
made the first known regular weather<br />
observation in North America near<br />
Wilmington, Delaware in 1644. Almost<br />
100 years later, Benjamin Franklin tracked a hurricane<br />
while serving as Postmaster General. Franklin and Thomas<br />
Jefferson loom almost as large in the history of American<br />
weather and climatology as they do in the history of our<br />
country. George Washington, an avid weather watcher,<br />
made daily weather observations in his diary up to the day<br />
before his death.<br />
Another aspect of Outreach is to spread an awareness<br />
of NCDC’s mission throughout our local community<br />
through participation in local education and civic activities.<br />
NCDC works cooperatively with local high schools in job<br />
vocational programs which allow students to work part<br />
time at the Center during the school year. In <strong>2001</strong>, NCDC<br />
expanded its summer intern program with 12 college<br />
students working on various projects at the Center. NCDC<br />
also has extensive outreach opportunities at the middle and<br />
elementary school levels by hosting career days and various<br />
tours and open house activities. NCDC personnel are<br />
involved in the community by speaking at educational and<br />
civic groups functions with many of those groups visitng<br />
the Center each year. In conjunction with NESDIS and<br />
other NOAA agencies, NCDC routinely exhibits at various<br />
scientific and professional conferences each year.<br />
Outreach accomplishments for <strong>2001</strong>:<br />
• <strong>2001</strong> NCDC Internship Program<br />
• Career and Recruitment fairs<br />
• Community Activities-Excellence in Public<br />
Service & Combined Federal Campaign<br />
• Big Brothers and Big Sisters of Western North<br />
Carolina Mentors and Matches Program<br />
• Educational Alliances - Asheville Chamber of<br />
Commerce Partners in Education & Asheville City<br />
High School Business Alliance<br />
In addition, NCDC has developed a Diversity web<br />
page which highlights many of the activities of<br />
NCDC in the area of supporting and promoting<br />
diversity in the workplace. The address is:<br />
http://www.ncdc.noaa.gov/noaaonly/diversity/<br />
The NCDC Diversity page is accessible by all<br />
NOAA employees and is located on the main page<br />
under “About NCDC.”<br />
NCDC <strong>2001</strong> Report 27
<strong>THE</strong> EMPLOYEES<br />
Dawn W. Anders<br />
David R. Easterling<br />
Joseph E. Kraft<br />
Richard W. Reynolds<br />
Gloria E. Anderson<br />
William E. Angel<br />
Jeffrey D. Arnfield<br />
Garry L Ayres<br />
Clifford B. Baker<br />
Richard Baldwin<br />
Alan A. Basist<br />
Curtis W. Benner<br />
Harriett A. Blevins<br />
Matthew W. Bodosky<br />
David P. Bowman<br />
Carolyn C. Bradford<br />
Debra S. Braun<br />
Danny E. Brinegar<br />
William O. Brown<br />
Michael G. Burgin<br />
Theodore T. Burlew<br />
Mary R. Burris<br />
Sharon Capps-Hill<br />
Charles F. Carpenter<br />
Jan A. Carpenter<br />
Larry W. Carr<br />
Lila P. Carr<br />
Shirley S. Carter<br />
Dimitri H. Chappas<br />
Morris H. Cole<br />
Berry K. Coleman<br />
Tamara G. Creech<br />
Michael Crowe<br />
Harry W. Dahlberg<br />
Kenneth D. Davidson<br />
John W. Davis<br />
Arthur G. DeCotiis<br />
Sylvia A. DeCotiis<br />
Stephen A. DelGreco<br />
Claude D. Dellinger<br />
Jill C. Derby<br />
Dianne V. Dicus<br />
Kyle Dion<br />
Stephen R. Doty<br />
Ann R. Dunker<br />
Imke Durre<br />
Joe D. Elms<br />
Terri Esham<br />
Robert E. Eskridge<br />
Devoyd S. Ezell<br />
Wayne M. Faas<br />
John R. Fauerbach<br />
Katherine A. Fincher<br />
Stephen E. Fleming<br />
Walter L. France<br />
Deborah L. Franklin<br />
Phala L. Franks<br />
Helen V. Frederick<br />
Byron E. Gleason<br />
Karin L. Gleason<br />
Catherine S. Godfrey<br />
Andrew Goldstein<br />
Geoffrey P. Goodrum<br />
Lynn A. Goss<br />
Axel Graumann<br />
Larry J. Griffin<br />
Mary A. Griffin<br />
Nathaniel B. Guttman<br />
Alan D. Hall<br />
Gregory R. Hammer<br />
Billy W. Harless<br />
Sharon K. Hawkins<br />
Richard R. Heim<br />
Claude J. Hensley<br />
Grace Hensley<br />
Conrad S. Hinson<br />
Samuel E. Hocking<br />
Paul E. Hudspeth<br />
Joan L. Hufton<br />
John P. Hughes<br />
Pamela Y. Hughes<br />
Glenn M. Hyatt<br />
John A. Jensen<br />
Cynthia B. Karl<br />
Thomas R. Karl<br />
Katherine B. Kidwell<br />
Joseph C. Klein<br />
John M. Kobar<br />
Dennis M. Lackey<br />
Blake L. Lasher<br />
Jay H. Lawrimore<br />
Rosalind J. Ledford<br />
Sharon LeDuc<br />
Donna F. Lefler<br />
Jack N. Lott<br />
Susan E. Love-Brotak<br />
Daniel J. Manns<br />
James M. Martin<br />
Elaine H. Mason<br />
Karon R. Mathews<br />
Billie F. Maybin<br />
Milton S. McCown<br />
Douglas G. McElreath<br />
Alvin L. McGahee<br />
Tammy A. McLaughlin<br />
Alan L. McNab<br />
Matthew J. Menne<br />
Theressa D. Metcalf<br />
Barbara R. Metz<br />
Karen L. Miller<br />
Martha S. Miller<br />
Robert L. Money<br />
Rhonda Mooring<br />
Robert A. Nagan<br />
Cheryl L. Nave<br />
Ryan M. Nelson<br />
Murray L. Nicodemus<br />
Karen S. Owen<br />
Timothy W. Owen<br />
Jackie L. Passmore<br />
Ernest R. Payne<br />
Thomas C. Peterson<br />
Charles S. Phillips<br />
Karol D. Pittman<br />
Marc S. Plantico<br />
Virginia M. Pressley<br />
Linda D. Preston<br />
Nancy C. Rathburn<br />
Henry J. Ray<br />
Ron Ray<br />
Deborah B. Riddle<br />
Jeannette Rivera<br />
Jeffrey M. Robel<br />
Douglas P. Ross<br />
Thomas F. Ross<br />
Glenn K. Rutledge<br />
JoAnn A. Sceizina<br />
Kenneth E. Schmidt<br />
Mark R. Seiderman<br />
Joyce A. Shaffer<br />
August L. Shumbera<br />
David P. Smith<br />
Elizabeth O. Smith<br />
Jonathan M. Smith<br />
Thomas Smith<br />
Douglas R. Snowden<br />
Linda S. Statler<br />
Scott E. Stephens<br />
Peter M. Steurer<br />
Robert F. Summers<br />
Kendra Tarver<br />
Margaret K. Tessier<br />
John L. Thomas<br />
Charles W. Thomason<br />
Charles Towles<br />
Michael L. Urzen<br />
Sara Veasey<br />
Russ Vose<br />
Janet Wall<br />
Alva L. Wallis<br />
Barbara A. Warnick<br />
Benjamin Watkins<br />
Carmella D. Watkins<br />
Hilery T. Whitehurst<br />
Claude N. Williams<br />
Roger L. Winchell<br />
Vernell M. Woldu<br />
Winifred F. Womack<br />
Vickie S. Wright<br />
David Wuertz<br />
Angela P. Wyatt<br />
28 NCDC <strong>2001</strong> Report
ACRONYMS<br />
AFCCC................................. Air Force Combat Climatology Center<br />
ASOS......................................Automated Surface Observing System<br />
AVHRR ....................... Advanced Very High Resolution Radiometer<br />
CCl...................................................... Commission on Climatology<br />
CDMP.......................... Climate Database Modernization Program<br />
CLASS ............Comprehensive Large Array-data Stewardship System<br />
COOP ......................................... Volunteer Cooperative Observer<br />
CPC ...................................................... Climate Prediction Center<br />
CRN ................................................... Climate Reference Network<br />
CSC ........................................................... Coastal Services Center<br />
DMSP............................ Defense Meteorological Satellite Program<br />
DOC ..................................United States Department of Commerce<br />
EOS ..........................................................Earth Observing System<br />
EROS .....................................Earth Resources Observation System<br />
ESG ...................................................................Earth System Grid<br />
FCC ........................................................Federal Climate Complex<br />
FEMA................................ Federal Emergency Management Agency<br />
GCM ......................................................... Global Climate Models<br />
GFDL ..............................Geophysical Fluid Dynamics Laboratory<br />
GHCN .............................Global Historical Climatology Network<br />
GIS ............................................Geographical Information System<br />
IE ................................................................................ Image Entry<br />
IMC ................................Information Manufacturing Corporation<br />
IPCC ........................ Intergovernmental Panel on Climate Change<br />
NASA .................... National Atmospheric and Space Administration<br />
NCDC.............................................. National Climatic Data Center<br />
NCEP ...................... National Centers for Environmental Prediction<br />
NDVI .................................Normalized Difference Vegetation Index<br />
NESDIS .......................... National Environmental Satellite, Data, and<br />
............................................................................Information Service<br />
NEXRAD ...........................Next Generation Radar - Doppler Radar<br />
NGDC ........................................National Geophysical Data Center<br />
CREDITS<br />
Catherine S. Godfrey, editor.....................content, layout, and design<br />
Jay Lawrimore, Linda Statler,<br />
Glenn Rutledge, Karin Gleason,<br />
Richard Heim, Carmella Watkins...........................................content<br />
Rosalind Ledford.............................................................copy editing<br />
Linda Preston .....................................................................references<br />
NOAA ............. National Oceanic and Atmospheric Administration<br />
NODC ..................................National Oceanographic Data Center<br />
NOMADS......................... NOAA Operational Model Archive and<br />
......................................................................... Distribution System<br />
NOPP.......................National Oceanographic Partnership Program<br />
NPOESS..................................National Polar-orbiting Operational<br />
........................................................ Environmental Satellite System<br />
NPP................................................... NPOESS Preparatory Project<br />
NVODS..................................National Virtual Ocean Data System<br />
NWP ................................................Numerical Weather Prediction<br />
NWRC ....................................... National Weather Records Center<br />
NWS........................................................ National Weather Service<br />
NYRS.................................................Years with Non-Missing Data<br />
PRISM...........Parameter-Regressions on Independent Slopes Model<br />
RCC ......................................................... Regional Climate Center<br />
REDTI .................. Residential Energy Demand Temperature Index<br />
SPI ................................................ Standardized Precipitation Index<br />
SST............................................................Sea Surface Temperature<br />
THREDDS...................... Thematic Real-time Environmental Data<br />
..........................................................................Distributed Services<br />
USDA...............................United States Department of Agriculture<br />
USGS............................................. United States Geological Survey<br />
USHCN .................. United States Historical Climatology Network<br />
USWRP........................... United States Weather Research Program<br />
WDC.................................................................World Data Center<br />
WMO...................................... World Meteorological Organization<br />
WPA ................................................Works Progress Administration<br />
WSR-88D.......................................Weather Service Doppler Radar<br />
WSSRD ................................. Web, Search, Store, Retrieve, Display<br />
COVER PAGE<br />
1. Veach-Baley Federal Building<br />
2. Grove Arcade Building, p. 1<br />
3. NEXRAD image of precipitation totals from Hurricane<br />
Allison over Galveston, TX., p. 9<br />
4. CDMP Team members, p. 10<br />
5. Residential Energy Demand Temperature<br />
Index, p. 14<br />
6. MODIS temperature data, p. 9<br />
7. Hurricane Allison making landfall over TX<br />
and LA., p. 9<br />
2 3<br />
1<br />
CONTACTS<br />
National Climate Data Center<br />
151 Patton Avenue<br />
Asheville, NC 28801-5001<br />
828-271-4800<br />
7<br />
4 5<br />
6<br />
http://www.ncdc.noaa.gov<br />
NCDC <strong>2001</strong> Report 29
The NCDC Mission:<br />
To be responsible for the stewardship of and access to the Nation’s<br />
climate-related data and information, and to be responsible for<br />
assessing and monitoring the National and global climate.