You also want an ePaper? Increase the reach of your titles
YUMPU automatically turns print PDFs into web optimized ePapers that Google loves.
previous 12 hours at 3-h intervals (analyses and 3-h forecasts) are used for a 12-h wave hindcast.<br />
Winds from the AVN at 3-h intervals out to 72 hours are used to produce wave forecasts up to<br />
72 hours at hourly intervals.<br />
3. Performance Evaluation<br />
The WNA has run on the Cray C90 computer intermittently since August 1998 and continuously<br />
on the IBM since the beginning of June 1999. The adequacy of the model has been evaluated by<br />
comparing model output of the WNA and the ECGM with observed data at NDBC buoys. Figure<br />
2 shows scatter plots of the significant wave height (H s ) produced by the WNA for +00 hr<br />
forecasts, respectively, for June 1999. Also shown are the following statistical indices: the mean<br />
bias error (bis), root Also presented are scatter plots and statistics for wind speed and direction.<br />
Similar results for the ECGM are given in Fig. 3. It should be noted that wind input to the ECGM<br />
is different from that of the WNA. Wind data used in ECGM are interpolated to the wave model<br />
grid from EDAS and eta data on the native 32 km grid mesh at 10m height.<br />
Although the statistics for this model are only for June, 1999, we have the performance from the<br />
NWW3 global wave model which covers a 3 year period from 1997 through 1999 and the AKW<br />
regional wave model which covers from June 1998 to the present to draw upon since all three<br />
models are based on the NNW3, except that the bathymetry has been included and the resolution<br />
is much finer. The results of the comparison show that the WNA's predictions have less statistical<br />
error, less scattering and higher correlation with observations than the ECGM's which is<br />
consistent with the performance of the other wave models.<br />
4. Available Products and Dissemination<br />
The following wind and wave parameters are available in GRIB format at<br />
ftp://polar.wwb.noaa.gov/pub/waves, on Family of Services (FOS), on AFOS and facsimile<br />
circuits until they are retired, and on AWIPS as GRIB bulletins: H s , D m , T m , peak wave period and<br />
direction, wind sea peak period and direction, wind speed and direction, and u- and v-wind<br />
components. Spectral text bulletins are also available on the web at the site above and will be on<br />
AWIPS as soon AWIPS headers are assigned.<br />
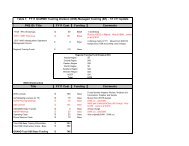
a. GRIB bulletins<br />
GRIB bulletins are available for use in AWIPS and for transmission on the Numerical Data<br />
Service of FOS. Table 2 gives the bulletin headers and their meaning. Bulletins are available at 6-h<br />
intervals from 00- through 72-h. Available parameters are H s , D m , T m , peak wave period and<br />
direction, wind sea peak wave period and direction, and u and v components of the wind velocity.<br />
A 0.25 x 0.25 degree lon./lat. grid is used with a domain of 98.25 o W - 29.75 o W by 0.25 o S -<br />
50.25 o N.<br />
b. AFOS graphics products<br />
On AFOS, only the total significant wave height and the prevailing wave direction at selected grid<br />
points are transmitted. Figure 6 presents a sample AFOS chart. The arrows indicate the prevailing<br />
wave directions and the numerical values next to them indicate the total significant wave height in<br />
feet. These charts are transmitted twice daily at approximately 0515 UTC and 1735 UTC. They<br />
have also been converted to AWIPS graphics and are available in AWIPS as graphics only. The