A Comparison of Seafloor Classification Methods Through the Use ...
A Comparison of Seafloor Classification Methods Through the Use ...
A Comparison of Seafloor Classification Methods Through the Use ...

Create successful ePaper yourself
Turn your PDF publications into a flip-book with our unique Google optimized e-Paper software.
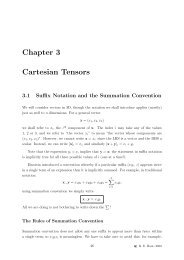
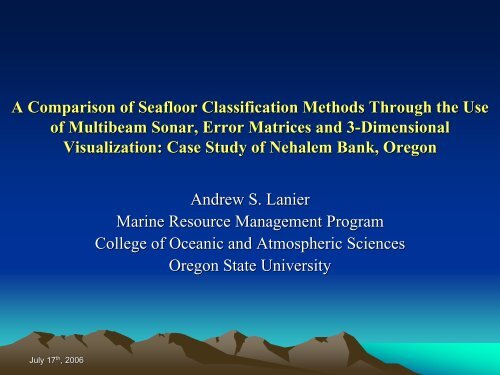
A <strong>Comparison</strong> <strong>of</strong> <strong>Seafloor</strong> <strong>Classification</strong> <strong>Methods</strong> <strong>Through</strong> <strong>the</strong> <strong>Use</strong><br />
<strong>of</strong> Multibeam Sonar, Error Matrices and 3-Dimensional<br />
3<br />
Visualization: Case Study <strong>of</strong> Nehalem Bank, Oregon<br />
Andrew S. Lanier<br />
Marine Resource Management Program<br />
College <strong>of</strong> Oceanic and Atmospheric Sciences<br />
Oregon State University<br />
July 17 th , 2006
Thesis Outline<br />
• Introduction<br />
– Background & Motivation<br />
– Multibeam Sonar Principles<br />
• Study Site and Data Set<br />
Description<br />
– Processing<br />
– Results<br />
• Benthic Habitat <strong>Classification</strong><br />
– Background<br />
– Topographic <strong>Classification</strong><br />
– Quantitative Assessment<br />
– Backscatter <strong>Classification</strong><br />
• Discussion <strong>of</strong> Results<br />
• Conclusions and Future<br />
Implications<br />
• Acknowledgements<br />
Submersible<br />
dive images from<br />
Nehalem Bank<br />
July 17 th , 2006 MS Thesis Defense
Background<br />
Timeline <strong>of</strong> Significant Events<br />
Rockfish Conservation Area (May, 2006)<br />
MSA Reauthorized<br />
EFH evaluation mandated<br />
NMFS declares 9 groundfish<br />
species“Over-fished” –Implements<br />
Area Closures<br />
NMFS publishes Final EIS<br />
alternatives<br />
White = Regulatory<br />
Yellow = Non-Regulatory<br />
NMFS Litigation Re: EIS<br />
PEW Oceans Commission<br />
1 st EFH Maps published<br />
US Oceans Commission<br />
(Bellman et al, 2006)<br />
July 17 th , 2006 MS Thesis Defense
Active Tectonics and<br />
<strong>Seafloor</strong> Mapping Lab<br />
Motivation<br />
1 st Published EFH Map<br />
Thematic interpretation<br />
(Romsos, 2004)<br />
Data Gaps<br />
Scale and Resolution Issues<br />
My Role: To evaluate what<br />
kinds <strong>of</strong> analysis are possible<br />
when <strong>the</strong>re is a high density<br />
<strong>of</strong> different types (and quality)<br />
<strong>of</strong> data available<br />
(Romsos, 2004)<br />
July 17 th , 2006 MS Thesis Defense
Motivation<br />
Study Goals<br />
Identify <strong>the</strong> limitations <strong>of</strong> <strong>the</strong> multibeam sonar data set.<br />
<strong>Use</strong> <strong>the</strong> Nehalem Bank study site to address <strong>the</strong><br />
following questions:<br />
– Does <strong>the</strong> multibeam data provide an accurate depiction<br />
<strong>of</strong> <strong>the</strong> seafloor topography? What artifacts remain and<br />
propagate into <strong>the</strong> classified images and data layers?<br />
– How do you assess <strong>the</strong> quality <strong>of</strong> a benthic<br />
classification attempt when groundtruthing information<br />
is at a different scale <strong>of</strong> observation?<br />
July 17 th , 2006 MS Thesis Defense
Thesis Outline<br />
• Introduction<br />
– Background & Motivation<br />
– Multibeam Sonar Principles<br />
• Study Site and Data Set<br />
Description<br />
– Processing<br />
– Results<br />
• Benthic Habitat <strong>Classification</strong><br />
– Background<br />
– Topographic <strong>Classification</strong><br />
– Quantitative Assessment<br />
– Backscatter <strong>Classification</strong><br />
• Discussion <strong>of</strong> Results<br />
• Conclusions and Future<br />
Implications<br />
• Acknowledgements<br />
Multibeam<br />
Sidescan<br />
July 17 th , 2006 MS Thesis Defense
Active Remote Sensing<br />
Multibeam Sonar Principles<br />
Motion Corrections<br />
Sound reflection characteristics<br />
Common Artifacts<br />
July 17 th , 2006 MS Thesis Defense
Thesis Outline<br />
• Introduction<br />
– Background & Motivation<br />
– Multibeam Sonar Principles<br />
– Benthic Habitat <strong>Classification</strong>s<br />
• <strong>Methods</strong> and Schemes<br />
• Study Site and Data Set Description<br />
– Processing<br />
– Results<br />
• <strong>Methods</strong> Tests and Results<br />
– Topographic <strong>Classification</strong><br />
– Quantitative Assessment<br />
– Backscatter <strong>Classification</strong><br />
• Discussion <strong>of</strong> Results<br />
• Conclusions and Future Implications<br />
• Acknowledgements<br />
Graphic Here <strong>of</strong> MB Survey<br />
+ Processing Steps<br />
(Base maps by J. Chaytor)<br />
July 17 th , 2006 MS Thesis Defense
Data Specifics:<br />
– Collected using University <strong>of</strong><br />
Washington RV Thomas G.<br />
Thompson, using Kongsberg Simrad<br />
EM300 Sonar a 30 kHz frequency<br />
(August, 2002).<br />
– Collected over a period <strong>of</strong> 3 days and<br />
covers an area <strong>of</strong> approximately 375<br />
km 2<br />
– 135 one degree (1x1) acoustic beams<br />
(swath width ~1.5X water depth)<br />
– Effective EM300 depth range ~100m<br />
to ~3000m<br />
Topographic Processing Steps:<br />
MBedit MBvelocitytool MBtide<br />
Nehalem Bank Data<br />
Tide Corrections<br />
Scientist Cave<br />
July 17 th , 2006 MS Thesis Defense
Nehalem Bank Backscatter Data<br />
Nehalem Bank Backscatter Data<br />
Backscatter Processing<br />
• Angle filter to correct for <strong>the</strong> influence <strong>of</strong> grazing angle on <strong>the</strong> grey level reflectance values (MBbackanglecorrect)<br />
July 17 th , 2006 MS Thesis Defense
Thesis Outline<br />
• Introduction<br />
– Background & Motivation<br />
– Multibeam Sonar Principles<br />
• Study Site and Data Set<br />
Description<br />
– Processing<br />
– Results<br />
• Benthic Habitat <strong>Classification</strong><br />
– Background<br />
– Topographic <strong>Classification</strong><br />
– Quantitative Assessment<br />
– Backscatter <strong>Classification</strong><br />
• Discussion <strong>of</strong> Results<br />
• Conclusions and Future<br />
Implications<br />
• Acknowledgements<br />
Model <strong>of</strong> <strong>Classification</strong> Procedures<br />
Topographic<br />
BTM<br />
BTM Classified<br />
Image<br />
DEM<br />
Qualitative<br />
Assessment<br />
Reference<br />
Points<br />
Error Matrices<br />
Quantitative<br />
Assessment<br />
SIM<br />
SIM Classified<br />
Image<br />
Backscatter<br />
Backscatter<br />
Image<br />
Dive<br />
Interpretation<br />
Textural<br />
Analysis<br />
Classified<br />
Image<br />
Qualitative<br />
Assessment<br />
Input Data Set<br />
Analysis Method<br />
Result<br />
Assessment<br />
July 17 th , 2006 MS Thesis Defense
Benthic <strong>Classification</strong> <strong>Methods</strong><br />
<strong>Seafloor</strong> <strong>Classification</strong> efforts falls behind that <strong>of</strong> terrestrial classification because <strong>of</strong> <strong>the</strong><br />
nature <strong>of</strong> collecting observational data under water (Difficult to collect, $$$, Time)<br />
Types <strong>of</strong> data available:<br />
– Sample collection, <strong>the</strong> acquisition <strong>of</strong> remotely sensed data (sidescan sonar, multibeam<br />
sonar, seismic), and observational video groundtruth data<br />
Common types <strong>of</strong> classification:<br />
By single variable<br />
– Depth<br />
– Substrate<br />
Image classification techniques:<br />
– Spatial analysis<br />
• Spatial filtering<br />
• Digital Elevation Model (DEM) derivatives (slope, aspect, plan, pr<strong>of</strong>ile)<br />
Previous work on <strong>the</strong> Oregon seafloor Conducted @ Heceta Bank ( Nasby-Lucas et<br />
al., 2002; Whitmire, 2003).<br />
July 17 th , 2006 MS Thesis Defense
Benthic Terrain Modeler <strong>Classification</strong><br />
<strong>Classification</strong> Process<br />
Definition <strong>of</strong> Zones<br />
Crests –<br />
•High points in <strong>the</strong> terrain<br />
•values greater than one standard deviation<br />
from <strong>the</strong> mean in <strong>the</strong> positive direction.<br />
• Depressions –<br />
•Low points in <strong>the</strong> terrain<br />
•Values greater than one standard deviation<br />
from <strong>the</strong> mean in <strong>the</strong> negative direction.<br />
• Flats –<br />
•Flat points in <strong>the</strong> terrain<br />
•values that are within one standard deviation<br />
<strong>of</strong> <strong>the</strong> mean. Flats have a slope that is 5.<br />
Bathymetric Position Index<br />
July 17 th , 2006 MS Thesis Defense
Benthic Terrain Modeler <strong>Classification</strong><br />
<strong>Classification</strong> Process<br />
<strong>Classification</strong> Dictionary<br />
July 17 th , 2006 MS Thesis Defense
SIM <strong>Classification</strong><br />
Surface Interpretation Method<br />
<strong>Use</strong>s a randomly sited set <strong>of</strong> points<br />
interpreted in <strong>the</strong> 3D environment<br />
Model <strong>of</strong> <strong>Classification</strong> Process<br />
•1 st Calculation <strong>of</strong> spatial indices<br />
•2 nd Multiple derived spatial analysis indices<br />
are condensed using PCA and intersected<br />
with <strong>the</strong> interpreted points to create<br />
classification signatures.<br />
•3 rd The signatures are used in a maximum<br />
likelihood classification algorithm to group<br />
<strong>the</strong> values into classes.<br />
July 17 th , 2006 MS Thesis Defense
Topographic <strong>Classification</strong> Results<br />
BTM<br />
SIM<br />
July 17 th , 2006 MS Thesis Defense
Topographic <strong>Classification</strong> Results<br />
Class<br />
Description<br />
Topographic Classified Area<br />
1<br />
Narrow<br />
Depression<br />
500<br />
3DSIM<br />
BTM Tool<br />
2<br />
3<br />
Depression Local<br />
Crest<br />
Depression<br />
Gentle Slope<br />
4 Crest Depression<br />
5 Crest Ridgetop<br />
6 Crest Plateau<br />
Area (10^9 meters)<br />
450<br />
400<br />
350<br />
300<br />
250<br />
200<br />
150<br />
30.00<br />
25.00<br />
20.00<br />
15.00<br />
10.00<br />
5.00<br />
7 Crest Hillslope<br />
8<br />
9<br />
10<br />
Open Slope<br />
Depression<br />
Open Slope<br />
Crest<br />
Open Shelf<br />
Slope<br />
100<br />
50<br />
0<br />
0.00<br />
1 2 3 4 5 6 7 8 9<br />
1 2 3 4 5 6 7 8 9 10<br />
Class<br />
July 17 th , 2006 MS Thesis Defense
Topographic <strong>Classification</strong> Results<br />
Qualitative <strong>Comparison</strong><br />
Summary<br />
BTM<br />
Strengths<br />
• Fine structural detail<br />
Weaknesses<br />
• Bank edges<br />
SIM<br />
Strengths<br />
• Fine structural detail<br />
• Bank edges<br />
Weaknesses<br />
• Sonar Artifacts<br />
July 17 th , 2006 MS Thesis Defense
Thesis Outline<br />
• Introduction<br />
– Background & Motivation<br />
– Multibeam Sonar Principles<br />
– Benthic Habitat <strong>Classification</strong>s<br />
• <strong>Methods</strong> and Schemes<br />
• Study Site and Data Set Description<br />
– Processing<br />
– Results<br />
• <strong>Methods</strong> Tests and Results<br />
– Topographic <strong>Classification</strong><br />
– Quantitative Assessment<br />
– Backscatter <strong>Classification</strong><br />
• Discussion <strong>of</strong> Results<br />
• Conclusions and Future Implications<br />
• Acknowledgements<br />
Model <strong>of</strong> <strong>Classification</strong> Procedures<br />
Topographic<br />
BTM<br />
BTM Classified<br />
Image<br />
DEM<br />
Qualitative<br />
Assessment<br />
Reference<br />
Points<br />
Error Matrices<br />
SIM<br />
SIM Classified<br />
Image<br />
Backscatter<br />
Backscatter<br />
Image<br />
Dive<br />
Interpretation<br />
Textural<br />
Analysis<br />
Classified<br />
Image<br />
Qualitative<br />
Assessment<br />
Input Data Set<br />
Analysis Method<br />
Quantitative<br />
Assessment<br />
Result<br />
Assessment<br />
July 17 th , 2006 MS Thesis Defense
Quantitative Assessment <strong>Methods</strong><br />
• Introduction<br />
– Reference Data<br />
• <strong>Methods</strong><br />
– Reference Points Created<br />
and Interpreted<br />
– Compared to <strong>the</strong> results<br />
from <strong>the</strong> classification<br />
methods.<br />
– An error matrix was<br />
completed for each<br />
classified grid.<br />
3D Perspective View <strong>of</strong> Nehalem Bank<br />
July 17 th , 2006 MS Thesis Defense
Quantitative Assessment Results<br />
July 17 th , 2006 MS Thesis Defense
Quantitative Assessment Results<br />
Error Matrices (Simplified <strong>Classification</strong>)<br />
Error Matrices Statistics<br />
KHAT
Thesis Outline<br />
• Introduction<br />
– Background & Motivation<br />
– Multibeam Sonar Principles<br />
– Benthic Habitat <strong>Classification</strong>s<br />
• <strong>Methods</strong> and Schemes<br />
• Study Site and Data Set Description<br />
– Processing<br />
– Results<br />
• <strong>Methods</strong> Tests and Results<br />
– Topographic <strong>Classification</strong><br />
– Quantitative Assessment<br />
– Backscatter <strong>Classification</strong><br />
• Discussion <strong>of</strong> Results<br />
• Conclusions and Future Implications<br />
• Acknowledgements<br />
Model <strong>of</strong> <strong>Classification</strong> Procedures<br />
Topographic<br />
BTM<br />
BTM Classified<br />
Image<br />
DEM<br />
Qualitative<br />
Assessment<br />
Reference<br />
Points<br />
Error Matrices<br />
SIM<br />
SIM Classified<br />
Image<br />
Backscatter<br />
Backscatter<br />
Image<br />
Dive<br />
Interpretation<br />
Textural<br />
Analysis<br />
Classified<br />
Image<br />
Qualitative<br />
Assessment<br />
Input Data Set<br />
Analysis Method<br />
Quantitative<br />
Assessment<br />
Result<br />
Assessment<br />
July 17 th , 2006 MS Thesis Defense
Backscatter Image <strong>Classification</strong><br />
Textural Analysis<br />
Nehalem Bank backscatter image documents an unusual<br />
phenomenon.<br />
Textural Analysis relies only on characteristic patterns <strong>of</strong> reflectance.<br />
Grey Level Co-occurrence Matrices (GLCM)<br />
– <strong>Use</strong>d to calculate statistical indices<br />
Indices used in this study were: (based upon Cochrane & Lafferty, 2001; Diaz, 1999)<br />
– Homogeneity – How alike are <strong>the</strong> pixels within a neighborhood<br />
– Entropy – How ordered are <strong>the</strong> pixels within a neighborhood<br />
July 17 th , 2006 MS Thesis Defense
Textural Analysis <strong>Methods</strong><br />
Backscatter Image <strong>Classification</strong><br />
• Match submersible dive groundtruth data to <strong>the</strong><br />
backscatter imagery (Overlaid on DEM)<br />
Submersible Dive Interpretation<br />
by Natalie Strom, (2006)<br />
• Each Habitat is characterized using a two<br />
letter code. The first letter represents > 50%<br />
<strong>of</strong> <strong>the</strong> field <strong>of</strong> view and <strong>the</strong> second letter must<br />
represent > 20%.<br />
•Each habitat section must occur for at least<br />
10 seconds <strong>of</strong> <strong>the</strong> video transect.<br />
July 17 th , 2006 MS Thesis Defense
Backscatter Image <strong>Classification</strong><br />
<strong>Methods</strong> (cont.)<br />
Compute GLCM derived indices<br />
Create training sites<br />
Produce classification signatures<br />
Classify using <strong>the</strong> Maximum Likelihood<br />
clustering algorithm<br />
July 17 th , 2006 MS Thesis Defense
Strengths<br />
Rocky Ridges, Low Relief Mud, Mixed Class<br />
Weaknesses<br />
Shadows, Noise, Data Gaps Classified incorrectly<br />
Textural Analysis Results<br />
Strengths<br />
Rock Types Distinguished<br />
Weaknesses<br />
Low Relief Mud, Shadows<br />
July 17 th , 2006 MS Thesis Defense
Thesis Outline<br />
• Introduction<br />
– Background & Motivation<br />
– Multibeam Sonar Principles<br />
– Benthic Habitat <strong>Classification</strong>s<br />
• <strong>Methods</strong> and Schemes<br />
• Study Site and Data Set Description<br />
– Processing<br />
– Results<br />
• <strong>Methods</strong> Tests and Results<br />
– Topographic <strong>Classification</strong><br />
– Quantitative Assessment<br />
– Backscatter <strong>Classification</strong><br />
• Discussion <strong>of</strong> Results<br />
• Conclusions and Future Implications<br />
• Acknowledgements<br />
Model <strong>of</strong> <strong>Classification</strong> Procedures<br />
Topographic<br />
BTM<br />
BTM Classified<br />
Image<br />
DEM<br />
Qualitative<br />
Assessment<br />
Reference<br />
Points<br />
Error Matrices<br />
SIM<br />
SIM Classified<br />
Image<br />
Backscatter<br />
Backscatter<br />
Image<br />
Dive<br />
Interpretation<br />
Textural<br />
Analysis<br />
Classified<br />
Image<br />
Qualitative<br />
Assessment<br />
Input Data Set<br />
Analysis Method<br />
Quantitative<br />
Assessment<br />
Result<br />
Assessment<br />
July 17 th , 2006 MS Thesis Defense
Discussion<br />
Data Set<br />
• Topographic Data<br />
– Processing<br />
–Results<br />
– Knowledge extent<br />
• Backscatter Data<br />
– Processing<br />
–Results<br />
– Knowledge extent<br />
July 17 th , 2006 MS Thesis Defense
Topographic<br />
<strong>Classification</strong><br />
• Both methods<br />
– Semi-automated<br />
– Moderate success<br />
• Quality Assessments<br />
– Qualitative<br />
– Quantitative<br />
Discussion<br />
July 17 th , 2006 MS Thesis Defense
Backscatter <strong>Classification</strong><br />
Discussion<br />
Dive interpretations<br />
– Correctly sited on landscape<br />
Textural Analysis<br />
– Using GLCM’s<br />
Mixed Results<br />
– worked well for Dive 3430<br />
– somewhat poorly for Dive 3431<br />
Sidescan imagery changes <strong>the</strong><br />
picture, and our perception <strong>of</strong><br />
<strong>the</strong> area<br />
Final interpretation<br />
– EM300 imagery is likely imaging<br />
subsurface seafloor characteristics<br />
EM300 Imagery AMS 150 Sidescan Imagery<br />
July 17 th , 2006 MS Thesis Defense
Conclusions<br />
Study Goals<br />
• Identify <strong>the</strong> limitations <strong>of</strong> <strong>the</strong> multibeam sonar data<br />
set. <strong>Use</strong> <strong>the</strong> Nehalem Bank study site to address <strong>the</strong><br />
following questions:<br />
– 5m cell size resolution over <strong>the</strong> entire region, with ~ 2m<br />
cell size possible in shallow regions.<br />
• Questions addressed at beginning:<br />
– 1. Does <strong>the</strong> MBES data provide an accurate depiction <strong>of</strong><br />
<strong>the</strong> seafloor topography? What artifacts remain and<br />
propagate into <strong>the</strong> classified images and data layers?<br />
• The multibeam imagery provided a detailed view <strong>of</strong> <strong>the</strong><br />
landscape down to <strong>the</strong> Macroscale habitat features.<br />
• The artifacts that remain in <strong>the</strong> final image include nadir regions,<br />
swath overlap, turn artifacts.<br />
July 17 th , 2006 MS Thesis Defense
Conclusions<br />
Study Goals<br />
2. How do you assess <strong>the</strong> quality <strong>of</strong> a<br />
benthic classification attempt when<br />
groundtruthing information is at a<br />
different scale <strong>of</strong> observation?<br />
– Qualitative evaluation is possible<br />
– 3D GIS environment<br />
– Error matrices<br />
• can be used to iteratively evaluate<br />
<strong>the</strong> methods and results.<br />
– Limit <strong>the</strong> assessment to <strong>the</strong> areas<br />
where groundtruth information is<br />
available<br />
July 17 th , 2006 MS Thesis Defense
Future Implications and Research Directions<br />
For Sonar Image <strong>Classification</strong><br />
– Automated classification a possibility? Not yet.<br />
– Provided a method for <strong>the</strong> assessment <strong>of</strong> topographic accuracy that can<br />
be used on any multibeam data set.<br />
For Marine Resource Management<br />
– The presence <strong>of</strong> <strong>the</strong> Nehalem Bank topographic classification and<br />
bathymetric data set will play a large role in <strong>the</strong> future investigations in<br />
benthic ecology by dictating <strong>the</strong> locations where <strong>the</strong> fur<strong>the</strong>r exploration<br />
is needed.<br />
• Future investigations <strong>of</strong> EFH at a smaller scale is possible using <strong>the</strong> data<br />
sets produced from this study<br />
– Future Research Questions:<br />
• Where have <strong>the</strong> impacts <strong>of</strong> an activity like trawling been concentrated in<br />
<strong>the</strong> Nehalem Bank region?<br />
• Does <strong>the</strong> structural diversity <strong>of</strong> topographic habitats in <strong>the</strong> bank top region<br />
provide a natural refuge from those actions, and if so, what is <strong>the</strong> true<br />
population <strong>of</strong> fish in those areas?<br />
July 17 th , 2006 MS Thesis Defense
• Major Advisor: Chris Goldfinger<br />
• Committee Members: Dawn<br />
Wright, Waldo Wakefield, Skip<br />
Roechefort<br />
• Funding Agencies:<br />
NOAA NWFSC<br />
CIMRS<br />
NOAA Coastal Services Center<br />
• Active Tectonics and <strong>Seafloor</strong><br />
Mapping Crew<br />
• Fellow COAS students<br />
• My Family<br />
• Fiancé: Jessica Cardinal<br />
Acknowledgments<br />
July 17 th , 2006 MS Thesis Defense
Misc Info<br />
• Error Matrix Statistics<br />
July 17 th , 2006 MS Thesis Defense
Benthic <strong>Classification</strong><br />
Benthic habitat: is a seafloor region that can be characterized using <strong>the</strong> physical gradients <strong>of</strong> several<br />
variables, including depth, substrate, slope, roughness, and morphology, (may also include oceanographic<br />
factors such as temperature, salinity, nutrient flux, and biogenic content).<br />
Habitat <strong>Classification</strong> Schemes<br />
By Scale<br />
Using Nautical charts and existing<br />
geological maps (Greene, 2005)<br />
Towards Process<br />
An idealized scheme to reflect influence<br />
<strong>of</strong> environmental conditions (Valentine et<br />
al., 2004)<br />
Habitat classes were categorized into ei<strong>the</strong>r<br />
<strong>of</strong> four groups:<br />
• megahabitats (10’s <strong>of</strong> km’s – 1km)<br />
• mesohabitats (1km - 10’s <strong>of</strong> meters)<br />
• macrohabitats (10’s <strong>of</strong> meters to 1m)<br />
• microhabitats (1m to 1cm).<br />
A hierarchy <strong>of</strong> attributes can be associated<br />
with a single seafloor region<br />
Their scheme recognized <strong>the</strong> eight<br />
<strong>the</strong>mes <strong>of</strong>:<br />
– seabed topography<br />
– sediment dynamics<br />
– texture<br />
– grain size<br />
– Roughness<br />
– fauna and flora<br />
– habitat association and usage<br />
– habitat recovery from disturbance<br />
Those <strong>the</strong>mes are fur<strong>the</strong>r attributed by a<br />
sequence <strong>of</strong> modifiers that address habitat<br />
characteristics in increasing levels <strong>of</strong> detail<br />
July 17 th , 2006 MS Thesis Defense
Discussion<br />
Final <strong>Classification</strong> Scheme<br />
• Greene et al. (2005) scheme<br />
was chosen to define broad<br />
zones in <strong>the</strong> landscape.<br />
Based upon Mega-Habitat<br />
definitions.<br />
– Previous EFH maps use it<br />
– No process information is<br />
available (Valentine et al.,<br />
2004)<br />
• Intersect <strong>the</strong> fine scale<br />
structures delineated using <strong>the</strong><br />
BTM tool<br />
July 17 th , 2006 MS Thesis Defense
What are <strong>the</strong> benefits to classification <strong>of</strong> using a 3D perspective? Is it<br />
possible to quantitatively compare two different classifications <strong>of</strong> <strong>the</strong><br />
data using observations in a 3D environment?<br />
Can <strong>the</strong> texture <strong>of</strong> multibeam sonar backscatter imagery be used to<br />
classify homogeneous regions <strong>of</strong> substrate on <strong>the</strong> seafloor given <strong>the</strong><br />
Nehalem Bank data set and <strong>the</strong> available groundtruthing data<br />
sources?<br />
July 17 th , 2006 MS Thesis Defense
Study Goal<br />
3. What are <strong>the</strong> benefits to classification<br />
<strong>of</strong> using a 3D perspective? Is it<br />
possible to quantitatively compare two<br />
different classifications <strong>of</strong> <strong>the</strong> data<br />
using observations in a 3D<br />
environment?<br />
Conclusions<br />
Calculating error matrix statistics allows for<br />
<strong>the</strong> evaluation <strong>of</strong> each result individually,<br />
while also making it possible for comparison<br />
among different results.<br />
Dives were correctly placed in <strong>the</strong> landscape<br />
where <strong>the</strong>y could be used to guide <strong>the</strong><br />
textural classification <strong>of</strong> backscatter<br />
imagery.<br />
<strong>Use</strong> <strong>of</strong> <strong>the</strong> 3D environment helped to colocate<br />
different data sets on <strong>the</strong> bathymetry,<br />
while also providing an opportunity to<br />
perform quantitative assessments through <strong>the</strong><br />
use <strong>of</strong> error matrices.<br />
July 17 th , 2006 MS Thesis Defense
4. Can <strong>the</strong> texture <strong>of</strong> multibeam sonar<br />
backscatter imagery be used to classify<br />
homogeneous regions <strong>of</strong> substrate on <strong>the</strong><br />
seafloor given <strong>the</strong> Nehalem Bank data set<br />
and <strong>the</strong> avaailable groundtruthing data<br />
sources?<br />
– The presence <strong>of</strong> two sources <strong>of</strong><br />
imagery helped to evaluate what<br />
was actually being imaged in <strong>the</strong><br />
environment.<br />
Conclusions<br />
July 17 th , 2006 MS Thesis Defense