Spectral Classification of Stars
Spectral Classification of Stars
Spectral Classification of Stars

Create successful ePaper yourself
Turn your PDF publications into a flip-book with our unique Google optimized e-Paper software.
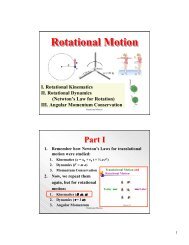
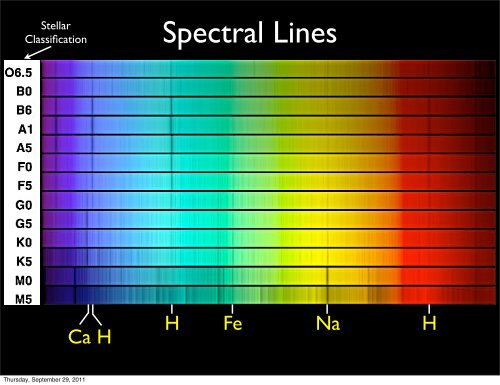
Stellar<br />
<strong>Classification</strong><br />
<strong>Spectral</strong> Lines<br />
H<br />
Fe<br />
Na<br />
H<br />
Ca<br />
H<br />
Thursday, September 29, 2011
<strong>Spectral</strong> <strong>Classification</strong> <strong>of</strong> <strong>Stars</strong><br />
Timeline:<br />
1890s<br />
Edward C. Pickering (1846-1919) and Williamina P. Fleming<br />
(1857-1911) label spectra alphabetically according to strength<br />
<strong>of</strong> Hydrogen (Balmer) lines, beginning with “A” (strongest).<br />
1890s<br />
Antonia Maury (1866-1952) developed a classification scheme based on<br />
the “width” <strong>of</strong> spectral lines. Would place “B” stars before “A” stars.<br />
1901<br />
Annie Cannon (1863-1941), brilliantly combined the above.<br />
Rearranged sequence, O before B before A, added decimal<br />
divisions (A0...A9) and consolidated classes. Led to<br />
classification scheme still used by astronomers today!<br />
OBAFGKM (Oh Be A Fine Guy/Girl, Kiss Me)<br />
“Early Type”<br />
<strong>Stars</strong><br />
“Late Type”<br />
<strong>Stars</strong><br />
Thursday, September 29, 2011
Timeline:<br />
<strong>Spectral</strong> <strong>Classification</strong> <strong>of</strong> <strong>Stars</strong><br />
1901<br />
Annie Cannon (1863-1941), brilliantly combined the above.<br />
Rearranged sequence, O before B before A, added decimal<br />
divisions (A0...A9) and consolidated classes. Led to<br />
classification scheme still used by astronomers today!<br />
OBAFGKM (Oh Be A Fine Guy/Girl, Kiss Me)<br />
“Early Type” <strong>Stars</strong> : <strong>Stars</strong> near the beginning<br />
<strong>of</strong> Sequence<br />
“Late Type” <strong>Stars</strong> : <strong>Stars</strong> near the end <strong>of</strong><br />
the Sequence.<br />
One can mix the definitions: K0 star is an “early-type” K star. B9 is a “late-type” B star.<br />
1911-1914<br />
During 1990s<br />
Annie Cannon classified 200,000 spectra, listed in the Henry Draper Catalog.<br />
Catalog ID’s are “HD 39801” (ID for Betelgeuse in the constellation Orion).<br />
Two new letters added to Sequence for very cool, Brown-Dwarf stars.<br />
“L” spectral types (T=1300-2500 K) and “T” types (T < 1300 K).<br />
OBAFGKMLT (Oh Be A Fine Guy/Girl, Kiss Me - Less Talk !)<br />
Thursday, September 29, 2011
<strong>Spectral</strong> <strong>Classification</strong> <strong>of</strong> <strong>Stars</strong><br />
Hotter<br />
Cooler<br />
<strong>Spectral</strong> Type<br />
O<br />
B<br />
A<br />
F<br />
G<br />
K<br />
M<br />
L<br />
T<br />
Characteristics<br />
Hottest blue-white stars, few lines. Strong He II (He + ) absorption<br />
lines. He I (neutral helium) stronger).<br />
Hot blue-white. He I (neutral Helium), strongest at B2.<br />
H I (neutral Hydrogen) stronger.<br />
White stars. Balmer absorption lines strongest at A0 (Vega),<br />
weaker in later-type A stars. Strong Ca II (Ca + ) lines.<br />
Yellow-white stars. Ca II lines strengthen to later types. F-stars.<br />
Balmer lines strengthen to earlier type F-stars.<br />
Yellow stars (Sun is a G5 star). Ca II lines become stronger. Fe I<br />
(neutral iron) lines become strong.<br />
Cool orange stars. Ca II (H and K) lines strongest at K0, becoming<br />
weaker in later stars. Spectra dominated by metal absorption lines.<br />
Cool red stars. Spectra dominated by molecular absorption bands,<br />
e.g., TiO (titanium oxide). Neutral metal lines strong.<br />
Very cool, dark red (brown dwarfs). Brighter in Infrared than<br />
visible. Strong molecular absorption bands, e.g., CrH, FeH, water,<br />
CO. TiO weakening.<br />
Coolest stars. Strong methane (CH4), weakening CO bands.<br />
Thursday, September 29, 2011
Thursday, September 29, 2011<br />
<strong>Spectral</strong> <strong>Classification</strong> <strong>of</strong> <strong>Stars</strong>
Thursday, September 29, 2011<br />
<strong>Spectral</strong> <strong>Classification</strong> <strong>of</strong> <strong>Stars</strong>
Thursday, September 29, 2011<br />
<strong>Spectral</strong> <strong>Classification</strong> <strong>of</strong> <strong>Stars</strong>
Thursday, September 29, 2011<br />
<strong>Spectral</strong> <strong>Classification</strong> <strong>of</strong> <strong>Stars</strong>
Thursday, September 29, 2011<br />
<strong>Spectral</strong> <strong>Classification</strong> <strong>of</strong> <strong>Stars</strong>
<strong>Spectral</strong> <strong>Classification</strong> <strong>of</strong> <strong>Stars</strong><br />
Physical Description<br />
Hydrogen when T < 9900 K<br />
Majority <strong>of</strong> electrons in<br />
ground state, n=1<br />
Hydrogen when T = 9900 K<br />
Majority <strong>of</strong> electrons in first excited, n=2 state,<br />
and capable <strong>of</strong> producing Balmer lines<br />
Hydrogen when T > 9900 K<br />
Majority <strong>of</strong> electrons unbound,<br />
ionized hydrogen.<br />
Thursday, September 29, 2011
<strong>Spectral</strong> <strong>Classification</strong> <strong>of</strong> <strong>Stars</strong><br />
Physical Description<br />
<strong>Stars</strong> are not composed <strong>of</strong> pure hydrogen, but<br />
nearly all atoms (mostly H, He, and metals =<br />
anything not H or He).<br />
Typically 1 He atom for every 10 H atoms<br />
(and even fewer metals).<br />
Helium (and metals) provide more electrons,<br />
which can recombine with ionized H.<br />
So, it takes higher temperatures to achieve<br />
same degree <strong>of</strong> H ionization when He and<br />
metals are present.<br />
Abundance is = log10(Nelement/NH) + 12.<br />
I.e., Abudance <strong>of</strong> Oxygen = 8.83, which means:<br />
8.83 = log10(NO/NH) + 12<br />
NO/NH = 10 8.83 - 12 = 0.000676 ≈1/1480<br />
There is one Oxygen atom<br />
for every 1480 H atoms !<br />
Most Abundant Elements in the Solar Photosphere.<br />
Element Atomic # Log Relative Abundance<br />
H 1 12.00<br />
He 2 10.93 ± 0.004<br />
O 8 8.83 ± 0.06<br />
C 6 8.52 ± 0.06<br />
Ne 10 8.08 ± 0.06<br />
N 7 7.92 ± 0.06<br />
Mg 12 7.58 ± 0.05<br />
Si 14 7.55 ± 0.05<br />
Fe 26 7.50 ± 0.05<br />
S 16 7.33 ± 0.11<br />
Al 13 6.47 ± 0.07<br />
Ar 18 6.40 ± 0.06<br />
Ca 20 6.36 ± 0.02<br />
Ng 11 6.33 ± 0.03<br />
Ni 28 6.25 ± 0.04<br />
Thursday, September 29, 2011
<strong>Spectral</strong> <strong>Classification</strong> <strong>of</strong> <strong>Stars</strong><br />
Physical Description<br />
In 1925, Cecilia Payne (1900-1979) calculate the relative abundances <strong>of</strong> 18 elements in<br />
stellar atmospheres (one <strong>of</strong> the most brilliant PhD theses ever in astronomy).<br />
Thursday, September 29, 2011
Thursday, September 29, 2011
<strong>Spectral</strong> <strong>Classification</strong> <strong>of</strong> <strong>Stars</strong><br />
Hertzsprung-Russell Diagram<br />
How would you measure a star’s mass ?<br />
Thursday, September 29, 2011
<strong>Spectral</strong> <strong>Classification</strong> <strong>of</strong> <strong>Stars</strong><br />
Hertzsprung-Russell Diagram<br />
How would you measure a star’s mass ?<br />
Answer: Kepler’s Laws. Works well for binary stars.<br />
m1<br />
r1<br />
+<br />
=<br />
r2<br />
m2<br />
R =<br />
m1r1 + m2r2<br />
m1 + m2<br />
= 0<br />
m1<br />
m2<br />
r2<br />
= =<br />
r1<br />
a2<br />
a1<br />
Thursday, September 29, 2011
Animations <strong>of</strong> binary <strong>Stars</strong>:<br />
http://astro.ph.unimelb.edu.au/s<strong>of</strong>tware/binary/binary.htm<br />
http://abyss.uoregon.edu/~js/applets/eclipse/eclipse.htm<br />
Thursday, September 29, 2011
Binary <strong>Stars</strong><br />
Term binary was first used by<br />
Sir Williams Herschel in 1802.<br />
"If, on the contrary, two stars should really be situated very near each<br />
other, and at the same time so far insulated as not to be materially<br />
affected by the attractions <strong>of</strong> neighbouring stars, they will then compose<br />
a separate system, and remain united by the bond <strong>of</strong> their own mutual<br />
gravitation towards each other. This should be called a real double star;<br />
and any two stars that are thus mutually connected, form the binary<br />
sidereal system which we are now to consider."<br />
Thursday, September 29, 2011
Binary <strong>Stars</strong><br />
Two <strong>Stars</strong> in Albireo<br />
system.<br />
Thursday, September 29, 2011
Binary <strong>Stars</strong><br />
Sirius A<br />
brightest star in the sky<br />
m = -1.46.<br />
In 1844, Friedrich Bessel deduced<br />
it was a binary.<br />
In 1862 Alvan Graham Clark<br />
discovered the companion.<br />
Sirius B<br />
m = 8.30<br />
Thursday, September 29, 2011
<strong>Spectral</strong> <strong>Classification</strong> <strong>of</strong> <strong>Stars</strong><br />
Hertzsprung-Russell Diagram<br />
How would you measure a star’s mass ?<br />
angle <strong>of</strong> inclination<br />
For circular orbits, v1 = 2πa1/P<br />
m1<br />
=<br />
v2<br />
Plane <strong>of</strong> Sky<br />
Orbital Plane<br />
m2<br />
m2<br />
Determine radial component <strong>of</strong> velocities,<br />
vr, using doppler-shifted spectral lines.<br />
v1r=v1 sin(i) & v2r=v2 sin(i)<br />
v1<br />
To Earth<br />
m1<br />
m2<br />
=<br />
v2r / sin(i)<br />
v1r / sin(i)<br />
=<br />
v2r<br />
v1r<br />
Therefore, we can determine the mass ratio<br />
without knowing the angle <strong>of</strong> inclination !<br />
m1<br />
Thursday, September 29, 2011
<strong>Spectral</strong> <strong>Classification</strong> <strong>of</strong> <strong>Stars</strong><br />
Hertzsprung-Russell Diagram<br />
How would you measure a star’s mass ?<br />
Need one other equation to relate m1 and m2. Comes from Kepler’s 3rd law, replace a = a1 + a2<br />
a = a1 + a2 = (P/2π) v1 + (P/2π)v2 = (P/2π) (v1+v2)<br />
Kepler’s 3rd law, (P 2 = 4π 2 a 3 / GM ), becomes<br />
m1 + m2 = (P/2πG) (v1+v2) 3<br />
Substituting v1 = v1r /sin(i), the angle <strong>of</strong> inclination.<br />
m1 + m2 = (P/2πG) (v 1r+v2r) 3<br />
sin 3 (i)<br />
Thursday, September 29, 2011
<strong>Spectral</strong> <strong>Classification</strong> <strong>of</strong> <strong>Stars</strong><br />
Hertzsprung-Russell Diagram<br />
How would you measure a star’s mass ?<br />
Combine our two formula:<br />
m1<br />
m2<br />
=<br />
v2r / sin(i)<br />
v1r / sin(i)<br />
=<br />
v2r<br />
v1r<br />
m1 + m2 = (P/2πG) (v 1r+v2r) 3<br />
sin 3 (i)<br />
To get (rearranging terms):<br />
m2 3<br />
(m1 + m2) 2 sin 3 (i)<br />
P<br />
=<br />
2πG<br />
v1r 3<br />
This is the mass function, depends only on the period, P, and radial<br />
velocity, v1r. In practice, only a spectrum for one star in binary pair is<br />
available. Mass function sets a lower limit on m2. In rare cases <strong>of</strong> eclipsing<br />
spectroscopic binaries, i ≈90 o and both masses can be measured directly.<br />
Thursday, September 29, 2011
Eclipsing Binaries:<br />
http://www.astro.cornell.edu/academics/courses/astro101/herter/<br />
java/eclipse/eclipse.htm<br />
Thursday, September 29, 2011
Thursday, September 29, 2011<br />
<strong>Spectral</strong> <strong>Classification</strong> <strong>of</strong> <strong>Stars</strong><br />
Mass-Luminosity relation
<strong>Spectral</strong> <strong>Classification</strong> <strong>of</strong> <strong>Stars</strong><br />
Hertzsprung-Russell Diagram<br />
This is the Hertzprung-<br />
Russell (HR) diagram, which<br />
is a stellar classification<br />
system developed by Ejnar<br />
Hertzprung and Henry<br />
Norris Russel in Denmark<br />
around 1910.<br />
Ejnar Hertzsprung<br />
Henry Norris Russell<br />
The HR diagram relates the<br />
magnitudes and colors <strong>of</strong><br />
stars as a function <strong>of</strong> their<br />
temperature and luminosity.<br />
Thursday, September 29, 2011
Henry Norris Russell’s<br />
first diagram<br />
Thursday, September 29, 2011
<strong>Spectral</strong> <strong>Classification</strong> <strong>of</strong> <strong>Stars</strong><br />
Enormous Range in Stellar Radii !<br />
If stars cool over time as they contract, there should be a<br />
relation between their temperatures and luminosities.<br />
R =<br />
1<br />
T 2<br />
√<br />
L<br />
4πσ<br />
Hertzsprung (1873-1967) found that stars <strong>of</strong> Late type<br />
(G and later) have a large range in luminosity. If two<br />
stars <strong>of</strong> the same spectral type (same Temperature)<br />
then more luminous star is larger.<br />
Giants: <strong>Stars</strong> with big radii & Dwarfs: <strong>Stars</strong> with small radii.<br />
Our Sun is a G5 dwarf.<br />
Similar Conclusions reached by Henry Russell (1877-1957)<br />
Thursday, September 29, 2011
Thursday, September 29, 2011<br />
<strong>Spectral</strong> <strong>Classification</strong> <strong>of</strong> <strong>Stars</strong><br />
Hertzsprung-Russell Diagram
Thursday, September 29, 2011<br />
<strong>Spectral</strong> <strong>Classification</strong> <strong>of</strong> <strong>Stars</strong><br />
Hertzsprung-Russell Diagram
Brighter<br />
30,000 K 10,000 K 7500 K 6000 K 5000 K 4000 K 3000 K<br />
Luminosity<br />
Text<br />
HR diagram where data points<br />
show measurements from<br />
22,000 real stars from the<br />
Hipparcos satellite.<br />
(Lines are Theoretical,<br />
expected luminosities and<br />
temperatures <strong>of</strong> stars)<br />
Temperature: Hotter<br />
Color Index: B-V<br />
Thursday, September 29, 2011
Brighter<br />
HR diagram<br />
Absolute Magnitude (M)<br />
(Luminosity)<br />
<strong>Spectral</strong><br />
Type<br />
Hotter<br />
Temperature (Color, B-V)<br />
Thursday, September 29, 2011