CORROSION RESISTANCE OF HASTEllOY®AllOYS - Haynes ...
CORROSION RESISTANCE OF HASTEllOY®AllOYS - Haynes ...
CORROSION RESISTANCE OF HASTEllOY®AllOYS - Haynes ...

Create successful ePaper yourself
Turn your PDF publications into a flip-book with our unique Google optimized e-Paper software.
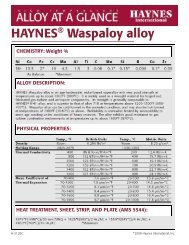
ISO<strong>CORROSION</strong> DIAGRAMS*<br />
HASTELLOY® Alloy G-30<br />
Resistance to Phosphoric Acid<br />
(<br />
Corrosion rates in parentheses are in mm/year.<br />
g Region of corrosion rate instability.<br />
(0.5)<br />
20 mpy 150<br />
(<br />
LL<br />
cj 250<br />
w<br />
o<br />
W<br />
0:<br />
~ 200<br />
«<br />
0:<br />
w<br />
Q...<br />
~<br />
~ 150<br />
Boiling Point Curve<br />
u<br />
cj<br />
w<br />
0<br />
W<br />
100 0:<br />
I-<br />
:::::><br />
«<br />
0:<br />
w<br />
Q...<br />
~<br />
w<br />
I-<br />
50<br />
100<br />
o<br />
10<br />
20<br />
30<br />
40<br />
50<br />
60<br />
70<br />
80<br />
CONCENTRATION, WEIGHT PERCENT<br />
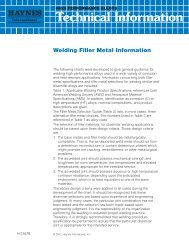
Comparison of HASTELLOY®<br />
Alloy G-30 and Alloy 625<br />
in Commercial Phosphoric Acid*<br />
<strong>CORROSION</strong> RATE IN MM/YEAR<br />
0.25 2.5<br />
25<br />
250<br />
0 0<br />
10.0 6<br />
5.0<br />
a<br />
c;><br />
(')<br />
.......<br />
L{)<br />
C\J<br />
CD<br />
(f)<br />
I<br />
W<br />
«<br />
.0:<br />
Z<br />
o<br />
(jj<br />
o<br />
0:<br />
0:<br />
o<br />
U<br />
LL<br />
o<br />
4.0 0 0<br />
cP6<br />
3.0 0<br />
00<br />
0<br />
2.0<br />
60<br />
Cb<br />
1.0<br />
OP 2 0 S<br />
t<br />
6 P 2 0 S + 2000 ppm CIo<br />
P 2 0 S + 0.5% HF<br />
o<br />
f=«0:<br />
1.0 10 100 1000 10,000<br />
0.8<br />
0.7<br />
<strong>CORROSION</strong> RATE <strong>OF</strong> ALLOY 625 (MPY)<br />
The corrosion resistance of HASTELLOY alloy G-30 in a variety of environments is shown in this<br />
charI. The corrosivity of commercial phosphoric acid is a result of several variables such as<br />
concentration, temperature, impurity levels (manufacturer) and origin of the phosphate rock. Wide<br />
variations in corrosion rates are possible in acids of the same concentration but from different<br />
sources. Hence, corrosion tests were conducted in acids from a number of suppliers and the<br />
performance of alloy G-30 relative to alloy 625 is shown as a function of the corrosion rate of alloy<br />
625. Within certain severity of the acid, alloy G-30 shows 2-3 times better corrosion resistance than<br />
alloy No. 625. In acids of high severity all the alloys exhibit corrosion rates in excess of 2.5mm/yr<br />
(100 mpy).<br />
•All test specimens were solution heat-treated and in the unwelded condition.<br />
73