Understanding Alcohol: Investigations into Biology and Behavior
Understanding Alcohol: Investigations into Biology and Behavior
Understanding Alcohol: Investigations into Biology and Behavior

Create successful ePaper yourself
Turn your PDF publications into a flip-book with our unique Google optimized e-Paper software.
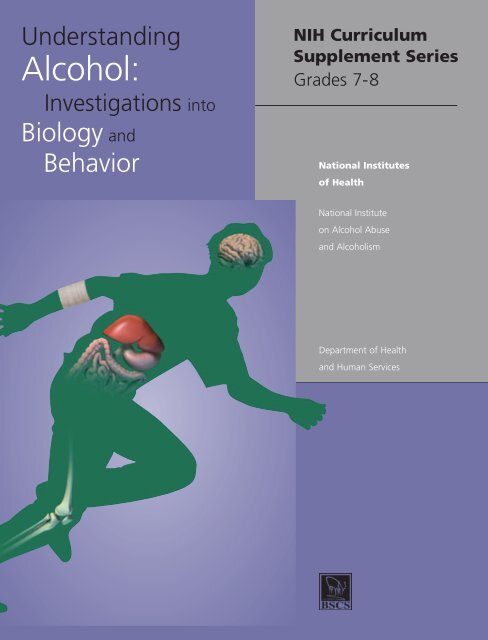
<strong>Underst<strong>and</strong>ing</strong><br />
<strong>Alcohol</strong>:<br />
<strong>Investigations</strong> <strong>into</strong><br />
<strong>Biology</strong> <strong>and</strong><br />
<strong>Behavior</strong><br />
NIH Curriculum<br />
Supplement Series<br />
Grades 7-8<br />
National Institutes<br />
of Health<br />
National Institute<br />
on <strong>Alcohol</strong> Abuse<br />
<strong>and</strong> <strong>Alcohol</strong>ism<br />
Department of Health<br />
<strong>and</strong> Human Services
<strong>Underst<strong>and</strong>ing</strong> <strong>Alcohol</strong>:<br />
<strong>Investigations</strong> <strong>into</strong><br />
<strong>Biology</strong> <strong>and</strong> <strong>Behavior</strong><br />
under a contract from the<br />
National Institutes of Health<br />
National Institute on <strong>Alcohol</strong> Abuse <strong>and</strong> <strong>Alcohol</strong>ism<br />
5415 Mark Dabling Boulevard<br />
Colorado Springs, Colorado 80918
BSCS Development Team<br />
Rodger W. Bybee, Principal Investigator<br />
Mark V. Bloom, Project Director<br />
Jerry Phillips, Senior Curriculum Developer<br />
Anne L. Westbrook, Curriculum Developer<br />
Lynda B. Micikas, Curriculum Developer<br />
Sharmila Basu, Curriculum Developer<br />
Sherry Herron, Curriculum Developer<br />
Wendy Haggren, Curriculum Developer<br />
Carrie Z<strong>and</strong>er, Project Assistant<br />
Diane Conrad, Project Assistant<br />
Raphaela Conner, Project Assistant<br />
Doug Coulson, Evaluator<br />
Ann Lanari, Research Assistant<br />
Barbara Perrin, Production Manager<br />
Ric Bascobert, Editor<br />
Barbara Resch, Editor<br />
Diane Gionfriddo, Photo Research<br />
Lisa Rasmussen, Graphic Designer <strong>and</strong> Illustrator<br />
Stacey Luce, Production Specialist<br />
Angela Barnes, Typesetting<br />
BSCS Administrative Staff<br />
Carlo Parravano, Chair, Board of Directors<br />
Rodger W. Bybee, Executive Director<br />
Janet Carlson Powell, Associate Director, Chief Science Education<br />
Officer<br />
Larry Satkowiak, Associate Director, Chief Operating Officer<br />
Pamela Van Scotter, Director, Curriculum Development Division<br />
National Institutes of Health<br />
Dorothea E. deZafra, Science Education Program Manager, National<br />
Institute on <strong>Alcohol</strong> Abuse <strong>and</strong> <strong>Alcohol</strong>ism (NIAAA)<br />
Roger W. Hartman, Public Health Analyst, NIAAA<br />
Jason Lazarow, Science Education Coordinator, NIAAA<br />
Bruce Fuchs, Director, Office of Science Education<br />
William Mowczko, Project Officer, Office of Science Education<br />
Bonnie Kalberer, Senior Program Analyst, Office of Science Education<br />
Cindy Allen, Editor, Office of Science Education<br />
Mary Dufour, Deputy Director, NIAAA<br />
Brenda Hewitt, Special Assistant to Director, NIAAA<br />
William L<strong>and</strong>s, Senior Scientific Advisor, NIAAA<br />
Outside Reviewer<br />
Mary E. McCaul, Professor, Department of Psychiatry <strong>and</strong> <strong>Behavior</strong>al<br />
Sciences, Johns Hopkins University School of Medicine<br />
Advisory Committee<br />
V. Gene Erwin, University of Colorado <strong>Alcohol</strong> Research Center,<br />
Boulder, Colorado<br />
Jeff Marshall, Irving Middle School, Colorado Springs, Colorado<br />
Marcia Rubin, American School Health Association, Kent, Ohio<br />
Robert Voas, Pacific Institute for Research <strong>and</strong> Evaluation, Calverton,<br />
Maryl<strong>and</strong><br />
Robert A. Zucker, University of Michigan <strong>Alcohol</strong> Research Center,<br />
Ann Arbor, Michigan<br />
Writing Team<br />
William Boggan, Center for Drug <strong>and</strong> <strong>Alcohol</strong> Programs, Medical<br />
University of South Carolina, Charleston, South Carolina<br />
Ed Drexler, Pius XI High School, Milwaukee, Wisconsin<br />
V. Gene Erwin, University of Colorado <strong>Alcohol</strong> Research Center,<br />
Boulder, Colorado<br />
Jeff Marshall, Irving Middle School, Colorado Springs, Colorado<br />
Greg Nichols, New Options Middle School, Seattle, Washington<br />
John Olney, Washington University, St. Louis, Missouri<br />
Field-Test Teachers<br />
Cassie Cox, Moundsville Junior High School, Moundsville, West<br />
Virginia<br />
Claireen Espinoza, Taos Day School, Taos, New Mexico<br />
Joel Maier, New Options Middle School, Seattle, Washington<br />
Marguerite Nunnally, Woodward Academy Middle School, College<br />
Park, Georgia<br />
Samantha Douglass, Woodward Academy Middle School, College<br />
Park, Georgia<br />
Nichole Law, Woodward Academy Middle School, College Park,<br />
Georgia<br />
Anne O’Connell, Woodward Academy Middle School, College Park,<br />
Georgia<br />
Edge Interactive Staff<br />
Terry Wallace, Senior Project Manager<br />
Liz Bernel, Senior Instructional Designer<br />
George Rosales, Art Director<br />
Bill Bolduc, Software Development Manager<br />
Mark Stevens, Multimedia Engineer<br />
Greg Banse, Multimedia Engineer<br />
SAIC Staff<br />
Bach Nguyen, Project Manager<br />
Steve Larson, Web Director<br />
Doug Green, Project Lead<br />
Tommy D’Aquino, Multimedia Director<br />
Paul Ayers, Multimedia Developer<br />
John James, Multimedia Developer<br />
Jeff Ludden, Multimedia Programmer<br />
Dave Nevins, Audio Engineer<br />
Chris Green, 3D Animator<br />
Aaron Bell, 3D Animator<br />
Craig Weaver, Video Producer<br />
Jessica Butter, Senior Web Developer<br />
Katie Riley, Web Developer<br />
Voice-Over<br />
Dave Nevins<br />
Cover Design<br />
Karen Cook, Medical Arts <strong>and</strong> Photography Branch, National<br />
Institutes of Health<br />
Cover Illustration<br />
Salvador Bru, Medical Arts <strong>and</strong> Photography Branch, National<br />
Institutes of Health<br />
FIGURE CREDITS<br />
Teacher Background<br />
1, 2, 13: Corel; 3, 7: PhotoDisc; 9, 10, 11, 12: Courtesy of National<br />
Institute on Drug Abuse; 14: U.S. Department of Health <strong>and</strong> Human<br />
Services. 1997. Tenth Special Report to the U.S. Congress on <strong>Alcohol</strong><br />
<strong>and</strong> Health (pp. 1–66). Bethesda, MD: National Institute on <strong>Alcohol</strong><br />
Abuse <strong>and</strong> <strong>Alcohol</strong>ism; 15: © Draeger Safety, Inc. – Breathalyzer®<br />
Division.<br />
Lesson 1<br />
1.2, 1.3c: PhotoDisc; 1.3a: Digital Stock; 1.3b: Comstock.<br />
Lesson 2<br />
2.1: PhotoDisc.<br />
Lesson 3<br />
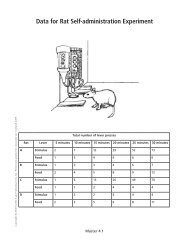
Master 3.1, Master 3.4, Master 3.8: SAIC.<br />
Lesson 4<br />
4.1: Comstock.<br />
Lesson 5<br />
Master 5.1: Tables are adapted from those of the National Clearinghouse<br />
for <strong>Alcohol</strong> <strong>and</strong> Drug Information.<br />
Lesson 6<br />
6.1: PhotoDisc; Master 6.2 (graph): Zador, P., Krawchuk, S.A., <strong>and</strong><br />
Voas, R.B. 2000. <strong>Alcohol</strong>-related relative risk of driver fatalities <strong>and</strong><br />
driver involvement in fatal crashes in relation to driver age <strong>and</strong> gender:<br />
An update using 1996 data. Journal of Studies on <strong>Alcohol</strong>, 61:<br />
387–395; Master 6.2 (pie chart): U.S. Department of Health <strong>and</strong><br />
Human Services. 1997. Tenth Special Report to the U.S. Congress on<br />
<strong>Alcohol</strong> <strong>and</strong> Health (pp. 1–66). Bethesda, MD: National Institute on<br />
<strong>Alcohol</strong> Abuse <strong>and</strong> <strong>Alcohol</strong>ism.<br />
This material is based on work supported by the National Institutes<br />
of Health under Contract No. 263-99-C-0031. Any opinions, findings,<br />
conclusions, or recommendations expressed in this publication<br />
are those of the authors <strong>and</strong> do not necessarily reflect the view of<br />
the funding agency.<br />
Copyright © 2003 by BSCS. All rights reserved. You have the permission<br />
of BSCS to reproduce items in this module for your classroom<br />
use. The copyright on this module, however, does not cover<br />
reproduction of these items for any other use. For permissions <strong>and</strong><br />
other rights under this copyright, please contact BSCS, 5415 Mark<br />
Dabling Blvd., Colorado Springs, CO 80918-3842; www.bscs.org;<br />
info@bscs.org; (719) 531-5550.<br />
NIH Publication No. 04-4991<br />
ISBN: 1-929614-09-8
Contents<br />
Foreword . . . . . . . . . . . . . . . . . . . . . . . . . . . . . . . . . . . . . . . . . . . . . . . . . . . . . . . . . . . . . . . . . . . . . . . v<br />
About the National Institutes of Health . . . . . . . . . . . . . . . . . . . . . . . . . . . . . . . . . . . . . . . . . . . . . . . vii<br />
About the National Institute on <strong>Alcohol</strong> Abuse <strong>and</strong> <strong>Alcohol</strong>ism . . . . . . . . . . . . . . . . . . . . . . . . . . . . ix<br />
Introduction to <strong>Underst<strong>and</strong>ing</strong> <strong>Alcohol</strong>: <strong>Investigations</strong> <strong>into</strong> <strong>Biology</strong> <strong>and</strong> <strong>Behavior</strong> . . . . . . . . . . . . . . . . . 1<br />
• What Are the Objectives of the Module?<br />
• Why Teach the Module?<br />
• What’s in It for the Teacher?<br />
Implementing the Module . . . . . . . . . . . . . . . . . . . . . . . . . . . . . . . . . . . . . . . . . . . . . . . . . . . . . . . . . . 5<br />
• What Are the Goals of the Module?<br />
• What Are the Science Concepts <strong>and</strong> How Are They Connected?<br />
• How Does the Module Correlate to the National Science Education St<strong>and</strong>ards?<br />
– Content St<strong>and</strong>ards: Grades 5–8<br />
– Teaching St<strong>and</strong>ards<br />
– Assessment St<strong>and</strong>ards<br />
• How Does the 5E Instructional Model Promote Active, Collaborative, Inquiry-Based Learning?<br />
– Engage<br />
– Explore<br />
– Explain<br />
– Elaborate<br />
– Evaluate<br />
• How Does the Module Support Ongoing Assessment?<br />
• How Can Teachers Promote Safety in the Science Classroom?<br />
• How Can Controversial Topics Be H<strong>and</strong>led in the Classroom?<br />
Using the Student Lessons . . . . . . . . . . . . . . . . . . . . . . . . . . . . . . . . . . . . . . . . . . . . . . . . . . . . . . . . 17<br />
• Format of the Lessons<br />
• Timeline for the Module<br />
Using the Web Site . . . . . . . . . . . . . . . . . . . . . . . . . . . . . . . . . . . . . . . . . . . . . . . . . . . . . . . . . . . . . . 19<br />
• Hardware/Software Requirements<br />
• Getting the Most out of the Web Site<br />
• Collaborative Groups<br />
• Web Activities for Students with Disabilities<br />
Information about <strong>Alcohol</strong> . . . . . . . . . . . . . . . . . . . . . . . . . . . . . . . . . . . . . . . . . . . . . . . . . . . . . . . . 23<br />
1 Introduction . . . . . . . . . . . . . . . . . . . . . . . . . . . . . . . . . . . . . . . . . . . . . . . . . . . . . . . . . . . . . . .23<br />
2 <strong>Alcohol</strong> Use, Abuse, <strong>and</strong> <strong>Alcohol</strong>ism: Definitions . . . . . . . . . . . . . . . . . . . . . . . . . . . . . . . . . . 24<br />
3 Misconceptions about <strong>Alcohol</strong> Use, Abuse, <strong>and</strong> <strong>Alcohol</strong>ism . . . . . . . . . . . . . . . . . . . . . . . . . . 25<br />
4 Animals as Research Models . . . . . . . . . . . . . . . . . . . . . . . . . . . . . . . . . . . . . . . . . . . . . . . . . . 27<br />
5 <strong>Alcohol</strong>: Pharmacokinetics . . . . . . . . . . . . . . . . . . . . . . . . . . . . . . . . . . . . . . . . . . . . . . . . . . . . 28<br />
5.1 Absorption <strong>and</strong> distribution of alcohol in the body . . . . . . . . . . . . . . . . . . . . . . . . . . 29<br />
5.2 Measurement of blood alcohol concentration (BAC) . . . . . . . . . . . . . . . . . . . . . . . . . 29
5.3 Factors affecting alcohol absorption <strong>and</strong> elimination . . . . . . . . . . . . . . . . . . . . . . . . . 29<br />
5.4 <strong>Alcohol</strong> metabolism . . . . . . . . . . . . . . . . . . . . . . . . . . . . . . . . . . . . . . . . . . . . . . . . . . 30<br />
6 <strong>Alcohol</strong>: Biological Effects . . . . . . . . . . . . . . . . . . . . . . . . . . . . . . . . . . . . . . . . . . . . . . . . . . . . 31<br />
6.1 <strong>Alcohol</strong> <strong>and</strong> the brain . . . . . . . . . . . . . . . . . . . . . . . . . . . . . . . . . . . . . . . . . . . . . . . . 31<br />
6.2 <strong>Alcohol</strong> <strong>and</strong> body systems . . . . . . . . . . . . . . . . . . . . . . . . . . . . . . . . . . . . . . . . . . . . . 35<br />
7 <strong>Alcohol</strong>: <strong>Behavior</strong>al Effects . . . . . . . . . . . . . . . . . . . . . . . . . . . . . . . . . . . . . . . . . . . . . . . . . . . 37<br />
8 <strong>Alcohol</strong>ism . . . . . . . . . . . . . . . . . . . . . . . . . . . . . . . . . . . . . . . . . . . . . . . . . . . . . . . . . . . . . . . . 39<br />
8.1 Signs of a problem . . . . . . . . . . . . . . . . . . . . . . . . . . . . . . . . . . . . . . . . . . . . . . . . . . . 39<br />
8.2 <strong>Alcohol</strong>ism <strong>and</strong> genetics . . . . . . . . . . . . . . . . . . . . . . . . . . . . . . . . . . . . . . . . . . . . . . 39<br />
8.3 <strong>Alcohol</strong>ism treatments . . . . . . . . . . . . . . . . . . . . . . . . . . . . . . . . . . . . . . . . . . . . . . . . 40<br />
9 <strong>Alcohol</strong> <strong>and</strong> Youth . . . . . . . . . . . . . . . . . . . . . . . . . . . . . . . . . . . . . . . . . . . . . . . . . . . . . . . . . . 41<br />
10 Consequences of <strong>Alcohol</strong> Abuse <strong>and</strong> <strong>Alcohol</strong>ism . . . . . . . . . . . . . . . . . . . . . . . . . . . . . . . . . . 42<br />
10.1 The costs to society . . . . . . . . . . . . . . . . . . . . . . . . . . . . . . . . . . . . . . . . . . . . . . . . . . 42<br />
10.2 Drinking <strong>and</strong> driving . . . . . . . . . . . . . . . . . . . . . . . . . . . . . . . . . . . . . . . . . . . . . . . . . 42<br />
10.3 Drinking <strong>and</strong> risky behavior . . . . . . . . . . . . . . . . . . . . . . . . . . . . . . . . . . . . . . . . . . . 43<br />
10.4 Drinking <strong>and</strong> pregnancy . . . . . . . . . . . . . . . . . . . . . . . . . . . . . . . . . . . . . . . . . . . . . . 44<br />
10.5 Drinking <strong>and</strong> violence . . . . . . . . . . . . . . . . . . . . . . . . . . . . . . . . . . . . . . . . . . . . . . . . 45<br />
Glossary . . . . . . . . . . . . . . . . . . . . . . . . . . . . . . . . . . . . . . . . . . . . . . . . . . . . . . . . . . . . . . . . . . . . . . 47<br />
References . . . . . . . . . . . . . . . . . . . . . . . . . . . . . . . . . . . . . . . . . . . . . . . . . . . . . . . . . . . . . . . . . . . . . 53<br />
Student Lessons<br />
• Lesson 1<br />
<strong>Alcohol</strong>: Separating Fact from Fiction . . . . . . . . . . . . . . . . . . . . . . . . . . . . . . . . . . . . . . . . . . 57<br />
• Lesson 2<br />
A Drink Is a Drink, but People Are Different . . . . . . . . . . . . . . . . . . . . . . . . . . . . . . . . . . . . . 69<br />
• Lesson 3<br />
Responding to <strong>Alcohol</strong>: What’s Important? . . . . . . . . . . . . . . . . . . . . . . . . . . . . . . . . . . . . . . . 87<br />
• Lesson 4<br />
<strong>Alcohol</strong> Use, Abuse, <strong>and</strong> <strong>Alcohol</strong>ism . . . . . . . . . . . . . . . . . . . . . . . . . . . . . . . . . . . . . . . . . . 117<br />
• Lesson 5<br />
<strong>Alcohol</strong> <strong>and</strong> Driving: When to Say No . . . . . . . . . . . . . . . . . . . . . . . . . . . . . . . . . . . . . . . . . 149<br />
• Lesson 6<br />
Using <strong>Alcohol</strong>: Setting Limits . . . . . . . . . . . . . . . . . . . . . . . . . . . . . . . . . . . . . . . . . . . . . . . 177<br />
Additional Web Resources for Teachers . . . . . . . . . . . . . . . . . . . . . . . . . . . . . . . . . . . . . . . . . . . . . . 199<br />
Appendices<br />
I. More About the National Institutes of Health . . . . . . . . . . . . . . . . . . . . . . . . . . . . . . . . . . . . . . . 201<br />
II. More About the National Institute on <strong>Alcohol</strong> Abuse <strong>and</strong> <strong>Alcohol</strong>ism<br />
<strong>and</strong> Its Science Education Program . . . . . . . . . . . . . . . . . . . . . . . . . . . . . . . . . . . . . . . . . . . . . . . 205
Foreword<br />
This curriculum supplement, from The NIH Curriculum<br />
Supplement Series, brings cutting-edge<br />
medical science <strong>and</strong> basic research discoveries<br />
from the laboratories of the National Institutes of<br />
Health (NIH) <strong>into</strong> classrooms. As the largest<br />
medical research institution in the United States,<br />
NIH plays a vital role in the health of all Americans<br />
<strong>and</strong> seeks to foster interest in research, science,<br />
<strong>and</strong> medicine-related careers for future<br />
generations. The NIH Office of Science Education<br />
(OSE) is dedicated to promoting science education<br />
<strong>and</strong> scientific literacy.<br />
We designed this curriculum supplement to complement<br />
existing life science curricula at both the<br />
state <strong>and</strong> local levels <strong>and</strong> to be consistent with<br />
National Science Education St<strong>and</strong>ards. It was developed<br />
<strong>and</strong> tested by a team composed of teachers<br />
from across the country, scientists, medical<br />
experts, other professionals with relevant subjectarea<br />
expertise from institutes <strong>and</strong> medical schools<br />
across the country, representatives from the NIH<br />
National Institute on <strong>Alcohol</strong> Abuse <strong>and</strong> <strong>Alcohol</strong>ism<br />
(NIAAA), <strong>and</strong> curriculum-design experts<br />
from Biological Sciences Curriculum Study<br />
(BSCS), SAIC, <strong>and</strong> Edge Interactive. The authors<br />
incorporated real scientific data <strong>and</strong> actual case<br />
studies <strong>into</strong> classroom activities. A three-year<br />
development process included geographically dispersed<br />
field tests by teachers <strong>and</strong> students.<br />
The structure of this module enables teachers to<br />
effectively facilitate learning <strong>and</strong> stimulate student<br />
interest by applying scientific concepts to real-life<br />
scenarios. Design elements include a conceptual<br />
flow of lessons based on BSCS’s 5E Instructional<br />
Model of Learning, multisubject integration<br />
emphasizing cutting-edge science content, <strong>and</strong><br />
built-in assessment tools. Activities promote<br />
active <strong>and</strong> collaborative learning <strong>and</strong> are inquirybased<br />
to help students develop problem-solving<br />
strategies <strong>and</strong> critical thinking.<br />
Each curriculum supplement comes with a complete<br />
set of materials for both teachers <strong>and</strong> students<br />
including printed materials, extensive<br />
background <strong>and</strong> resource information, <strong>and</strong> a Web<br />
site with interactive activities. These supplements<br />
are distributed at no cost to teachers across the<br />
United States. All materials may be copied for<br />
classroom use but may not be sold. We welcome<br />
feedback from our users. For a complete list of<br />
curriculum supplements, updates, availability,<br />
<strong>and</strong> ordering information, or to submit feedback,<br />
please visit our Web site at http://science.education.<br />
nih.gov or write to<br />
Curriculum Supplement Series<br />
Office of Science Education<br />
National Institutes of Health<br />
6705 Rockledge Dr., Suite 700 MSC 7984<br />
Bethesda, MD 20892-7984<br />
We appreciate the valuable contributions of the<br />
talented staff at BSCS, SAIC, <strong>and</strong> Edge Interactive.<br />
We are also grateful to the NIH scientists, advisors,<br />
<strong>and</strong> all other participating professionals for<br />
their work <strong>and</strong> dedication. Finally, we thank the<br />
teachers <strong>and</strong> students who participated in focus<br />
groups <strong>and</strong> field tests to ensure that these supplements<br />
are both engaging <strong>and</strong> effective. I hope you<br />
find our series a valuable addition to your classroom<br />
<strong>and</strong> wish you a productive school year.<br />
Bruce A. Fuchs, Ph.D.<br />
Director<br />
Office of Science Education<br />
National Institutes of Health<br />
________________________<br />
1 In 1996, the National Academy of Sciences released the National Science Education St<strong>and</strong>ards, which outlines what all citizens<br />
should underst<strong>and</strong> about science by the time they graduate from high school. The St<strong>and</strong>ards encourages teachers to<br />
select major science concepts that empower students to use information to solve problems rather than stressing memorization<br />
of unrelated information.<br />
v
About the National<br />
Institutes of Health<br />
Founded in 1887, the National Institutes of<br />
Health (NIH) today is the federal focal point for<br />
medical research in the United States. Composed<br />
of separate institutes <strong>and</strong> centers, NIH is one of<br />
eight health agencies of the Public Health Service<br />
within the U.S. Department of Health <strong>and</strong> Human<br />
Services. The NIH mission is to uncover new<br />
knowledge about the prevention, detection, diagnosis,<br />
<strong>and</strong> treatment of disease <strong>and</strong> disability, from<br />
the rarest genetic disorder to the common cold. It<br />
does this through<br />
• Research. Enhancing research outcomes across<br />
the medical research continuum by supporting<br />
research in NIH’s own intramural laboratories as<br />
well as the research of nonfederal scientists<br />
working in universities, medical schools, hospitals,<br />
<strong>and</strong> research institutions throughout the<br />
country <strong>and</strong> abroad; communicating scientific<br />
results; promoting the efficient transfer of new<br />
drugs <strong>and</strong> other technologies; <strong>and</strong> providing<br />
effective research leadership <strong>and</strong> administration.<br />
• Research Training <strong>and</strong> Career Development Program.<br />
Supporting research training <strong>and</strong> outreach<br />
designed to ensure a continuing supply of welltrained<br />
scientists.<br />
• Research Facilities Program. Modernizing <strong>and</strong><br />
improving intramural <strong>and</strong> extramural research<br />
facilities to ensure that the nation’s scientists<br />
have adequate facilities in which to conduct<br />
their work.<br />
Science education efforts by NIH <strong>and</strong> its institutes<br />
<strong>and</strong> centers are critical in ensuring the continued<br />
supply of well-trained basic research <strong>and</strong> clinical<br />
investigators, as well as the myriad professionals<br />
in the many allied disciplines who support the<br />
research enterprise. These efforts also help educate<br />
people about the scientific results so that they<br />
can make informed decisions about their own<br />
health as well as the health of the public.<br />
This curriculum supplement is one such science<br />
education effort, done through the partnership of<br />
the NIH National Institute on <strong>Alcohol</strong> Abuse <strong>and</strong><br />
<strong>Alcohol</strong>ism, the NIH Office of Science Education,<br />
<strong>and</strong> Biological Sciences Curriculum Study (BSCS).<br />
vii
About the National Institute on<br />
<strong>Alcohol</strong> Abuse <strong>and</strong> <strong>Alcohol</strong>ism<br />
The National Institute on <strong>Alcohol</strong> Abuse <strong>and</strong><br />
<strong>Alcohol</strong>ism (NIAAA) supports <strong>and</strong> conducts biomedical<br />
<strong>and</strong> behavioral research on the causes,<br />
consequences, treatment, <strong>and</strong> prevention of alcoholism<br />
<strong>and</strong> alcohol-related problems. NIAAA also<br />
provides leadership in the national effort to<br />
reduce the severe <strong>and</strong> often fatal consequences of<br />
these problems by<br />
• conducting <strong>and</strong> supporting research directed at<br />
determining the cause of alcoholism, discovering<br />
how alcohol damages the organs of the body, <strong>and</strong><br />
developing prevention <strong>and</strong> treatment strategies for<br />
application in the nation’s healthcare system;<br />
• supporting <strong>and</strong> conducting research across a<br />
wide range of scientific areas including genetics,<br />
neuroscience, medical consequences, medication<br />
development, prevention, <strong>and</strong> treatment<br />
through the award of grants <strong>and</strong> within the<br />
NIAAA intramural research program;<br />
• conducting policy studies that have broad implications<br />
for alcohol-problem prevention, treatment,<br />
<strong>and</strong> rehabilitation activities;<br />
• conducting epidemiological studies such as<br />
national <strong>and</strong> community surveys to assess risks<br />
for <strong>and</strong> magnitude of alcohol-related problems<br />
among various population groups;<br />
• collaborating with other research institutes <strong>and</strong><br />
federal programs relevant to alcohol abuse <strong>and</strong><br />
alcoholism <strong>and</strong> providing coordination for federal<br />
alcohol-abuse <strong>and</strong> alcoholism activities;<br />
• maintaining continuing relationships with institutions<br />
<strong>and</strong> professional associations; international,<br />
national, state, <strong>and</strong> local officials; <strong>and</strong><br />
voluntary agencies <strong>and</strong> organizations engaged<br />
in alcohol-related work; <strong>and</strong><br />
• disseminating research findings to healthcare<br />
providers, researchers, policymakers, <strong>and</strong> the<br />
public.<br />
ix
Introduction to <strong>Underst<strong>and</strong>ing</strong><br />
<strong>Alcohol</strong>: <strong>Investigations</strong> <strong>into</strong><br />
<strong>Biology</strong> <strong>and</strong> <strong>Behavior</strong><br />
“Although alcohol is sometimes referred to as a<br />
‘gateway drug’ for youth because its use often<br />
precedes the use of other illicit substances, this<br />
terminology is counterproductive; youth drinking<br />
requires significant attention, not because of<br />
what it leads to, but because of the extensive<br />
human <strong>and</strong> economic impact of alcohol use by<br />
this vulnerable population.” 43<br />
—Dr. Enoch Gordis, former Director<br />
of the National Institute on <strong>Alcohol</strong><br />
Abuse <strong>and</strong> <strong>Alcohol</strong>ism<br />
Despite the legal drinking age of 21, alcohol consumption<br />
by underage individuals is not rare. A<br />
recent survey showed that 26 percent of eighth<br />
graders reported consuming alcohol within the<br />
month prior to the survey, <strong>and</strong> 16 percent reported<br />
binge drinking during the two weeks before the<br />
survey. 42 The effects of adolescent drinking involve<br />
both health- <strong>and</strong> safety-related problems, including<br />
auto crashes, domestic violence, <strong>and</strong> suicide.<br />
<strong>Alcohol</strong> abuse among teenagers may also be<br />
related to behavioral problems linked to impulsiveness<br />
<strong>and</strong> sensation seeking. Youth-alcohol-use<br />
data indicate that the earlier an individual begins<br />
drinking, the greater is his or her risk of developing<br />
alcohol-use disorders in the future. 26<br />
What Are the Objectives of the Module?<br />
<strong>Underst<strong>and</strong>ing</strong> <strong>Alcohol</strong>: <strong>Investigations</strong> <strong>into</strong> <strong>Biology</strong><br />
<strong>and</strong> <strong>Behavior</strong> has four objectives. The first is to<br />
help students underst<strong>and</strong> how alcohol consumption<br />
affects the functioning of the body. By focusing<br />
on the scientific issues that explain how the<br />
body reacts to alcohol, the module seeks to help<br />
students make informed decisions about the use<br />
of alcohol in their lives.<br />
The second objective is to use the topic of alcohol<br />
as a way to underst<strong>and</strong> important scientific concepts.<br />
The activities in this module incorporate<br />
concepts such as concentration <strong>and</strong> solubility<br />
(miscibility), as well as build important skills in<br />
observation, critical thinking, experimental<br />
design, <strong>and</strong> data analysis.<br />
The third objective is to convey to students the<br />
purpose of scientific research. Scientific research<br />
changes the way we underst<strong>and</strong> the world<br />
around us <strong>and</strong> gives us the foundation for<br />
improving our choices about our personal health<br />
<strong>and</strong> the health of the public. In this module, students<br />
see that science provides evidence that can<br />
be used to support ways of underst<strong>and</strong>ing <strong>and</strong><br />
treating human disease. Because the mission of<br />
NIAAA includes increasing the public’s underst<strong>and</strong>ing<br />
about the causes, consequences, treatment,<br />
<strong>and</strong> prevention of alcoholism <strong>and</strong><br />
alcohol-related problems, the Institute believes<br />
that education provides one context in which it<br />
can fulfill its mission.<br />
We have designed the lessons in this module to<br />
encourage students to think about the relationships<br />
among knowledge, choice, behavior, <strong>and</strong><br />
enhanced human health in this way:<br />
Knowledge (what is known <strong>and</strong> not known) +<br />
Choice = Power<br />
Power + <strong>Behavior</strong> = Enhanced Human Health<br />
The final objective is to encourage students to<br />
think in terms of these relationships now <strong>and</strong> as<br />
they grow older.<br />
1
<strong>Underst<strong>and</strong>ing</strong> <strong>Alcohol</strong>: <strong>Investigations</strong> <strong>into</strong> <strong>Biology</strong> <strong>and</strong> <strong>Behavior</strong><br />
Why Teach the Module?<br />
Middle school life science classes offer an ideal setting<br />
for integrating many areas of student interest.<br />
In this module, students participate in activities<br />
that integrate inquiry science, environmental studies,<br />
human health, history, decision-making concepts,<br />
<strong>and</strong> mathematics. The real-life context of the<br />
module’s classroom lessons is engaging for students,<br />
<strong>and</strong> the knowledge gained by participating<br />
in the module can be applied immediately to students’<br />
lives.<br />
“It [the module] could be easily done by my<br />
special-ed students, as well as keeping the interest<br />
of the gifted students.” – Field-Test Teacher<br />
“I thought that the lessons were very informative,<br />
<strong>and</strong> it is all information that everyone needs to<br />
know about.” – Field-Test Student<br />
What’s in It for the Teacher?<br />
<strong>Underst<strong>and</strong>ing</strong> <strong>Alcohol</strong> meets many of the criteria<br />
by which teachers <strong>and</strong> their programs are<br />
assessed.<br />
• The module is st<strong>and</strong>ards based <strong>and</strong> meets science<br />
content, teaching, <strong>and</strong> assessment st<strong>and</strong>ards<br />
as expressed in the National Science<br />
Education St<strong>and</strong>ards. It pays particular attention<br />
to the st<strong>and</strong>ards that describe what students<br />
should know <strong>and</strong> be able to do with respect to<br />
scientific inquiry.<br />
• As described above, it is an integrated module,<br />
drawing most heavily from the subjects of science,<br />
history, mathematics, <strong>and</strong> health.<br />
• The module has a Web-based technology component<br />
that includes videos <strong>and</strong> interactive simulations.<br />
• Finally, the module includes built-in assessment<br />
tools, which are noted in each of the lessons<br />
with an assessment icon.<br />
In addition, the module provides a means for professional<br />
development. Teachers can engage in<br />
new <strong>and</strong> different teaching practices like those<br />
described in this module without completely<br />
overhauling their entire yearlong program. In<br />
Designing Professional Development for Teachers of<br />
Science <strong>and</strong> Mathematics, 33 Susan Loucks-Horsley<br />
et al. write that supplemental modules such as<br />
<strong>Underst<strong>and</strong>ing</strong> <strong>Alcohol</strong>: <strong>Investigations</strong> <strong>into</strong> <strong>Biology</strong><br />
<strong>and</strong> <strong>Behavior</strong> can “offer a window through which<br />
teachers can get a glimpse of what new teaching<br />
strategies look like in action.” By experiencing a<br />
short-term unit like this one, teachers can<br />
“change how they think about teaching <strong>and</strong><br />
embrace new approaches that stimulate students<br />
to problem solve, reason, investigate, <strong>and</strong> construct<br />
their own meaning for the content.” The<br />
use of a supplemental unit like this module can<br />
encourage reflection <strong>and</strong> discussion <strong>and</strong> stimulate<br />
teachers to improve their practices by focusing on<br />
student learning through inquiry.<br />
The following table correlates topics often<br />
included in the middle school curriculum with<br />
the major concepts presented in this module. This<br />
information is presented to help teachers make<br />
decisions about incorporating this material <strong>into</strong><br />
the curriculum.<br />
2
Correlation of <strong>Underst<strong>and</strong>ing</strong> <strong>Alcohol</strong> to Common Middle School Topics<br />
Topic Lesson 1 Lesson 2 Lesson 3 Lesson 4 Lesson 5 Lesson 6<br />
Chemical composition of matter<br />
✔<br />
Individual variation <strong>and</strong> susceptibility<br />
✔ ✔ ✔<br />
Human health <strong>and</strong> medicine<br />
✔ ✔ ✔<br />
Risk assessment <strong>and</strong> management<br />
Scientific methods<br />
✔<br />
✔ ✔ ✔<br />
✔<br />
Relationship among science,<br />
technology, <strong>and</strong> society<br />
✔ ✔ ✔ ✔<br />
3<br />
Introduction
Implementing<br />
the Module<br />
The six lessons in this module are designed to be<br />
taught in sequence for one to two weeks (as a supplement<br />
to the st<strong>and</strong>ard curriculum). The following<br />
pages offer general suggestions about using<br />
these materials in the classroom; you will find<br />
specific suggestions in the procedures provided<br />
for each lesson.<br />
What Are the Goals of the Module?<br />
<strong>Underst<strong>and</strong>ing</strong> <strong>Alcohol</strong>: <strong>Investigations</strong> <strong>into</strong> <strong>Biology</strong><br />
<strong>and</strong> <strong>Behavior</strong> is designed to help students develop<br />
the following major goals associated with scientific<br />
literacy:<br />
• to underst<strong>and</strong> a set of basic scientific principles<br />
related to the use <strong>and</strong> abuse of alcohol <strong>and</strong> its<br />
effects on human health;<br />
• to experience the process of scientific inquiry<br />
<strong>and</strong> develop an enhanced underst<strong>and</strong>ing of the<br />
nature <strong>and</strong> methods of science; <strong>and</strong><br />
• to recognize the role of science in society <strong>and</strong><br />
the relationship between basic science <strong>and</strong><br />
human health.<br />
What Are the Science Concepts <strong>and</strong> How<br />
Are They Connected?<br />
We have organized the lessons to form a conceptual<br />
whole that moves students from thinking<br />
about what they already know, or think they<br />
know, about alcohol (<strong>Alcohol</strong>: Separating Fact from<br />
Fiction), to investigating how much alcohol is in<br />
different types of alcoholic beverages <strong>and</strong> how the<br />
alcohol is distributed in the body (A Drink Is a<br />
Drink, but People Are Different). Students next use<br />
simulations to investigate how alcohol affects<br />
movement of mice at different doses, at different<br />
times after consumption, <strong>and</strong> in different genetic<br />
strains (Responding to <strong>Alcohol</strong>: What’s Important?).<br />
Students then discover that alcohol use spans a<br />
continuum from no use, to use, to abuse, to alcoholism,<br />
<strong>and</strong> that how an individual’s drinking is<br />
categorized depends on a variety of factors including<br />
personal choice (<strong>Alcohol</strong> Use, Abuse, <strong>and</strong> <strong>Alcohol</strong>ism).<br />
Students focus their underst<strong>and</strong>ing of<br />
how alcohol affects a person’s functioning by considering<br />
how drinking alcohol impairs cognitive<br />
<strong>and</strong> motor skills. The amount of alcohol, the pattern<br />
of drinking, <strong>and</strong> the individual’s gender <strong>and</strong><br />
body type influence how high the blood alcohol<br />
concentration is <strong>and</strong> how long it takes for it to<br />
decrease (<strong>Alcohol</strong> <strong>and</strong> Driving: When to Say No).<br />
Through consideration of how alcohol affects mental<br />
<strong>and</strong> physical abilities, students begin to consider<br />
how alcohol could affect them if they choose to<br />
drink. Finally, students synthesize the information<br />
they have learned to decide whether the use of alcohol<br />
should be restricted for all public activities <strong>and</strong><br />
not just driving (Using <strong>Alcohol</strong>: Setting Limits). The<br />
tables on pages 8 <strong>and</strong> 9 illustrate the science content<br />
<strong>and</strong> conceptual flow of the six lessons.<br />
How Does the Module Correlate to the<br />
National Science Education St<strong>and</strong>ards?<br />
<strong>Underst<strong>and</strong>ing</strong> <strong>Alcohol</strong>: <strong>Investigations</strong> <strong>into</strong> <strong>Biology</strong><br />
<strong>and</strong> <strong>Behavior</strong> supports teachers in their efforts to<br />
reform science education in the spirit of the<br />
National Research Council’s 1996 National Science<br />
Education St<strong>and</strong>ards (NSES). The content of<br />
the module is explicitly st<strong>and</strong>ards based: Each<br />
time a st<strong>and</strong>ard is addressed in a lesson, an icon<br />
appears in the margin <strong>and</strong> the applicable st<strong>and</strong>ard<br />
is identified. The Content St<strong>and</strong>ards:<br />
Grades 5–8 chart on pages 6<br />
<strong>and</strong> 7 lists the specific content st<strong>and</strong>ards<br />
that this module addresses.<br />
5
<strong>Underst<strong>and</strong>ing</strong> <strong>Alcohol</strong>: <strong>Investigations</strong> <strong>into</strong> <strong>Biology</strong> <strong>and</strong> <strong>Behavior</strong><br />
Content St<strong>and</strong>ards: Grades 5–8<br />
St<strong>and</strong>ard A: As a result of activities in grades 5–8, all<br />
students should develop<br />
Abilities necessary to do scientific inquiry<br />
• Identify questions <strong>and</strong> concepts that guide scientific investigations.<br />
• Design <strong>and</strong> conduct a scientific investigation.<br />
• Use appropriate tools <strong>and</strong> techniques to gather, analyze, <strong>and</strong> interpret<br />
data.<br />
• Develop descriptions, explanations, predictions, <strong>and</strong> models using<br />
evidence.<br />
• Think critically <strong>and</strong> logically to make the relationships between<br />
evidence <strong>and</strong> explanations.<br />
• Recognize <strong>and</strong> analyze alternative explanations <strong>and</strong> predictions.<br />
• Communicate scientific procedures <strong>and</strong> explanations.<br />
• Use mathematics in all aspects of scientific inquiry.<br />
<strong>Underst<strong>and</strong>ing</strong>s about scientific inquiry<br />
• Different kinds of questions suggest different kinds of scientific investigations.<br />
Some involve observing <strong>and</strong> describing objects, organisms, or<br />
events; some involve collecting specimens; some involve experiments;<br />
some involve seeking more information; some involve discovery of<br />
new objects; <strong>and</strong> some involve making models.<br />
• Mathematics is important in all aspects of scientific inquiry.<br />
Correlation to <strong>Underst<strong>and</strong>ing</strong><br />
<strong>Alcohol</strong>:<br />
<strong>Investigations</strong> <strong>into</strong><br />
<strong>Biology</strong> <strong>and</strong> <strong>Behavior</strong><br />
Lessons 1, 2, 3, 6<br />
Lesson 3<br />
Lesson 3<br />
Lessons 1, 2, 3, 4, 5<br />
Lessons 1, 2, 3, 5, 6<br />
Lessons 1, 2, 3, 4, 6<br />
Lessons 1, 2, 3, 4, 5, 6<br />
Lessons 2, 3, 4, 5<br />
Lessons 2, 3, 4, 5<br />
Lessons 2, 3, 4, 5<br />
St<strong>and</strong>ard C: As a result of their activities in grades 5–8, all students<br />
should develop underst<strong>and</strong>ing of<br />
Structure <strong>and</strong> function in living systems<br />
• Living systems at all levels of organization demonstrate the complementary<br />
nature of structure <strong>and</strong> function. Important levels of organization<br />
for structure <strong>and</strong> function include cells, organs, tissues, organ<br />
systems, whole organisms, <strong>and</strong> ecosystems.<br />
• Specialized cells perform specialized functions in multicellular organisms.<br />
Groups of specialized cells cooperate to form a tissue, such as muscle.<br />
Different tissues are in turn grouped together to form larger functional<br />
units, called organs. Each type of cell, tissue, <strong>and</strong> organ has a distinct<br />
structure <strong>and</strong> set of functions that serve the organism as a whole.<br />
• The human organism has systems for digestion, respiration, reproduction,<br />
circulation, excretion, movement, control, coordination, <strong>and</strong> protection<br />
from disease. These systems interact with one another.<br />
Lessons 2, 5<br />
Lessons 2, 5<br />
Lessons 2, 3, 5<br />
6
• Disease is a breakdown in structures or functions of an organism.<br />
Some diseases are the result of intrinsic failures of the system. Others<br />
are the result of damage by infection from other organisms.<br />
Reproduction <strong>and</strong> heredity<br />
• The characteristics of an organism can be described in terms of a<br />
combination of traits. Some are inherited <strong>and</strong> others result from<br />
interactions with the environment.<br />
Regulation <strong>and</strong> behavior<br />
• <strong>Behavior</strong> is one kind of response an organism can make to an internal<br />
or environmental stimulus.<br />
Lessons 4, 6<br />
Lessons 3, 4, 5, 6<br />
Lessons 1, 3, 4, 5, 6<br />
St<strong>and</strong>ard F: As a result of their activities in grades 5–8, all students<br />
should develop underst<strong>and</strong>ing of<br />
Personal health<br />
• The potential for accidents <strong>and</strong> the existence of hazards impose the<br />
need for injury prevention. Safe living involves the development <strong>and</strong> use<br />
of safety precautions <strong>and</strong> the recognition of risk in personal decisions.<br />
• <strong>Alcohol</strong> <strong>and</strong> other drugs are often abused substances. Such drugs<br />
change how the body functions <strong>and</strong> can lead to addiction.<br />
Risks <strong>and</strong> benefits<br />
• Risk analysis considers the type of hazard <strong>and</strong> estimates the number<br />
of people who might be exposed <strong>and</strong> the number likely to suffer consequences.<br />
The results are used to determine the options for reducing<br />
or eliminating risks.<br />
• Students should underst<strong>and</strong> the risks associated with natural hazards<br />
(fires, floods, tornadoes, hurricanes, earthquakes, <strong>and</strong> volcanic eruptions),<br />
chemical hazards (pollutants in air, water, soil, <strong>and</strong> food), biological<br />
hazards (pollen, viruses, bacteria, <strong>and</strong> parasites), social hazards<br />
(occupational safety <strong>and</strong> transportation), <strong>and</strong> personal hazards (smoking,<br />
dieting, <strong>and</strong> drinking).<br />
• Important personal <strong>and</strong> social decisions are made based on perceptions<br />
of benefits <strong>and</strong> risks.<br />
Lessons 1, 5, 6<br />
Lessons 1, 2, 3, 4, 5, 6<br />
Lessons 4, 5, 6<br />
Lessons 1, 4, 5, 6<br />
Lessons 4, 5, 6<br />
St<strong>and</strong>ard G: As a result of activities in grades 5–8, all students<br />
should develop underst<strong>and</strong>ing of<br />
Science as a human endeavor<br />
• Science requires different abilities, depending on such factors as the<br />
field of study <strong>and</strong> type of inquiry. Science is very much a human<br />
endeavor, <strong>and</strong> the work of science relies on basic human qualities,<br />
such as reasoning, insight, energy, skills, <strong>and</strong> creativity, as well as on<br />
scientific habits of minds, such as intellectual honesty, tolerance of<br />
ambiguity, skepticism, <strong>and</strong> openness to new ideas.<br />
Lessons 1, 2, 3, 6<br />
7<br />
Implementing the Module
<strong>Underst<strong>and</strong>ing</strong> <strong>Alcohol</strong>: <strong>Investigations</strong> <strong>into</strong> <strong>Biology</strong> <strong>and</strong> <strong>Behavior</strong><br />
Teaching St<strong>and</strong>ards<br />
The suggested teaching strategies in all the lessons<br />
support teachers as they work to meet the teaching<br />
st<strong>and</strong>ards outlined in the National Science<br />
Education St<strong>and</strong>ards. The module helps teachers of<br />
science plan an inquiry-based science program by<br />
providing short-term objectives for students. It<br />
also includes planning tools such as the Conceptual<br />
Flow of the Lessons chart <strong>and</strong> the Suggested<br />
Timeline for teaching the module. Teachers can<br />
use this module to update their curriculum in<br />
response to their students’ interest in this topic.<br />
The focus on active, collaborative, <strong>and</strong> inquirybased<br />
learning in the lessons helps teachers support<br />
the development of student underst<strong>and</strong>ing<br />
<strong>and</strong> nurture a community of science learners.<br />
The structure of the lessons in this module<br />
enables teachers to guide <strong>and</strong> facilitate learning.<br />
All the activities encourage <strong>and</strong> support student<br />
inquiry, promote discourse among students, <strong>and</strong><br />
challenge students to accept <strong>and</strong> share responsibility<br />
for their learning. The use of the 5E Instructional<br />
Model combined with active, collaborative<br />
learning, allows teachers to respond effectively to<br />
the diversity of student backgrounds <strong>and</strong> learning<br />
styles. The module is fully annotated, with suggestions<br />
for how teachers can encourage <strong>and</strong><br />
model the skills of scientific inquiry, as well as the<br />
curiosity, openness to new ideas <strong>and</strong> data, <strong>and</strong><br />
skepticism that characterize science.<br />
Assessment St<strong>and</strong>ards<br />
Teachers can engage in ongoing assessment of<br />
their teaching <strong>and</strong> of student learning using the<br />
variety of assessment components embedded<br />
within the module’s structure. The assessment<br />
tasks are authentic: They are similar in form to<br />
tasks in which students will engage in their lives<br />
outside the classroom or in which scientists participate.<br />
Annotations guide teachers to these<br />
opportunities for assessment <strong>and</strong> provide answers<br />
to questions that can help teachers analyze student<br />
feedback.<br />
How Does the 5E Instructional Model<br />
Promote Active, Collaborative, Inquiry-<br />
Based Learning?<br />
Because learning does not occur through a process<br />
of passive absorption, the lessons in this module<br />
promote active learning: Students are involved in<br />
more than listening <strong>and</strong> reading. They are developing<br />
skills, analyzing <strong>and</strong> evaluating evidence,<br />
experiencing <strong>and</strong> discussing, <strong>and</strong> talking to their<br />
peers about their own underst<strong>and</strong>ings. Students<br />
work collaboratively with others to solve problems<br />
Science Content <strong>and</strong> the Lessons<br />
Lesson<br />
Lesson 1<br />
Lesson 2<br />
Lesson 3<br />
Lesson 4<br />
Lesson 5<br />
Lesson 6<br />
Science Content<br />
Distinguishing between observation <strong>and</strong> inference.<br />
Concentration <strong>and</strong> miscibility. Relating body type to an individual’s response to alcohol.<br />
Use of animal models. Effects of dose, time after ingestion, <strong>and</strong> genetic background<br />
on individual response to alcohol.<br />
Factors influencing alcohol use <strong>and</strong> abuse. Interactions of genetics <strong>and</strong> the<br />
environment.<br />
Calculation of blood alcohol concentrations (BACs). Effects of metabolism, gender, <strong>and</strong><br />
body size <strong>and</strong> type.<br />
Relating BAC levels to impairments. Assessing risks <strong>and</strong> costs of alcohol use to the<br />
individual <strong>and</strong> to society.<br />
8
Conceptual Flow of the Lessons<br />
Lesson<br />
Lesson 1<br />
<strong>Alcohol</strong>:<br />
Separating Fact<br />
from Fiction<br />
Lesson 2<br />
A Drink Is a Drink,<br />
but People Are<br />
Different<br />
Lesson 3<br />
Responding to<br />
<strong>Alcohol</strong>: What’s<br />
Important?<br />
Lesson 4<br />
<strong>Alcohol</strong> Use,<br />
Abuse, <strong>and</strong><br />
<strong>Alcohol</strong>ism<br />
Lesson 5<br />
<strong>Alcohol</strong> <strong>and</strong><br />
Driving: When to<br />
Say No<br />
Lesson 6<br />
Using <strong>Alcohol</strong>:<br />
Setting Limits<br />
Learning Focus<br />
Engage*: In this lesson, students<br />
express prior knowledge<br />
<strong>and</strong> become engaged in the<br />
study of alcohol, its use <strong>and</strong><br />
abuse, <strong>and</strong> alcoholism.<br />
Explore: In this lesson, students<br />
explore the alcohol content of<br />
various types of alcoholic beverages<br />
<strong>and</strong> how alcohol distributes<br />
in the human body. The<br />
Explore phase gives students a<br />
common set of experiences<br />
upon which to begin building<br />
conceptual underst<strong>and</strong>ing.<br />
Explore/Explain: Students analyze<br />
simulations of the effects of<br />
alcohol on mouse activity levels.<br />
Students express their underst<strong>and</strong>ing<br />
of the simulations in<br />
their own words <strong>and</strong> by using<br />
graphs.<br />
Explain/Elaborate: Students continue<br />
to investigate how <strong>and</strong><br />
why humans use alcohol. They<br />
broaden their conceptual underst<strong>and</strong>ing<br />
<strong>and</strong> apply what they<br />
have learned in a new context.<br />
Explain/Elaborate: Students<br />
refine their underst<strong>and</strong>ing of<br />
how alcohol affects human<br />
behavior <strong>and</strong> begin to consider<br />
how alcohol could affect their<br />
own lives.<br />
Elaborate/Evaluate: In this lesson,<br />
students apply what they<br />
have learned in previous lessons<br />
to a new situation to<br />
demonstrate their underst<strong>and</strong>ing<br />
of concepts.<br />
Major Concept<br />
Students receive mixed messages about alcohol<br />
use. They are warned of its dangers, yet it<br />
is portrayed as part of a desirable lifestyle in<br />
movies, media, <strong>and</strong> advertisements.<br />
The total amount of alcohol in a typical serving<br />
of beer, wine, or hard liquor is about the<br />
same. <strong>Alcohol</strong> distributes throughout the<br />
water-containing portions of the body. The<br />
brain has a high water content, <strong>and</strong> alcohol<br />
exerts many of its effects here.<br />
The greater the dose of alcohol, the greater<br />
the effect on behavior. <strong>Alcohol</strong> is metabolized<br />
by the body. Its effects decrease with increasing<br />
time after consumption. Individuals within<br />
a population differ in their response to alcohol.<br />
Such differences are partly due to genetics.<br />
<strong>Alcohol</strong> use ranges along a continuum from<br />
abstinence to use, to abuse, to alcoholism.<br />
Where an individual falls along this continuum<br />
depends on genetic <strong>and</strong> environmental<br />
factors. Personal choice plays a key role in an<br />
individual’s decision to use alcohol.<br />
Drinking alcohol impairs the functions of the<br />
mind <strong>and</strong> body. The extent of impairment<br />
depends upon the amount of alcohol in the<br />
blood. This in turn depends upon many factors<br />
including the drinker’s body weight, gender,<br />
<strong>and</strong> amount <strong>and</strong> pattern of drinking.<br />
The effects of drinking alcohol are dose<br />
dependent. People who drink <strong>and</strong> have<br />
blood alcohol concentrations below the legal<br />
limit for driving may still be impaired. Public<br />
policies aimed at alcohol must balance many<br />
factors.<br />
*See How Does the 5E Instructional Model Promote Active, Collaborative, Inquiry-Based Learning?, on page 8.<br />
9<br />
Implementing the Module
<strong>Underst<strong>and</strong>ing</strong> <strong>Alcohol</strong>: <strong>Investigations</strong> <strong>into</strong> <strong>Biology</strong> <strong>and</strong> <strong>Behavior</strong><br />
<strong>and</strong> plan investigations. Many students find they<br />
learn better when they work with others in a collaborative<br />
environment than when they work<br />
alone in a competitive environment. When all this<br />
active, collaborative learning is directed toward<br />
inquiry science, students succeed in making their<br />
own discoveries. They ask questions, observe,<br />
analyze, explain, draw conclusions, <strong>and</strong> ask new<br />
questions. These inquiry experiences include both<br />
those that involve students in direct experimentation<br />
<strong>and</strong> those in which students develop explanations<br />
through critical <strong>and</strong> logical thinking.<br />
This view of students as active thinkers who construct<br />
their own underst<strong>and</strong>ing out of interactions<br />
with phenomena, the environment, <strong>and</strong> other<br />
individuals is based on the theory of constructivism.<br />
A constructivist view of learning recognizes<br />
that students need time to<br />
• express their current thinking;<br />
• interact with objects, organisms, substances,<br />
<strong>and</strong> equipment to develop a range of experiences<br />
on which to base their thinking;<br />
• reflect on their thinking by writing <strong>and</strong> expressing<br />
themselves <strong>and</strong> comparing what they think<br />
with what others think; <strong>and</strong><br />
• make connections between their learning experiences<br />
<strong>and</strong> the real world.<br />
This module provides a built-in structure for creating<br />
a constructivist classroom: the 5E Instructional<br />
Model. This model sequences the learning<br />
experiences so that students have the opportunity<br />
to construct their underst<strong>and</strong>ing of a concept over<br />
time. The model takes students through five<br />
phases of learning that are easily described using<br />
five words that begin with the letter “E”: Engage,<br />
Explore, Explain, Elaborate, <strong>and</strong> Evaluate. The<br />
following paragraphs illustrate how the 5Es are<br />
implemented across the lessons in this module.<br />
Engage<br />
Students come to learning situations with prior<br />
knowledge. This knowledge may or may not be<br />
congruent with the concepts presented in this<br />
module. The Engage lesson provides the opportunity<br />
for teachers to find out what students already<br />
know or what they think they know about the<br />
topic <strong>and</strong> concepts to be developed.<br />
The Engage lesson in this module, Lesson 1, <strong>Alcohol</strong>:<br />
Separating Fact from Fiction, is designed to<br />
• pique students’ curiosity <strong>and</strong> generate interest,<br />
• determine students’ current underst<strong>and</strong>ing<br />
about alcohol <strong>and</strong> its use,<br />
• invite students to raise their own questions<br />
about alcohol use <strong>and</strong> its effects on human<br />
health,<br />
• encourage students to compare their ideas with<br />
the ideas of others, <strong>and</strong><br />
• enable teachers to assess what students do or do<br />
not underst<strong>and</strong> about the stated outcomes of the<br />
lesson.<br />
Explore<br />
In the Explore phase of the module, parts of Lesson<br />
2, A Drink Is a Drink, but People Are Different,<br />
<strong>and</strong> Lesson 3, Responding to <strong>Alcohol</strong>: What’s<br />
Important?, students explore what an alcoholic<br />
drink really is, where alcohol goes in the body,<br />
<strong>and</strong> how it affects the activity level of mice.<br />
These lessons provide a common set of experiences<br />
within which students can compare what<br />
they think about what they are observing <strong>and</strong><br />
experiencing.<br />
During the Explore lessons in this module, Lesson<br />
2, A Drink Is a Drink, but People Are Different, <strong>and</strong><br />
Lesson 3, Responding to <strong>Alcohol</strong>: What’s Important?,<br />
students<br />
• interact with materials, ideas, classroom demonstrations,<br />
<strong>and</strong> simulations;<br />
• consider different ways to solve a problem or<br />
answer a question;<br />
• acquire a common set of experiences with their<br />
classmates so they can compare results <strong>and</strong><br />
ideas;<br />
• observe, describe, record, compare, <strong>and</strong> share<br />
their ideas <strong>and</strong> experiences; <strong>and</strong><br />
• express their developing underst<strong>and</strong>ing of the<br />
effects of alcohol on behavior using graphs <strong>and</strong><br />
by answering questions.<br />
Explain<br />
The Explain lesson provides opportunities for<br />
students to connect their previous experiences<br />
<strong>and</strong> begin to make conceptual sense of the main<br />
10
ideas of the module. This stage also allows for<br />
the introduction of formal language, scientific<br />
terms, <strong>and</strong> information that might make students’<br />
previous experiences easier to describe<br />
<strong>and</strong> explain.<br />
In the Explain lessons in this module, Lesson 3,<br />
Responding to <strong>Alcohol</strong>: What’s Important?, <strong>and</strong> Lesson<br />
4, <strong>Alcohol</strong> Use, Abuse, <strong>and</strong> <strong>Alcohol</strong>ism, students<br />
• explain concepts <strong>and</strong> ideas about the mouse<br />
simulations <strong>and</strong> the dice modeling activity in<br />
their own words;<br />
• listen to <strong>and</strong> compare others’ explanations of<br />
their results with their own;<br />
• become involved in student-to-student discourse<br />
in which they explain their thinking to<br />
others <strong>and</strong> debate their ideas;<br />
• revise their ideas;<br />
• record their ideas <strong>and</strong> current underst<strong>and</strong>ing;<br />
• use labels, terminology, <strong>and</strong> formal language; <strong>and</strong><br />
• compare their current thinking with what they<br />
previously thought.<br />
Elaborate<br />
In Elaborate lessons, students apply or extend the<br />
concepts in new situations <strong>and</strong> relate their previous<br />
experiences to new ones. In the Elaborate lessons<br />
in this module, part of Lesson 4, <strong>Alcohol</strong> Use,<br />
Abuse, <strong>and</strong> <strong>Alcohol</strong>ism; Lesson 5, <strong>Alcohol</strong> <strong>and</strong> Driving:<br />
When to Say No; <strong>and</strong> Lesson 6, Using <strong>Alcohol</strong>:<br />
Setting Limits, students<br />
• make conceptual connections between new <strong>and</strong><br />
former experiences, particularly with respect to<br />
the decision to use alcohol, its effects, <strong>and</strong> the<br />
consequences of its use;<br />
• connect ideas, solve problems, <strong>and</strong> apply their<br />
underst<strong>and</strong>ing in a new situation;<br />
• use scientific terms <strong>and</strong> descriptions;<br />
• draw reasonable conclusions from evidence <strong>and</strong><br />
data;<br />
• add depth to their underst<strong>and</strong>ing of concepts<br />
<strong>and</strong> processes; <strong>and</strong><br />
• communicate their underst<strong>and</strong>ing to others.<br />
Evaluate<br />
The Evaluate lesson is the final stage of the<br />
instructional model, but it only provides a “snapshot”<br />
of what the students underst<strong>and</strong> <strong>and</strong> how<br />
far they have come from where they began. In<br />
reality, the evaluation of students’ conceptual<br />
underst<strong>and</strong>ing <strong>and</strong> ability to use skills begins with<br />
the Engage lesson <strong>and</strong> continues throughout each<br />
stage of the model. Combined with the students’<br />
written work <strong>and</strong> performance of tasks throughout<br />
the module, however, the Evaluate lesson can<br />
serve as a summative assessment of what students<br />
know <strong>and</strong> can do.<br />
The Evaluate lesson in this module, Lesson 6,<br />
Using <strong>Alcohol</strong>: Setting Limits, provides an opportunity<br />
for students to<br />
• demonstrate what they underst<strong>and</strong> about alcohol<br />
<strong>and</strong> how well they can apply their knowledge<br />
to solve a problem;<br />
• share their current thinking with others;<br />
• assess their own progress by comparing their<br />
current underst<strong>and</strong>ing with their prior knowledge;<br />
<strong>and</strong><br />
• ask questions that take them deeper <strong>into</strong> a<br />
concept.<br />
To review the relationship of the 5E Instructional<br />
Model to the concepts presented in the module,<br />
see the chart Conceptual Flow of the Lessons, on<br />
page 9.<br />
When a teacher uses the 5E Instructional Model,<br />
he or she engages in practices that are very different<br />
from those of a traditional teacher. In<br />
response, students also participate in their learning<br />
in ways that are different from those seen in a<br />
traditional classroom. The following charts, What<br />
the Teacher Does <strong>and</strong> What the Students Do, outline<br />
these differences.<br />
How Does the Module Support<br />
Ongoing Assessment?<br />
Because teachers will use this module in a variety of<br />
ways <strong>and</strong> at a variety of points in their curriculum,<br />
the most appropriate mechanism for assessing student<br />
learning is one that occurs informally throughout<br />
the six lessons, rather than something that<br />
happens more formally just once at the end of the<br />
module. Accordingly, integrated within the six lessons<br />
in the module are specific assessment components.<br />
These “embedded” assessment opportunities<br />
include one or more of the following strategies:<br />
11<br />
Implementing the Module
<strong>Underst<strong>and</strong>ing</strong> <strong>Alcohol</strong>: <strong>Investigations</strong> <strong>into</strong> <strong>Biology</strong> <strong>and</strong> <strong>Behavior</strong><br />
What the Teacher Does<br />
Stage<br />
Engage<br />
Explore<br />
Explain<br />
Elaborate<br />
Evaluate<br />
That is consistent with<br />
the 5E Instructional Model<br />
• Piques students’ curiosity <strong>and</strong> generates<br />
interest<br />
• Determines students’ current underst<strong>and</strong>ing<br />
(prior knowledge) of a concept or idea<br />
• Invites students to express what they think<br />
• Invites students to raise their own questions<br />
• Encourages student-to-student interaction<br />
• Observes <strong>and</strong> listens to the students as<br />
they interact<br />
• Asks probing questions to help students<br />
make sense of their experiences<br />
• Provides time for students to puzzle<br />
through problems<br />
• Encourages students to use their common<br />
experiences <strong>and</strong> data from the Engage <strong>and</strong><br />
Explore lessons to develop explanations<br />
• Asks questions that help students express<br />
underst<strong>and</strong>ing <strong>and</strong> explanations<br />
• Requests justification (evidence) for<br />
students’ explanations<br />
• Provides time for students to compare<br />
their ideas with those of others <strong>and</strong><br />
perhaps to revise their thinking<br />
• Introduces terminology <strong>and</strong> alternative explanations<br />
after students express their ideas<br />
• Focuses students’ attention on conceptual<br />
connections between new <strong>and</strong> former<br />
experiences<br />
• Encourages students to use what they have<br />
learned to explain a new event or idea<br />
• Reinforces students’ use of scientific terms<br />
<strong>and</strong> descriptions previously introduced<br />
• Asks questions that help students draw<br />
reasonable conclusions from evidence<br />
<strong>and</strong> data<br />
• Observes <strong>and</strong> records as students demonstrate<br />
their underst<strong>and</strong>ing of concept(s)<br />
<strong>and</strong> performance of skills<br />
• Provides time for students to compare<br />
their ideas with those of others <strong>and</strong> perhaps<br />
to revise their thinking<br />
• Interviews students as a means of assessing<br />
their developing underst<strong>and</strong>ing<br />
• Encourages students to assess their own<br />
progress<br />
That is inconsistent with<br />
the 5E Instructional Model<br />
• Introduces vocabulary<br />
• Explains concepts<br />
• Provides definitions <strong>and</strong> answers<br />
• Provides closure<br />
• Discourages students’ ideas <strong>and</strong> questions<br />
• Provides answers<br />
• Proceeds too rapidly for students to<br />
make sense of their experiences<br />
• Provides closure<br />
• Tells students that they are wrong<br />
• Gives information <strong>and</strong> facts that solve the<br />
problem<br />
• Leads students step-by-step to a solution<br />
• Neglects to solicit students’ explanations<br />
• Ignores data <strong>and</strong> information students<br />
gathered from previous lessons<br />
• Dismisses students’ ideas<br />
• Accepts explanations that are not supported<br />
by evidence<br />
• Introduces unrelated concepts or skills<br />
• Neglects to help students connect new<br />
<strong>and</strong> former experiences<br />
• Provides definitive answers<br />
• Tells students that they are wrong<br />
• Leads students step-by-step to a solution<br />
• Tests vocabulary words, terms, <strong>and</strong> isolated<br />
facts<br />
• Introduces new ideas or concepts<br />
• Creates ambiguity<br />
• Promotes open-ended discussion unrelated<br />
to the concept or skill<br />
12
What the Students Do<br />
Stage<br />
Engage<br />
Explore<br />
Explain<br />
Elaborate<br />
Evaluate<br />
That is consistent with<br />
the 5E Instructional Model<br />
• Become interested in <strong>and</strong> curious about<br />
the concept/topic<br />
• Express current underst<strong>and</strong>ing of a concept<br />
or idea<br />
• Raise questions such as, What do I already<br />
know about this? What do I want to know<br />
about this? How could I find out?<br />
• “Mess around” with materials <strong>and</strong> ideas<br />
• Conduct investigations in which they<br />
observe, describe, <strong>and</strong> record data<br />
• Try different ways to solve a problem or<br />
answer a question<br />
• Acquire a common set of experiences so<br />
they can compare results <strong>and</strong> ideas<br />
• Compare their ideas with those of others<br />
• Explain concepts <strong>and</strong> ideas in their own<br />
words<br />
• Base their explanations on evidence<br />
acquired during previous investigations<br />
• Record their ideas <strong>and</strong> current underst<strong>and</strong>ing<br />
• Reflect on <strong>and</strong> perhaps revise their ideas<br />
• Express their ideas using appropriate scientific<br />
language<br />
• Compare their ideas with what scientists<br />
know <strong>and</strong> underst<strong>and</strong><br />
• Make conceptual connections between<br />
new <strong>and</strong> former experiences<br />
• Use what they have learned to explain a<br />
new object, event, organism, or idea<br />
• Use scientific terms <strong>and</strong> descriptions<br />
• Draw reasonable conclusions from evidence<br />
<strong>and</strong> data<br />
• Communicate their underst<strong>and</strong>ing to others<br />
• Demonstrate what they underst<strong>and</strong> about<br />
the concept(s) <strong>and</strong> how well they can<br />
implement a skill<br />
• Compare their current thinking with that of<br />
others <strong>and</strong> perhaps revise their ideas<br />
• Assess their own progress by comparing<br />
their current underst<strong>and</strong>ing with their prior<br />
knowledge<br />
• Ask new questions that take them deeper<br />
<strong>into</strong> a concept or topic area<br />
That is inconsistent with<br />
the 5E Instructional Model<br />
• Ask for the “right” answer<br />
• Offer the “right” answer<br />
• Insist on answers or explanations<br />
• Seek closure<br />
• Let others do the thinking <strong>and</strong> exploring<br />
(passive involvement)<br />
• Work quietly with little or no interaction<br />
with others (only appropriate when<br />
exploring ideas or feelings)<br />
• Stop with one solution<br />
• Dem<strong>and</strong> or seek closure<br />
• Propose explanations from “thin air” with<br />
no relationship to previous experiences<br />
• Bring up irrelevant experiences <strong>and</strong><br />
examples<br />
• Accept explanations without justification<br />
• Ignore or dismiss other plausible explanations<br />
• Propose explanations without evidence<br />
to support their ideas<br />
• Ignore previous information or evidence<br />
• Draw conclusions from “thin air”<br />
• Use terminology inappropriately <strong>and</strong><br />
without underst<strong>and</strong>ing<br />
• Disregard evidence or previously accepted<br />
explanations in drawing conclusions<br />
• Offer only yes-or-no answers or memorized<br />
definitions or explanations as<br />
answers<br />
• Fail to express satisfactory explanations<br />
in their own words<br />
• Introduce new, irrelevant topics<br />
13<br />
Implementing the Module
<strong>Underst<strong>and</strong>ing</strong> <strong>Alcohol</strong>: <strong>Investigations</strong> <strong>into</strong> <strong>Biology</strong> <strong>and</strong> <strong>Behavior</strong><br />
• performance-based activities (for example,<br />
developing graphs or participating in a discussion<br />
of risk assessment);<br />
• oral presentations to the class (for example, presenting<br />
experimental results); <strong>and</strong><br />
• written assignments (for example, answering<br />
questions or writing about demonstrations).<br />
These strategies allow the teacher to assess a variety<br />
of aspects of the learning process, such as students’<br />
prior knowledge <strong>and</strong> current underst<strong>and</strong>ing,<br />
problem-solving <strong>and</strong> critical-thinking skills, level<br />
of underst<strong>and</strong>ing, communication skills, <strong>and</strong> ability<br />
to synthesize ideas <strong>and</strong> apply underst<strong>and</strong>ing to<br />
a new situation.<br />
An assessment icon <strong>and</strong> an annotation<br />
that describes the aspect of learning<br />
teachers can assess appear in the margin<br />
beside the step in which each<br />
embedded assessment occurs.<br />
How Can Teachers Promote Safety<br />
in the Science Classroom?<br />
Even simple science demonstrations <strong>and</strong> investigations<br />
can be hazardous unless teachers <strong>and</strong> students<br />
know <strong>and</strong> follow safety precautions.<br />
Teachers are responsible for providing students<br />
with active instruction concerning their conduct<br />
<strong>and</strong> safety in the classroom; posting rules in a<br />
classroom is not enough. They also need to provide<br />
adequate supervision <strong>and</strong> advance warning if<br />
there are dangers involved in the science investigation.<br />
By maintaining equipment in proper<br />
working order, teachers ensure a safe environment<br />
for students.<br />
The following are important ways to implement<br />
<strong>and</strong> maintain a safety program.<br />
• Provide eye protection for students, teachers,<br />
<strong>and</strong> visitors. Require that everyone participating<br />
wear regulation goggles in any situation where<br />
there might be splashes, spills, or spattering.<br />
Teachers should always wear goggles in such situations.<br />
• Know <strong>and</strong> follow the state <strong>and</strong> district safety<br />
rules <strong>and</strong> policies. Be sure to fully explain to the<br />
students the safety rules they should use in the<br />
classroom.<br />
• At the beginning of the school year, establish<br />
consequences for students who behave in an<br />
unsafe manner. Make these consequences clear<br />
to students.<br />
• Do not overlook any violation of a safety practice,<br />
no matter how minor. If a rule is broken,<br />
take steps to ensure that the infraction will not<br />
occur a second time.<br />
• Set a good example by observing all safety practices.<br />
This includes wearing eye protection during<br />
all investigations when eye protection is<br />
required for the students.<br />
• Know <strong>and</strong> follow waste-disposal regulations.<br />
• Be aware of students who have allergies or other<br />
medical conditions that might limit their ability<br />
to participate in activities. Consult with the<br />
school nurse or school administrator.<br />
• Anticipate potential problems. When planning<br />
teacher demonstrations or student investigations,<br />
identify potential hazards <strong>and</strong> safety concerns.<br />
Be aware of what might go wrong <strong>and</strong><br />
what can be done to prevent the worst-case scenario.<br />
Before each activity, verbally alert students<br />
to the potential hazards <strong>and</strong> distribute<br />
specific safety instructions.<br />
• Supervise students at all times during a h<strong>and</strong>son<br />
activity.<br />
• Provide sufficient time for students to set up<br />
the equipment, perform the investigation, <strong>and</strong><br />
properly clean up <strong>and</strong> store the materials after<br />
use.<br />
• Never assume that students know or remember<br />
safety rules or practices from their previous science<br />
classes.<br />
How Can Controversial Topics<br />
Be H<strong>and</strong>led in the Classroom?<br />
Teachers sometimes feel that the discussion of values<br />
is inappropriate in the science classroom or<br />
that it detracts from the learning of “real” science.<br />
The lessons in this module, however, are based<br />
upon the conviction that there is much to be<br />
gained by involving students in analyzing issues<br />
of science, technology, <strong>and</strong> society. Society expects<br />
all citizens to participate in the democratic<br />
process, <strong>and</strong> our educational system must provide<br />
opportunities for students to learn to deal with<br />
14
contentious issues with civility, objectivity, <strong>and</strong><br />
fairness. Likewise, students need to learn that science<br />
intersects with life in many ways.<br />
In this module, students have a variety of opportunities<br />
to discuss, interpret, <strong>and</strong> evaluate basic<br />
science <strong>and</strong> health issues, some in the light of values<br />
<strong>and</strong> ethics. As students encounter issues about<br />
which they feel strongly, some discussions might<br />
become controversial. How much controversy<br />
develops will depend on many factors, such as<br />
how similar the students are with respect to<br />
socioeconomic status, perspectives, value systems,<br />
<strong>and</strong> religious preferences. In addition, the<br />
language <strong>and</strong> attitude of the teacher factor <strong>into</strong> the<br />
flow of ideas <strong>and</strong> the quality of exchange among<br />
the students.<br />
The following guidelines may help teachers facilitate<br />
discussions that balance factual information<br />
with feelings.<br />
• Remain neutral. Neutrality may be the single<br />
most important characteristic of a successful<br />
discussion facilitator.<br />
• Encourage students to discover as much information<br />
about the issue as possible.<br />
• Keep the discussion relevant <strong>and</strong> moving forward<br />
by questioning or posing appropriate<br />
problems or hypothetical situations. Encourage<br />
everyone to contribute, but do not force reluctant<br />
students <strong>into</strong> the discussion.<br />
• Emphasize that everyone must be open to hearing<br />
<strong>and</strong> considering diverse views.<br />
• Use unbiased questioning to help students critically<br />
examine all views presented.<br />
• Allow for the discussion of all feelings <strong>and</strong><br />
opinions.<br />
• Avoid seeking consensus on all issues. The multifaceted<br />
issues that students discuss result in<br />
the presentation of divergent views, <strong>and</strong> students<br />
should learn that this is acceptable.<br />
• Acknowledge all contributions in the same<br />
evenh<strong>and</strong>ed manner. If a student seems to be<br />
saying something for its shock value, see<br />
whether other students recognize the inappropriate<br />
comment <strong>and</strong> invite them to respond.<br />
• Create a sense of freedom in the classroom.<br />
Remind students, however, that freedom implies<br />
the responsibility to exercise that freedom in<br />
ways that generate positive results for all.<br />
• Insist upon a nonhostile environment in the<br />
classroom. Remind students to respond to ideas<br />
in-stead of to the individuals presenting those<br />
ideas.<br />
• Respect silence. Reflective discussions are often<br />
slow. If a teacher breaks the silence, students may<br />
allow the teacher to dominate the discussion.<br />
• At the end of the discussion, ask students to<br />
summarize the points that they <strong>and</strong> their classmates<br />
have made. Respect students regardless of<br />
their opinion about any controversial issue.<br />
15<br />
Implementing the Module
Using the<br />
Student LessonsL<br />
The heart of this module is the set of six classroom<br />
lessons that follow. These lessons are the vehicles<br />
that we hope will carry to your students important<br />
concepts related to alcohol use <strong>and</strong> its effects on<br />
mind <strong>and</strong> body. To review the concepts in detail,<br />
refer to the chart Conceptual Flow of the Lessons,<br />
on page 9.<br />
Format of the Lessons<br />
As you scan the lessons, you will find that each<br />
contains several major features.<br />
At a Glance gives the teacher a convenient summary<br />
of the lesson.<br />
• The Overview provides a short summary of student<br />
activities.<br />
• The Major Concepts section states the central<br />
idea(s) the lesson is designed to convey.<br />
• Objectives lists specific underst<strong>and</strong>ings or abilities<br />
students should have after completing the<br />
lesson.<br />
• Teacher Background specifies which sections of<br />
the Information about <strong>Alcohol</strong> reading relate<br />
directly to the student lesson. This reading<br />
material provides the teacher with the science<br />
content that underlies the key concepts covered<br />
in the lesson. The information provided is not<br />
intended to form the basis of lectures to students.<br />
Instead, it enhances the teacher’s underst<strong>and</strong>ing<br />
of the content so that he or she can<br />
more accurately facilitate class discussions,<br />
answer student questions, <strong>and</strong> provide additional<br />
examples.<br />
In Advance provides instructions for collecting<br />
<strong>and</strong> preparing the materials required to complete<br />
the activities in the lesson.<br />
• Web-Based Activities tells the teacher which of<br />
the lesson’s activities use the <strong>Underst<strong>and</strong>ing</strong><br />
<strong>Alcohol</strong> Web site as the basis for instruction.<br />
• Photocopies lists the paper copies or transparencies<br />
that need to be made from masters,<br />
which follow the student lesson.<br />
• Materials lists all the materials other than photocopies<br />
needed for each of the activities in the<br />
lesson.<br />
• Preparation outlines the things the teacher<br />
needs to do to be ready to teach each of the<br />
activities in the lesson.<br />
Procedure outlines the steps in each activity in the<br />
lesson. It provides implementation suggestions<br />
<strong>and</strong> answers to questions.<br />
Within the procedures, annotations provide additional<br />
commentary.<br />
• Tip from the field test includes actual field-test<br />
teachers’ suggestions for teaching strategies,<br />
class management, <strong>and</strong> module implementation.<br />
• Assessment provides you with strategies for<br />
assessing student progress throughout the module<br />
<strong>and</strong> is identified by an assessment icon (see<br />
page 18).<br />
• Icons identify specific annotations:<br />
identifies teaching strategies that<br />
address specific science content st<strong>and</strong>ards<br />
as defined by the National Science<br />
Education St<strong>and</strong>ards.<br />
identifies when to use the World<br />
Wide Web site as part of the teaching<br />
strategies. Instructions tell you how<br />
to access the appropriate site. Information<br />
about using the Web site can be found in<br />
Using the Web Site (see page 19). A print-based<br />
alternative to Web activities is provided in case a<br />
computer with Internet access is not available.<br />
17
<strong>Underst<strong>and</strong>ing</strong> <strong>Alcohol</strong>: <strong>Investigations</strong> <strong>into</strong> <strong>Biology</strong> <strong>and</strong> <strong>Behavior</strong><br />
identifies a print-based alternative to a<br />
Web-based activity to be used when<br />
computers are not available.<br />
identifies when assessment is embedded<br />
in the module’s structure. An<br />
annotation suggests strategies for<br />
assessment.<br />
Lesson Organizer provides a brief summary of the<br />
lesson. It outlines procedural steps for each activity<br />
<strong>and</strong> includes icons that denote where in each activity<br />
masters, transparencies, <strong>and</strong> the Web site are<br />
used. The lesson organizer is intended to be a memory<br />
aid for you to use only after you become famil-<br />
iar with the detailed procedures for the activities. It<br />
can be a h<strong>and</strong>y resource during lesson preparation<br />
as well as during classroom instruction.<br />
The Masters required to teach the activities are<br />
located at the end of each lesson.<br />
Timeline for the Module<br />
The timeline (below) outlines the optimal plan for<br />
completing the six lessons in this module. The<br />
plan assumes you will teach the lessons on consecutive<br />
days. If your class requires more time for<br />
completing the procedures, discussing issues<br />
raised in this module, or completing activities on<br />
the Web site, adjust your timeline accordingly.<br />
Suggested Timeline<br />
Timeline<br />
3 weeks ahead<br />
1 week ahead<br />
Day 1<br />
Monday<br />
Day 2<br />
Tuesday<br />
Day 3<br />
Wednesday<br />
Day 4<br />
Thursday<br />
Day 5<br />
Friday<br />
Day 6<br />
Monday<br />
Day 7<br />
Tuesday<br />
Activity<br />
Reserve computers<br />
Check performance of Web site<br />
Copy masters<br />
Make transparencies<br />
Gather materials<br />
Lesson 1<br />
Activity 1: What’s Up with This Mouse?<br />
Activity 2: <strong>Alcohol</strong>—Separating Fact from Fiction<br />
Lesson 2<br />
Activity 1: What Is a Drink?<br />
Activity 2: Where Does <strong>Alcohol</strong> Go in the Body?<br />
Lesson 3<br />
Activity 1: Gathering Data<br />
Activity 2: Data Analysis <strong>and</strong> Discussion<br />
Lesson 4<br />
Activity 1: To Drink or Not to Drink?<br />
Activity 2: Modeling <strong>Alcohol</strong> Use <strong>and</strong> Abuse<br />
Activity 3: Modeling <strong>Alcohol</strong> Abuse <strong>and</strong> <strong>Alcohol</strong>ism<br />
Activity 4: Applying the Model<br />
Lesson 5<br />
Activity 1: Patterns of Drinking<br />
Activity 2: <strong>Alcohol</strong> <strong>and</strong> Driving <strong>Behavior</strong><br />
Lesson 6<br />
Activity 1: <strong>Alcohol</strong>—Risks <strong>and</strong> Consequences<br />
Activity 2: How Much Have You Learned about <strong>Alcohol</strong>?<br />
18
Using the<br />
Web Site<br />
The <strong>Underst<strong>and</strong>ing</strong> <strong>Alcohol</strong>: <strong>Investigations</strong> <strong>into</strong><br />
<strong>Biology</strong> <strong>and</strong> <strong>Behavior</strong> Web site is a tool, like an<br />
overhead projector or a textbook, that can help<br />
you organize the use of the module, engage student<br />
interest in learning, <strong>and</strong> orchestrate <strong>and</strong><br />
individualize instruction. The Web site features<br />
videos, animations, <strong>and</strong> simulations that enhance<br />
two of the module’s lessons.<br />
Hardware/Software Requirements<br />
The Web site can be accessed from Apple Mac<strong>into</strong>sh<br />
<strong>and</strong> IBM-compatible personal computers.<br />
Links to download the Macromedia Flash <strong>and</strong><br />
QuickTime Player plug-ins are provided on the<br />
Web site main page. The minimum hardware <strong>and</strong><br />
software requirements to use the Web site are<br />
listed in the table below.<br />
To access the Web site, type the following URL<br />
<strong>into</strong> your browser: http://science.education.nih.gov/<br />
supplements/alcohol/teacher.<br />
Getting the Most out of the Web Site<br />
Before you use this Web site, or any other piece of<br />
instructional software in your classroom, it may<br />
be valuable to identify some of the benefits you<br />
Minimum Hardware/Software Requirements for Using the Web Site<br />
CPU/Processor (PC Intel, Mac)<br />
Pentium 333 MHz, Power PC or faster<br />
Operating system (DOS/Windows, Mac OS) Windows 95/98/2000 or Mac OS 7<br />
System memory (RAM)<br />
Screen display<br />
Browser<br />
Browser settings<br />
Free hard drive space<br />
Connection speed<br />
Plug-ins<br />
Audio<br />
64 MB or more<br />
800 x 600, 16 bit (65K colors)<br />
Microsoft Internet Explorer 5.5 or<br />
Netscape Communicator 4.75 <strong>and</strong> higher<br />
JavaScript enabled<br />
10 MB<br />
56 kbps<br />
Macromedia Flash Player (version 6 <strong>and</strong> higher)<br />
<strong>and</strong> QuickTime Player (version 5 <strong>and</strong> higher)<br />
Sound card with speakers<br />
19
<strong>Underst<strong>and</strong>ing</strong> <strong>Alcohol</strong>: <strong>Investigations</strong> <strong>into</strong> <strong>Biology</strong> <strong>and</strong> <strong>Behavior</strong><br />
Web Activities for Students<br />
with Disabilities<br />
The Office of Science Education (OSE) is committed<br />
to providing access to the Curriculum<br />
Supplement Series for individuals with disabilities,<br />
including members of the public <strong>and</strong> federal<br />
employees. To meet this commitment, we will<br />
comply with the requirements of Section 508 of<br />
the Rehabilitation Act. Section 508 requires that<br />
individuals with disabilities who are members of<br />
the public seeking these materials will have access<br />
to <strong>and</strong> use of information <strong>and</strong> data that are comparable<br />
to those provided to members of the pubexpect<br />
it to provide. Well-designed instructional<br />
multimedia software can<br />
• motivate students by helping them enjoy learning<br />
<strong>and</strong> want to learn more because it enlivens<br />
content that students otherwise might find<br />
uninteresting;<br />
• offer unique instructional capabilities that allow<br />
students to explore topics in greater depth <strong>and</strong><br />
in ways that are closer to actual field experience<br />
than print-based resources can offer;<br />
• provide teachers with support for experimenting<br />
with new instructional approaches that<br />
allow students to work independently or in<br />
small teams <strong>and</strong> that give teachers increased<br />
credibility among today’s technology-literate<br />
students; <strong>and</strong><br />
• increase teacher productivity by helping them<br />
with assessment, record keeping, <strong>and</strong> classroom<br />
planning <strong>and</strong> management.<br />
The ideal use of the Web site requires one computer<br />
for each student team. However, if you have<br />
only one computer available, you can still use the<br />
Web site (for example, by using a suitable device<br />
for projecting the screen image, or by rotating student<br />
teams through the computer station). If you<br />
do not have the facilities for using the Web site<br />
with your students, you can use the print-based<br />
alternatives provided for those lessons.<br />
Collaborative Groups<br />
Many of the activities in the lessons are designed<br />
to be completed by teams of students working<br />
together. Although individual students working<br />
alone can complete these activities, this strategy<br />
will not stimulate the types of student-student<br />
interactions that are one of the goals of active, collaborative,<br />
inquiry-based learning. Therefore, we<br />
recommend that you organize collaborative teams<br />
of two to four students each, depending on the<br />
number of computers available. Students in<br />
groups larger than this will have difficulty organizing<br />
the student-computer interactions equitably,<br />
which can lead to one or two students’ assuming<br />
the primary responsibility for the computer-based<br />
work. Although this type of arrangement can be<br />
efficient, it means that some students do not get<br />
the opportunity to experience the in-depth dis-<br />
covery <strong>and</strong> analysis that the Web site was<br />
designed to stimulate.<br />
We recommend that you keep your students in<br />
the same collaborative teams for all the activities<br />
in the lessons. This will allow each team to<br />
develop a shared experience with the Web site <strong>and</strong><br />
with the ideas <strong>and</strong> issues that the activities present.<br />
A shared experience will also enhance your<br />
students’ perceptions of the lessons as a conceptual<br />
whole.<br />
If your student-to-computer ratio is greater than<br />
four students to one computer, then you will need<br />
to change the way you teach the module from the<br />
instructions in the lessons. For example, if you<br />
have only one computer available, you may want<br />
students to complete the Web-based work across<br />
an extended time period. You can do this in several<br />
ways. The most practical way is to use your<br />
computer as a center along with several other centers<br />
at which students complete other activities. In<br />
this approach, students rotate through the computer<br />
center, eventually completing the Webbased<br />
work that you have assigned.<br />
A second way to structure the lessons if you only<br />
have one computer available is to use a projection<br />
system to display the computer monitor onto a<br />
screen for the whole class to view. Giving selected<br />
students in the class the opportunity to manipulate<br />
the Web activities in response to suggestions<br />
from the class can give students some of the same<br />
type of autonomy in their learning that they<br />
would gain from working in small teams.<br />
20
lic who are not individuals with disabilities. The<br />
online versions of this series have been prepared<br />
to comply with Section 508.<br />
If you use assistive technology (such as a Braille<br />
reader or a screen reader) <strong>and</strong> the format of any<br />
material on our Web sites interferes with your<br />
ability to access the information, please use the<br />
following points of contact for assistance. To<br />
enable us to respond in a manner most helpful to<br />
you, please indicate the nature of your accessibil-<br />
ity problem, the format in which you would prefer<br />
to receive the material, the Web address of the<br />
requested material, <strong>and</strong> your contact information.<br />
Contact us at<br />
Curriculum Supplement Series<br />
Office of Science Education<br />
National Institutes of Health<br />
6705 Rockledge Drive, Suite 700 MSC 7984<br />
Bethesda, MD 20892-7984<br />
ose@science.education.nih.gov<br />
<strong>Underst<strong>and</strong>ing</strong> <strong>Alcohol</strong>: <strong>Investigations</strong> <strong>into</strong> <strong>Biology</strong> <strong>and</strong> <strong>Behavior</strong> 508-Compliant Web Activities<br />
Lesson,<br />
activity<br />
Lesson 1, Activity 1:<br />
What’s Up With This<br />
Mouse?<br />
Lesson 3, Activity 1:<br />
Gathering Data,<br />
Study 1—Effect of<br />
<strong>Alcohol</strong> Dose on<br />
Mouse Activity;<br />
Study 2—Effect of<br />
Time on <strong>Alcohol</strong><br />
Response; Study 3—<br />
Effect of Genetics<br />
on <strong>Alcohol</strong><br />
Response<br />
Lesson 5, Activity 2:<br />
<strong>Alcohol</strong> <strong>and</strong> Driving<br />
<strong>Behavior</strong><br />
For students with hearing impairment<br />
No special considerations are required.<br />
Students may click on the closedcaptioning<br />
icon to view the captioning<br />
for the activity’s introduction.<br />
The closed-captioning icon is located<br />
in the top left corner of the animation.<br />
The text appears at the bottom of the<br />
animation.<br />
The individual studies do not have<br />
captioning.<br />
No special considerations are required.<br />
For students with sight impairment<br />
With a screen reader, students are presented<br />
with two buttons, “mouse 1”<br />
<strong>and</strong> “mouse 2.” Each button will play a<br />
video with descriptive narration.<br />
Using a screen reader, students are<br />
able to navigate to each study. Within<br />
each study, a sound effect is heard<br />
each time a mouse crosses a grid<br />
line. Students must count the number<br />
of sound effects to arrive at the<br />
number of grid lines crossed by the<br />
mouse.<br />
Supervision is recommended.<br />
With a screen reader, students are<br />
presented with two buttons, “Simulation<br />
A” <strong>and</strong> “Simulation B.” Each button<br />
will play a video with descriptive<br />
narration. The narration describes the<br />
major activities that occur during each<br />
simulation. After hearing each description,<br />
students will be able to easily<br />
determine which driver is under the<br />
influence of alcohol. Be sure to have<br />
students relate each of the <strong>into</strong>xicated<br />
driver’s actions to the specific effects<br />
of alcohol on the body.<br />
21<br />
Using the Web Site
Information<br />
about <strong>Alcohol</strong><br />
Figure 1. <strong>Alcohol</strong><br />
has been part of<br />
societies for thous<strong>and</strong>s<br />
of years, as<br />
shown by this representation<br />
of the<br />
ancient Greek god of<br />
grape growing <strong>and</strong><br />
wines, Bacchus.<br />
1 Introduction<br />
<strong>Alcohol</strong> has been used for centuries in social,<br />
medical, cultural, <strong>and</strong> religious settings. Most<br />
Americans believe alcohol can be used responsibly<br />
by adults for social <strong>and</strong> religious purposes.<br />
However, alcohol can also be used to excess<br />
resulting in health, social, legal, <strong>and</strong> other problems.<br />
Students may receive conflicting messages<br />
about alcohol from the news media, school, their<br />
friends, <strong>and</strong> their parents. On the one h<strong>and</strong>, they<br />
hear that moderate alcohol use is acceptable, <strong>and</strong><br />
in some instances may actually be good for your<br />
health; on the other h<strong>and</strong>, they are told that alcohol<br />
is a drug that requires abstinence until age 21.<br />
In addition, advertisements <strong>and</strong> media images<br />
often present alcohol as a means to success <strong>and</strong> an<br />
enjoyable life. These conflicting messages, combined<br />
with misunderst<strong>and</strong>ings <strong>and</strong> misinformation,<br />
do not help students make responsible<br />
decisions about alcohol use.<br />
Statistics indicate that many adolescents begin consuming<br />
alcohol at an early age. In 1997, 26 percent<br />
of eighth graders, 40 percent of 10th graders, <strong>and</strong><br />
51 percent of 12th graders reported consuming<br />
alcohol within the month prior to the survey. 43 In<br />
addition, 16 percent of eighth graders reported<br />
binge drinking within the two weeks leading up to<br />
the survey. The effects of adolescent drinking<br />
involve both health- <strong>and</strong> safety-related problems,<br />
including auto crashes, domestic violence, <strong>and</strong> suicide.<br />
<strong>Alcohol</strong> abuse among teenagers may also be<br />
related to behavioral problems linked to impulsiveness<br />
<strong>and</strong> sensation seeking. 55 Youth alcohol-use<br />
data indicate that the earlier an individual begins<br />
drinking, the greater his or her risk of developing<br />
alcohol-use problems in the future. Individuals<br />
who begin drinking before age 15 are four times<br />
more likely to develop alcohol dependence during<br />
their lifetimes than are those who begin drinking at<br />
24, 25<br />
age 21.<br />
The earlier an individual begins<br />
drinking, the greater his or her<br />
risk of developing alcohol-related<br />
problems in the future.<br />
Dr. Enoch Gordis, former Director of the National<br />
Institute on <strong>Alcohol</strong> Abuse <strong>and</strong> <strong>Alcohol</strong>ism<br />
(NIAAA), has written, “Although alcohol is sometimes<br />
referred to as a ‘gateway drug’ for youth<br />
because its use often precedes the use of other<br />
illicit substances, this terminology is counterproductive;<br />
youth drinking requires significant attention,<br />
not because of what it leads to, but because<br />
of the extensive human <strong>and</strong> economic impact of<br />
alcohol use by this vulnerable population.” 43<br />
23
<strong>Underst<strong>and</strong>ing</strong> <strong>Alcohol</strong>: <strong>Investigations</strong> <strong>into</strong> <strong>Biology</strong> <strong>and</strong> <strong>Behavior</strong><br />
The purpose of this supplement is to present students<br />
with the opportunity to learn about the science<br />
underlying the effects of alcohol on human<br />
biology <strong>and</strong> behavior through a series of inquirybased<br />
classroom lessons. Young people are natural<br />
scientists. They have a curiosity about the world<br />
around them <strong>and</strong> about themselves as individuals.<br />
Since they have little in the way of life experiences,<br />
many young people tend to view themselves<br />
as nearly invincible. Consequently, when<br />
adults caution them against engaging in risky<br />
behaviors such as drinking alcohol, some don’t<br />
listen. They feel that such warnings aren’t for<br />
them <strong>and</strong> apply only to those less grown up than<br />
themselves.<br />
The aim of this supplement is to give students the<br />
opportunity to construct their own underst<strong>and</strong>ing<br />
about alcohol <strong>and</strong> its attendant risks. In addition,<br />
the inquiry-based lessons are designed to help students<br />
hone their critical-thinking skills. With<br />
enhanced underst<strong>and</strong>ing <strong>and</strong> skills, they will be<br />
better prepared to make informed decisions about<br />
real-life situations involving alcohol use.<br />
2 <strong>Alcohol</strong> Use, Abuse, <strong>and</strong> <strong>Alcohol</strong>ism:<br />
Definitions<br />
In any discussion of alcohol use, it is crucial to<br />
begin with a clear underst<strong>and</strong>ing of terms. For the<br />
purposes of this module, we define alcohol use by<br />
adults as the consumption of alcohol for social or<br />
Table 1. Characteristics of <strong>Alcohol</strong> Abuse 55<br />
failing to fulfill major work, school, or home<br />
responsibilities<br />
drinking in situations that are potentially dangerous,<br />
such as driving a car or operating<br />
heavy machinery<br />
experiencing repeated alcohol-related legal<br />
problems, such as being arrested for driving<br />
while <strong>into</strong>xicated<br />
exhibiting continued drinking despite having<br />
relationship problems that are caused or<br />
made worse by drinking<br />
Table 2. Characteristics of <strong>Alcohol</strong>ism 55<br />
craving (a strong need or compulsion to drink)<br />
impaired control over drinking<br />
use <strong>and</strong> abuse of alcohol despite adverse<br />
consequences<br />
failure to acknowledge the problem<br />
tolerance or need for increasing amounts of<br />
alcohol to feel <strong>into</strong>xicated<br />
physical dependence or the occurrence of<br />
withdrawal symptoms when alcohol use is<br />
discontinued<br />
religious purposes without demonstrating the<br />
characteristics of alcohol abuse or alcoholism (see<br />
Tables 1 <strong>and</strong> 2). <strong>Alcohol</strong> abuse is defined as the<br />
continued use of alcohol despite the development<br />
of social, legal, or health problems. It is important<br />
to note that any alcohol use by underage youth is<br />
considered to be alcohol abuse.<br />
Any alcohol use by underage<br />
youth is considered to<br />
be alcohol abuse.<br />
In contrast, alcoholism, also known as alcohol<br />
dependence syndrome or alcohol addiction, is a<br />
chronic disease involving a strong need to drink,<br />
the inability to stop drinking, the occurrence of<br />
withdrawal symptoms, <strong>and</strong> tolerance (see Table<br />
2). <strong>Alcohol</strong>ism is often progressive.<br />
<strong>Alcohol</strong> abuse is not equivalent to alcoholism. A<br />
person who abuses alcohol may drink excessive<br />
amounts but does not experience an alcoholic<br />
individual’s intense cravings or severe withdrawal<br />
symptoms (physical dependence) when drinking<br />
stops. Susceptibility factors that contribute to<br />
alcoholism are genetic, environmental, <strong>and</strong> psychosocial.<br />
Thus, while not all people who abuse<br />
alcohol become alcoholics, those with genetic susceptibility<br />
factors who place themselves in environments<br />
that encourage drinking put themselves<br />
at risk for developing alcoholism.<br />
24
The definitions of alcohol abuse <strong>and</strong> alcoholism<br />
described above do not directly apply to youth<br />
drinking. As previously noted, any alcohol drinking<br />
by underage youth is considered to be alcohol<br />
abuse. Youth who abuse alcohol typically do so by<br />
drinking often, 43 or engaging in binge drinking,<br />
which is commonly defined as drinking five or<br />
more drinks in a row. Such drinking patterns put<br />
youth at increased risk for developing alcoholism<br />
later in life. Research suggests that separate criteria<br />
may be needed to distinguish between alcohol<br />
abuse <strong>and</strong> alcoholism in youth as compared with<br />
adults. 34, 43 Table 3 lists some of the risk factors<br />
associated with youth drinking.<br />
Table 3. Risk Factors for Youth Drinking 55<br />
genetic factors (based on animal <strong>and</strong> human<br />
twin studies)<br />
childhood behaviors such as impulsiveness,<br />
aggressiveness, <strong>and</strong> antisocial behavior<br />
psychiatric disorders such as attention deficit<br />
hyperactivity disorder <strong>and</strong> depression<br />
family environments with favorable attitudes<br />
about drinking <strong>and</strong> lack of support<br />
acceptance of drinking by peers<br />
child abuse <strong>and</strong> trauma<br />
3 Misconceptions about <strong>Alcohol</strong> Use,<br />
Abuse, <strong>and</strong> <strong>Alcohol</strong>ism<br />
Generally, textbooks for middle school students<br />
present little, if any, scientific information on how<br />
alcohol affects cell function <strong>and</strong> animal behavior.<br />
If the subject is covered at all, it is likely done in a<br />
health class, or possibly in a driver’s education<br />
class. Much of what students know, or think they<br />
know, comes through family, peers, the media,<br />
<strong>and</strong> personal experimentation. Very often this<br />
information is characterized by errors, half-truths,<br />
<strong>and</strong> folk wisdom. Students need to underst<strong>and</strong> the<br />
changes that occur in their minds <strong>and</strong> bodies<br />
when they drink alcohol. They also need to<br />
underst<strong>and</strong> that if they choose to drink, there can<br />
be both short-term (acute) <strong>and</strong> long-term<br />
(chronic) consequences, even with moderate levels<br />
of drinking. The materials contained in this<br />
curriculum supplement, <strong>Underst<strong>and</strong>ing</strong> <strong>Alcohol</strong>:<br />
<strong>Investigations</strong> <strong>into</strong> <strong>Biology</strong> <strong>and</strong> <strong>Behavior</strong>, should at<br />
least help correct the following misconceptions.<br />
Even moderate levels of alcohol use can lead to<br />
both short-term <strong>and</strong> long-term consequences.<br />
Misconception 1: <strong>Alcohol</strong> is a stimulant.<br />
<strong>Alcohol</strong> has been falsely thought of as a stimulant<br />
because its initial effects on some people include<br />
feelings of euphoria <strong>and</strong> lowered inhibitions.<br />
<strong>Alcohol</strong> is classified correctly as a depressant<br />
because it later causes sedation <strong>and</strong> drowsiness. 30<br />
In high concentrations, alcohol can induce<br />
unconsciousness, coma, <strong>and</strong> even death.<br />
Misconception 2: <strong>Alcohol</strong> abuse <strong>and</strong> alcoholism<br />
are problems only for the individual drinker.<br />
<strong>Alcohol</strong> abuse <strong>and</strong> alcoholism are social problems<br />
that touch many more lives than that of the individual<br />
drinker. <strong>Alcohol</strong> abuse is a contributing<br />
factor to many other social problems including<br />
auto crashes, domestic violence, <strong>and</strong> child abuse<br />
or neglect. In addition to the personal costs, alcoholism<br />
also has a severe economic impact on the<br />
country due to lost productivity, healthcare treatment,<br />
<strong>and</strong> costs attendant to administering the<br />
criminal justice system.<br />
Misconception 3: People with alcoholism are<br />
morally weak individuals lacking will power.<br />
<strong>Alcohol</strong>ism involves more than just drinking too<br />
much. It is known to be a complex disease that<br />
involves a variety of factors including genetic,<br />
environmental, social, <strong>and</strong> behavioral components.<br />
The physical dependence of alcoholics on<br />
drinking defines alcoholism as a disease that must<br />
be diagnosed, <strong>and</strong> as separate from alcohol abuse<br />
(see 2 <strong>Alcohol</strong> Use, Abuse <strong>and</strong> <strong>Alcohol</strong>ism: Definitions).<br />
In alcoholic individuals, the brain is<br />
affected by alcohol <strong>and</strong> promotes its continued<br />
use through both positive <strong>and</strong> negative reinforcements.<br />
Most notably, the severe physical withdrawal<br />
symptoms that result from stopping<br />
drinking serve as a strong biological force that can<br />
maintain drinking behavior.<br />
25<br />
Information about <strong>Alcohol</strong>
<strong>Underst<strong>and</strong>ing</strong> <strong>Alcohol</strong>: <strong>Investigations</strong> <strong>into</strong> <strong>Biology</strong> <strong>and</strong> <strong>Behavior</strong><br />
<strong>Alcohol</strong>ism is a complex disease that<br />
involves a variety of factors including<br />
genetic, environmental, social, <strong>and</strong><br />
behavioral components.<br />
Misconception 4: Children cannot be alcoholics.<br />
<strong>Alcohol</strong> is the most used <strong>and</strong> abused drug among<br />
young people. A recent national poll reports that<br />
one in four eighth graders drank alcohol in the<br />
past month, <strong>and</strong> 18 percent of eighth graders got<br />
drunk at least once in the past year. 46 Research<br />
using animal models suggests that the developing<br />
brain of the adolescent responds differently to<br />
alcohol than does the adult brain. 31, 59 Children<br />
who abuse alcohol may develop alcoholism,<br />
though the criteria for making the diagnosis may<br />
be different from those used to diagnose adults. 34<br />
Misconception 5: Small amounts of alcohol won’t<br />
impair bodily or mental functions.<br />
Half of the states in the United States have set the<br />
legal limit for blood alcohol concentration (BAC)<br />
at 0.08 percent for motor vehicle operation. (BAC<br />
is usually expressed without “percent.”) This does<br />
not mean, however, that an individual is unimpaired<br />
at lower BACs. A BAC of 0.02–0.04 can<br />
impair memory <strong>and</strong> judgment. 51 The effects of<br />
alcohol on an individual vary depending on the<br />
person’s weight, nutritional state, gender, exposure<br />
to other drugs, <strong>and</strong> other factors. Any<br />
amount of alcohol taken during pregnancy is considered<br />
risky.<br />
Misconception 6: <strong>Alcohol</strong>’s effects are<br />
only temporary.<br />
The adult body can process approximately one<br />
drink per hour. A drink, according to the National<br />
Institute on <strong>Alcohol</strong> Abuse <strong>and</strong> <strong>Alcohol</strong>ism<br />
(NIAAA), is one 12-ounce bottle of wine cooler or<br />
beer, one 5-ounce glass of wine, or 1.5 ounces of<br />
80-proof distilled liquor. 42 A significant portion of<br />
the societal costs of alcohol use (for example,<br />
falls, automobile crashes, <strong>and</strong> violence) is due to<br />
acute effects. <strong>Alcohol</strong> users <strong>and</strong> abusers, as well as<br />
alcoholics, can suffer injuries related to the acute<br />
effects of alcohol. Although the acute effects of<br />
alcohol last only a short time, chronic long-term<br />
effects can develop <strong>and</strong> persist. Adolescents <strong>and</strong><br />
adults who drink excessive amounts of alcohol<br />
may be causing chronic alterations to their brains.<br />
A recent study provides evidence that heavy<br />
drinking among teenagers can impair brain function.<br />
7 It is not yet known if these effects are<br />
reversible.<br />
Figure 2. A drink can be one 12-ounce beer, one<br />
5-ounce glass of wine, or 1.5 ounces of 80-proof<br />
distilled liquor.<br />
Misconception 7: <strong>Alcohol</strong> is good for your health.<br />
Recent reports have indicated that moderate<br />
drinking (defined as one drink per day for women<br />
<strong>and</strong> two drinks per day for men) may lessen the<br />
risk for cardiovascular disease. 44 These observations,<br />
however, do not give carte blanche for<br />
drinking alcohol. In considering such findings, it<br />
is important to weigh the benefits versus the risks.<br />
Although moderate drinking is associated with<br />
decreased risk for heart disease, it is also associated<br />
with increased risk of accidents. Drinking<br />
five or more drinks per day leads to increased<br />
risks for stroke <strong>and</strong> cancer. In addition, pregnant<br />
women, people using certain medications, <strong>and</strong><br />
those diagnosed with alcoholism or other medical<br />
problems should refrain from drinking entirely.<br />
Misconception 8: <strong>Alcohol</strong>ism can be cured by<br />
behavioral programs such as <strong>Alcohol</strong>ics<br />
Anonymous.<br />
<strong>Alcohol</strong>ism, at present, has no known cure. However,<br />
as with other chronic diseases, such as dia-<br />
26
etes or heart disease, alcoholism can be controlled<br />
effectively using behavioral therapies, with<br />
or without pharmacological therapies. For such<br />
treatments to be effective, however, the patient<br />
must be willing to make significant <strong>and</strong> permanent<br />
lifestyle changes. People being treated for<br />
alcoholism often experience one or more episodes<br />
of relapse. An important aspect of behavioral<br />
therapy is to help patients deal with such relapses<br />
<strong>and</strong> motivate them to continue their efforts to<br />
remain sober.<br />
cal studies are helping us better underst<strong>and</strong> the<br />
social effects of alcohol consumption. The results<br />
of these studies, “from cell to society,” yield essential<br />
knowledge that is a prerequisite for moreeffective<br />
ways to prevent <strong>and</strong> treat this disease.<br />
4 Animals as Research Models<br />
Much of the research <strong>into</strong> the effects of alcohol on<br />
humans uses animals. Scientists use animals when<br />
the use of humans is either impractical or unethical.<br />
For example, when scientists investigate fetal<br />
alcohol syndrome, they cannot give alcohol to<br />
pregnant women but they can give alcohol to<br />
pregnant animals.<br />
Scientific research with animals has contributed to<br />
many important advances in scientific <strong>and</strong> medical<br />
knowledge. When using animal models, scientists<br />
first must choose an animal appropriate to<br />
their research. Scientists studying genetics often<br />
use fruit flies (Drosophila melanogaster) because<br />
they have a short generation time. However, fruit<br />
flies are not a good model to use when investigating<br />
aspects of mammalian physiology. In such<br />
cases, a mouse or rat is preferred.<br />
Figure 3. <strong>Behavior</strong>al therapy helps patients deal<br />
with relapse <strong>and</strong> motivates them to continue with<br />
their efforts to remain sober.<br />
Misconception 9: The public knows enough about<br />
the effects of alcohol use; further research is not<br />
necessary.<br />
It is true that we do know many of the behavioral<br />
effects of alcohol consumption, such as memory<br />
<strong>and</strong> motor function impairment. Nonetheless, we<br />
do not know how alcohol creates its addictive<br />
actions. Research continues to provide insight<br />
<strong>into</strong> how alcohol acts on all cells of the body <strong>and</strong><br />
affects their functions. New scientific approaches<br />
help scientists underst<strong>and</strong> more about the biological<br />
<strong>and</strong> behavioral effects of alcohol. One<br />
approach uses knockout mice (mice with a specific<br />
gene deleted) to identify genes that predispose<br />
a person to alcoholism. New imaging<br />
techniques enable scientists to see alcohol’s effects<br />
in the living brain. In addition, various sociologi-<br />
Figure 4. Mice are a useful model for studying the<br />
effects of alcohol.<br />
Animal models do have their drawbacks. Some<br />
animals are difficult or expensive to maintain.<br />
Consequently, many scientists try to develop<br />
nonanimal models using cell cultures or computer<br />
simulations. Unfortunately, such models usually<br />
fail to duplicate the complexity of the animal or<br />
human body. Medical <strong>and</strong> scientific research will<br />
continue to depend on animal models for the<br />
27<br />
Information about <strong>Alcohol</strong>
<strong>Underst<strong>and</strong>ing</strong> <strong>Alcohol</strong>: <strong>Investigations</strong> <strong>into</strong> <strong>Biology</strong> <strong>and</strong> <strong>Behavior</strong><br />
foreseeable future (see The Use of Animals in Scientific<br />
Research below).<br />
5 <strong>Alcohol</strong>: Pharmacokinetics<br />
Because of its legal status <strong>and</strong> prevalence in society,<br />
alcohol should be considered apart from other<br />
drugs. The term drug is not always easy to define.<br />
In a medical context, a drug may be defined as any<br />
substance used in the diagnosis, prevention, treatment,<br />
or cure of a disease. In an abuse context, a<br />
drug may be described as any substance that alters<br />
consciousness <strong>and</strong> may be habit forming. According<br />
to these definitions, alcohol is classified as a<br />
drug in the context of abuse.<br />
<strong>Alcohol</strong> is classified as a drug<br />
in the context of abuse.<br />
The alcohol contained in alcoholic beverages is<br />
called ethanol. Ethanol is a small molecule having<br />
a 2-carbon (C) backbone with 5 attached hydrogens<br />
(H) <strong>and</strong> a hydroxyl (OH) group at one end.<br />
This terminal hydroxyl group is characteristic of<br />
an alcohol (Figure 5). Ethanol is formed by a natural<br />
conversion process called fermentation<br />
where yeast, a fungus, converts sugar <strong>into</strong> alcohol<br />
<strong>and</strong> carbon dioxide. The natural sugars found in<br />
fruit, berries, <strong>and</strong> malted grains are fermented to<br />
The Use of Animals in Scientific Research<br />
Scientists who use animals as research subjects must abide by federal policies. Public Health Service<br />
policy dictates specific requirements for animal care <strong>and</strong> use in research. This policy conforms to the<br />
Health Research Extension Act of 1985 (Public Law 99-158) <strong>and</strong> applies to all research, research<br />
training, biological testing, <strong>and</strong> other activities that involve animals. The principles for using <strong>and</strong> caring<br />
for vertebrate animals in research <strong>and</strong> testing include<br />
• The transportation, care, <strong>and</strong> use of animals should be in accordance with the Animal Welfare<br />
Act <strong>and</strong> other applicable federal laws, guidelines, <strong>and</strong> policies.<br />
• Procedures involving animals should be designed with consideration of their relevance to<br />
human or animal health, the advancement of knowledge, or the good of society.<br />
• The animals selected should be of an appropriate species <strong>and</strong> quality <strong>and</strong> the minimum number<br />
required to obtain valid results. Methods such as mathematical models, computer simulations,<br />
<strong>and</strong> in vitro biological systems should be considered.<br />
• Procedures should minimize discomfort, distress, <strong>and</strong> pain to the animals.<br />
• Procedures that may cause more than momentary or slight pain should be performed with<br />
appropriate sedation, analgesia, or anesthesia.<br />
• Animals that would suffer severe or chronic pain or distress that cannot be relieved should be<br />
painlessly killed.<br />
• The living conditions of animals should be appropriate for the species. The housing, feeding,<br />
<strong>and</strong> care of animals must be directed by a veterinarian or a trained, experienced scientist.<br />
• Investigators who work with animals must be appropriately qualified <strong>and</strong> trained for conducting<br />
procedures on living animals.<br />
• Exceptions to any of these principles must be reviewed <strong>and</strong> approved by an appropriate committee<br />
prior to the procedure.<br />
• An Institutional Animal Care <strong>and</strong> Use Committee (IACUC) oversees all animal use in each<br />
institution where animal research is conducted. The IACUC must give approval for the<br />
research plan <strong>and</strong> species to be used. IACUCs include scientists <strong>and</strong> nonscientists from outside<br />
the institution. Nonscientists are often representatives of humane organizations.<br />
28
produce beer <strong>and</strong> wine. Liquors, however, are produced<br />
through the process of distillation.<br />
Figure 5. Chemical<br />
structure of ethanol.<br />
5.1 Absorption <strong>and</strong> distribution of alcohol in the<br />
body. When an alcohol-containing drink is consumed,<br />
the alcohol is quickly absorbed in the<br />
blood by diffusion <strong>and</strong> is then transported to the<br />
tissues <strong>and</strong> throughout the water-containing portions<br />
of the body as part of the process of distribution.<br />
About 20 percent of the alcohol is<br />
absorbed through the stomach, <strong>and</strong> about 80 percent<br />
is absorbed through the upper portion of the<br />
small intestine. 6,28<br />
5.2 Measurement of blood alcohol concentration<br />
(BAC). Metabolism refers to the process by which<br />
the body breaks down food to extract energy from<br />
it. With respect to alcohol, metabolism refers to<br />
the transformation of ethanol to acetaldehyde <strong>and</strong><br />
other products. The primary site of alcohol<br />
metabolism is the liver. Only a tiny fraction (less<br />
than 10 percent) of the alcohol consumed is not<br />
metabolized <strong>and</strong> is excreted from the body in<br />
breath, sweat, <strong>and</strong> urine. 6 This process of metabolism<br />
<strong>and</strong> excretion is known as elimination. The<br />
concentration of alcohol in breath <strong>and</strong> urine mirrors<br />
the concentration of alcohol in blood. This<br />
means that alcohol in breath can be detected,<br />
measured, <strong>and</strong> used to calculate a person’s blood<br />
alcohol concentration (BAC). The BAC calculation<br />
is the st<strong>and</strong>ard means of determining the<br />
extent of a person’s alcohol impairment.<br />
BAC, although expressed as a percentage when a<br />
unit of measure is shown, is actually a weight-pervolume<br />
measurement: grams of ethanol per 100<br />
milliliters, or deciliter, of blood. The calculation of<br />
an individual’s BAC depends partially on the total<br />
amount of water in the body. For example, males<br />
average 58 percent of their total body weight as<br />
water, while females average 49 percent. 38 Other<br />
factors important to calculating BAC are the<br />
amount of alcohol consumed <strong>and</strong> the burnoff, or<br />
rate at which the alcohol is metabolized.<br />
The concentration of alcohol in the<br />
breath <strong>and</strong> urine mirrors the concentration<br />
of alcohol in the blood. This means<br />
that alcohol in breath can be detected,<br />
measured, <strong>and</strong> used to calculate a person’s<br />
blood alcohol concentration (BAC).<br />
In a practical sense, the only factor influencing the<br />
BAC calculation likely to be known with great<br />
precision is the amount of alcohol consumed. The<br />
total body water <strong>and</strong> burnoff are themselves influenced<br />
by several factors. Total body water is a<br />
function not only of a person’s gender, but also of<br />
his or her weight <strong>and</strong> body type. <strong>Alcohol</strong> metabolism<br />
(burnoff) also varies among people. Heavy<br />
drinkers, for example, can have elevated rates of<br />
alcohol metabolism due to higher-than-normal<br />
concentrations of alcohol-metabolizing enzymes.<br />
Higher levels of these enzymes increase the<br />
burnoff. The average metabolism for a moderate<br />
drinker results in a decline in BAC of about 0.017<br />
per hour, while a heavy drinker may have a<br />
decrease of 0.020 per hour. The range of metabolism<br />
rate per hour is from above 0.040 to below<br />
0.010. 38 For more detailed descriptions of BAC<br />
effects on the brain <strong>and</strong> body, see 6.1 <strong>Alcohol</strong> <strong>and</strong><br />
the brain <strong>and</strong> 6.2 <strong>Alcohol</strong> <strong>and</strong> body systems, as well<br />
as Table 4, on page 38.<br />
5.3 Factors affecting alcohol absorption <strong>and</strong> elimination.<br />
Humans vary widely in their ability to<br />
absorb <strong>and</strong> eliminate alcohol. This section<br />
describes some of the most important factors that<br />
influence how quickly alcohol is absorbed <strong>into</strong><br />
the blood.<br />
Food. Absorption of alcohol is faster when the<br />
stomach is empty; the empty stomach allows rapid<br />
passage of the alcohol <strong>into</strong> the small intestine,<br />
29<br />
Information about <strong>Alcohol</strong>
<strong>Underst<strong>and</strong>ing</strong> <strong>Alcohol</strong>: <strong>Investigations</strong> <strong>into</strong> <strong>Biology</strong> <strong>and</strong> <strong>Behavior</strong><br />
where absorption is most efficient. This means that<br />
the apparent sobering effect of eating prior to alcohol<br />
consumption is due to a delay in stomach emptying.<br />
A recent study showed that people who<br />
drank alcohol after a meal that included protein,<br />
fat, <strong>and</strong> carbohydrates absorbed alcohol nearly<br />
three times more slowly than when they drank<br />
alcohol on an empty stomach (see Figure 6). The<br />
rate of alcohol absorption depends not only on the<br />
presence or absence of food, but also on the type of<br />
food present. Foods with a higher fat content<br />
require more time to leave the stomach; consequently,<br />
eating fatty foods will allow alcohol<br />
absorption to take place over a longer time.<br />
Figure 6. The effect of food on blood alcohol concentration.<br />
The graph shows BAC after a person<br />
drank alcohol following an overnight fast (solid<br />
line) <strong>and</strong> immediately after breakfast (dotted line).<br />
Although alcohol’s effects are delayed by the presence<br />
of food in the stomach, they are not prevented.<br />
Individuals may drink too much alcohol<br />
in a short time, believing that it isn’t having an<br />
effect. Only after the delay in the absorption <strong>and</strong><br />
elimination of the alcohol is the impact of their<br />
drinking felt, perhaps with disastrous consequences.<br />
Body weight <strong>and</strong> build. Greater body weight provides<br />
a greater volume in which alcohol can be<br />
distributed. This means a larger person will be less<br />
affected by a given amount of alcohol than a<br />
smaller person would be. <strong>Alcohol</strong> is more soluble<br />
in water than in fat. This means that tissues rich<br />
in water, like muscle, take up more alcohol than<br />
do tissues rich in fat. A leaner person with a<br />
greater muscle mass (<strong>and</strong> less fat) provides a<br />
larger volume for alcohol to be distributed in<br />
compared with a person who weighs the same but<br />
has a higher percentage of body fat. In summary,<br />
if you compare two people of equal size but who<br />
differ in amount of body fat, the effects of alcohol<br />
will be different in them. The person with low<br />
body fat will be affected less than the person with<br />
a higher level of body fat.<br />
Gender. Females, on average, have a smaller body<br />
mass <strong>and</strong> a higher proportion of body fat than do<br />
males. These characteristics mean that, on average,<br />
females have a lower proportion of total body<br />
water in which to distribute alcohol. Females also<br />
may have a lower activity of the alcohol-metabolizing<br />
enzyme alcohol dehydrogenase (ADH) in<br />
the stomach; therefore, more of the ingested alcohol<br />
reaches the blood. These factors mean that<br />
females generally exhibit higher BACs than do<br />
males after consuming the same amount of alcohol<br />
<strong>and</strong> are more vulnerable to alcohol’s effects.<br />
Females are also more susceptible than males to<br />
alcoholic liver disease, heart muscle damage, <strong>and</strong><br />
brain damage. 45<br />
5.4 <strong>Alcohol</strong> metabolism. The primary place where<br />
alcohol is metabolized is the liver. Liver cells contain<br />
ADH, which converts alcohol to acetaldehyde.<br />
Other enzymes in turn convert the<br />
acetaldehyde to carbon dioxide <strong>and</strong> water, which<br />
are excreted from the body. If the rate of alcohol<br />
consumption exceeds the rate at which the alcohol<br />
can be metabolized, then the concentration of<br />
alcohol in the blood rises <strong>and</strong> the individual may<br />
become <strong>into</strong>xicated.<br />
The effects of absorption, distribution, <strong>and</strong> elimination<br />
combine to produce a characteristic blood<br />
alcohol curve (Figure 8). Immediately after a person<br />
drinks alcohol, the BAC rises sharply during<br />
the absorption phase to a maximum that depends<br />
on the amount consumed. Typically, the greatest<br />
30
Figure 7. <strong>Alcohol</strong>’s effects are influenced by gender, body weight, <strong>and</strong> body type.<br />
alcohol concentration is reached 45–90 minutes<br />
after drinking. BAC then quickly declines due to<br />
diffusion of alcohol <strong>into</strong> the body tissues as part of<br />
the distribution phase. Finally, BAC falls more<br />
slowly during the elimination phase. <strong>Alcohol</strong> is<br />
removed from the body through the normal<br />
routes of excretion as part of this process. During<br />
periods of high BAC, about 5 percent of the alcohol<br />
is excreted in breath <strong>and</strong> another 5 percent in<br />
urine, with negligible amounts excreted in sweat<br />
<strong>and</strong> feces.<br />
The shape of the blood alcohol curve is influenced<br />
by many factors including such variables as body<br />
size, gender, build, amount <strong>and</strong> type of beverage<br />
ingested, duration of drinking, fatigue, <strong>and</strong> the<br />
presence <strong>and</strong> type of food. These variables are also<br />
major determinants of the timing <strong>and</strong> peak of the<br />
blood alcohol curve.<br />
6 <strong>Alcohol</strong>: Biological Effects<br />
Upon consumption, alcohol is distributed<br />
throughout the water-containing portions of the<br />
body, affecting primarily those organs having a<br />
high water content. One of these is the liver,<br />
which is the organ that metabolizes alcohol.<br />
Another is the brain, the organ that is the seat of<br />
cognition <strong>and</strong> behavior.<br />
6.1 <strong>Alcohol</strong> <strong>and</strong> the brain. The brain is composed<br />
of billions of nerve cells called neurons. A typical<br />
neuron has three important parts (Figure 9). The<br />
cell body is responsible for directing all of the<br />
neuron’s activities. The dendrites are a cluster of<br />
31<br />
Information about <strong>Alcohol</strong>
<strong>Underst<strong>and</strong>ing</strong> <strong>Alcohol</strong>: <strong>Investigations</strong> <strong>into</strong> <strong>Biology</strong> <strong>and</strong> <strong>Behavior</strong><br />
Figure 8. Blood alcohol<br />
concentration over time.<br />
Figure 9. A typical neuron.<br />
small fibers that receive chemical messages from<br />
other neurons. The axon is a single, long fiber that<br />
transmits messages from the cell body to other<br />
neurons or other cells of the body, such as muscle<br />
cells.<br />
Although the axon of a neuron is extremely close<br />
to the dendrites of an adjoining neuron, they do<br />
not touch. The tiny amount of space between the<br />
neurons is called the synapse. The process by<br />
which neurons transmit messages to each other is<br />
known as neurotransmission. A message is an<br />
electrical impulse in the cell body that moves<br />
down the axon toward the synapse. At the<br />
synapse, it triggers the release of molecules called<br />
neurotransmitters, which diffuse across the<br />
synapse <strong>and</strong> bind to receptor molecules located in<br />
the cell membranes of the adjoining neuron’s dendrites.<br />
The binding of the neurotransmitter either<br />
stimulates or inhibits the electrical impulse in the<br />
receiving neuron (see Figure 10).<br />
There are many types of neurotransmitters in the<br />
brain, each with a specific function. The binding<br />
32
of a neurotransmitter to its receptor is specific—<br />
that is, a neurotransmitter fits its own receptor<br />
much like a key fits only the appropriate lock.<br />
Once a neurotransmitter has passed on its message,<br />
it is either broken down by an enzyme or<br />
reabsorbed by the same neuron that released it.<br />
For many years, scientists thought that alcohol<br />
altered the function of neurons in the brain by<br />
interacting with fat molecules in the cell membranes.<br />
More recently, it has become apparent that<br />
alcohol interacts with proteins found in the cell<br />
membranes, particularly those involved in neurotransmission.<br />
Like other drugs of addiction, alcohol<br />
acts via the brain’s reward pathway in the<br />
limbic system (see “Reward pathway or pleasure<br />
circuit,” on page 34). However, alcohol is unlike<br />
other drugs in that it interacts with multiple systems<br />
in the brain, sometimes stimulating <strong>and</strong> at<br />
other times inhibiting neurotransmission.<br />
dependence. The term “tolerance” refers to a<br />
decrease in brain sensitivity to alcohol following<br />
long-term exposure (see 2 <strong>Alcohol</strong> Use, Abuse, <strong>and</strong><br />
<strong>Alcohol</strong>ism: Definitions, on page 24, <strong>and</strong> “Tolerance,”<br />
on page 34). If alcohol-dependent individuals<br />
stop drinking, they experience withdrawal<br />
symptoms, which may include tremors, anxiety,<br />
sweating, hallucinations, <strong>and</strong> seizures. The site of<br />
action of all these effects is the brain.<br />
The physiological <strong>and</strong> behavioral<br />
changes associated with <strong>into</strong>xication<br />
reflect the effects of alcohol on various<br />
parts of the brain.<br />
Intoxication. The physiological <strong>and</strong> behavioral<br />
changes associated with <strong>into</strong>xication reflect the<br />
effects of alcohol on various parts of the brain. For<br />
example, the loss of coordination observed in <strong>into</strong>xicated<br />
individuals may result from the effects of<br />
alcohol on a portion of the brain called the cerebellum,<br />
which functions in the control of movement<br />
(see Figure 11). <strong>Alcohol</strong>-induced memory lapses<br />
may result from impairment of the hippocampus, a<br />
part of the brain that helps store new memories.<br />
Drinking can be sufficiently excessive that death<br />
results from suppression of the brainstem activity<br />
that controls breathing <strong>and</strong> circulation.<br />
Figure 10. Neurotransmission across a synapse.<br />
After drinking a sufficient amount of alcohol,<br />
many individuals experience a pleasurable state of<br />
mind. This pleasurable sensation leads some individuals<br />
to seek repeated exposure to alcohol. If<br />
drinking is excessive, it can lead to confusion, loss<br />
of coordination, sedation, coma, <strong>and</strong> even death.<br />
Long-term exposure to alcohol can lead to tolerance<br />
of its effects <strong>and</strong> eventually to physical<br />
Figure 11. Regions of the brain affected by alcohol.<br />
33<br />
Information about <strong>Alcohol</strong>
<strong>Underst<strong>and</strong>ing</strong> <strong>Alcohol</strong>: <strong>Investigations</strong> <strong>into</strong> <strong>Biology</strong> <strong>and</strong> <strong>Behavior</strong><br />
Reinforcement. The properties of alcohol that can<br />
cause continued drinking, such as its pleasurable<br />
<strong>and</strong> anxiety-reducing effects, are the very ones<br />
that contribute to chronic alcohol abuse <strong>and</strong> alcoholism.<br />
This is known as reinforcement. Scientists<br />
are currently exploring the brain chemistry<br />
involved in reinforcement. Research suggests that<br />
specific brain regions, such as the hypothalamus<br />
(which is involved in hunger, thirst, <strong>and</strong> emotions),<br />
as well as the amygdala, nucleus accumbens,<br />
<strong>and</strong> prefrontal cortex, play a role in<br />
reinforcement. Specific neurotransmitters are also<br />
implicated in alcohol’s reinforcing effects.<br />
Tolerance. Tolerance refers to the body’s ability to<br />
adapt to chronic alcohol use. With continued use,<br />
the brain becomes less sensitive to alcohol. This<br />
means that higher BACs are needed to produce<br />
<strong>into</strong>xication. Both alcohol abusers <strong>and</strong> alcoholics<br />
can display tolerance. BACs that can render<br />
nonabusers unconscious can leave abusers <strong>and</strong><br />
alcoholics appearing nearly sober.<br />
When alcoholic individuals stop<br />
drinking, they may experience severe<br />
alcohol cravings, short-term memory<br />
loss, disruption of cognitive <strong>and</strong> motor<br />
function, reduced perceptual abilities,<br />
<strong>and</strong> emotional <strong>and</strong> personality changes.<br />
Chronic alcohol use leads to increased concentrations<br />
of the liver enzymes that metabolize alcohol.<br />
This allows the liver to break down alcohol more<br />
efficiently; therefore, the individual must consume<br />
more alcohol to reach a given BAC. There<br />
also is a behavioral component to tolerance. Subjected<br />
to chronic, excessive alcohol exposure, an<br />
individual learns to function under the influence<br />
of alcohol. For example, functional tolerance can<br />
reduce the impairment that would ordinarily<br />
accompany the performance of a task. Individuals<br />
may be able to drive home successfully after<br />
drinking because the route is familiar <strong>and</strong> nothing<br />
unexpected happens. However, if they encounter<br />
a detour or another car unexpectedly darts in<br />
front of them, they will be at the same risk for a<br />
crash as a driver with the same BAC who is unfamiliar<br />
with the route. The increased amounts of<br />
alcohol consumed by a person experiencing tolerance<br />
can severely damage the body’s physiological<br />
systems despite their apparent normalcy.<br />
Physical dependence <strong>and</strong> withdrawal. When alcohol<br />
use is stopped, withdrawal symptoms include<br />
severe alcohol cravings as well as physical <strong>and</strong> psychological<br />
problems. The biochemical changes<br />
associated with withdrawal lead to short-term<br />
memory loss, disruption of cognitive <strong>and</strong> motor<br />
function, reduced perceptual abilities, <strong>and</strong> emotional<br />
<strong>and</strong> personality changes. 3 Another consequence<br />
of withdrawal is delirium tremens<br />
(sometimes referred to as the DTs). Delirium<br />
tremens is characterized by severe agitation <strong>and</strong><br />
hallucinations. The DTs can begin within a couple<br />
of days after alcohol consumption has stopped <strong>and</strong><br />
can last for a week or more. The mechanisms<br />
behind tolerance <strong>and</strong> physical dependence involve<br />
relationships among nerve cell membranes, neurotransmitters<br />
<strong>and</strong> their receptors, <strong>and</strong> the reward<br />
pathway. All of these are areas of active research.<br />
Reward pathway or pleasure circuit. The reward<br />
pathway is a powerful biological force. Strong<br />
motivations such as eating, drinking, <strong>and</strong> sex can<br />
activate neurons that produce <strong>and</strong> regulate feelings<br />
of pleasure. The reward pathway consists of a<br />
network of neurons found in the middle of the<br />
brain (see Figure 12). When activated by a positive<br />
experience, a group of neurons near the top of<br />
the brainstem (called the ventral tegmental area)<br />
releases the neurotransmitter dopamine. This<br />
message is relayed to a structure called the<br />
nucleus accumbens (part of the emotional limbic<br />
system) <strong>and</strong> to a related part of the prefrontal cortex,<br />
resulting in a pleasurable sensation.<br />
The reward pathway can also be activated by a<br />
negative experience. Animal studies have shown<br />
that concentrations in the brain of a neurotransmitter<br />
associated with stress rise sharply during<br />
withdrawal from alcohol. The animal is motivated<br />
to seek the reward (alcohol) to avoid the pain of<br />
34
We do know that when liver cells metabolize alcohol,<br />
they use oxygen. Byproducts of this metabolism<br />
are highly reactive compounds called free<br />
radicals. Free radicals react with proteins, lipids,<br />
<strong>and</strong> DNA to cause cell damage or even cell death.<br />
Furthermore, drinking alcohol can cause the bacteria<br />
lining the gut to release endotoxin (a component<br />
of bacterial outer cell membranes).<br />
Endotoxin in turn activates certain liver cells to a<br />
higher metabolic state, which generates more free<br />
radicals <strong>and</strong> leads to cell damage.<br />
Figure 12. The reward pathway.<br />
withdrawal. A similar process propagates the<br />
human cycle of alcohol addiction: individuals are<br />
motivated to continue consuming alcohol to<br />
avoid the discomfort of withdrawal, even though<br />
this behavior maintains addiction.<br />
6.2 <strong>Alcohol</strong> <strong>and</strong> body systems. Once consumed,<br />
alcohol enters the bloodstream <strong>and</strong> becomes distributed<br />
throughout the body. Although heavy<br />
drinking is most commonly associated with liver<br />
damage, it can also affect the digestive, cardiovascular,<br />
immune, <strong>and</strong> endocrine systems.<br />
The liver. Excessive drinking can harm nearly<br />
every organ in the body; however, it is most commonly<br />
associated with liver damage. The liver is<br />
especially sensitive to the effects of alcohol<br />
because it receives blood directly from the intestines,<br />
the major site of alcohol absorption. The<br />
liver is the primary site of alcohol metabolism, yet<br />
a number of the byproducts of this metabolism are<br />
toxic to the liver itself. Accumulation of these<br />
byproducts leads to alcohol-induced liver damage,<br />
which can take the form of either inflammation<br />
(alcoholic hepatitis) or liver scarring (fibrosis or<br />
cirrhosis). Often both types of damage exist<br />
within the same person. <strong>Alcohol</strong> abuse is the leading<br />
cause of liver-related deaths in the United<br />
States. It is estimated that over 2 million people<br />
suffer from some form of alcoholic liver disease. 17<br />
The mechanisms by which alcohol damages the<br />
liver are complex <strong>and</strong> incompletely understood.<br />
The liver is the primary site of<br />
alcohol metabolism, yet a number<br />
of the byproducts of this metabolism<br />
are toxic to the liver itself.<br />
The digestive system. Excessive drinking has been<br />
shown to cause chronic inflammation of the<br />
esophagus, which can lead to esophageal cancer.<br />
During swallowing, the esophagus contracts <strong>and</strong><br />
relaxes to help food reach the stomach. By inhibiting<br />
this contraction, alcohol allows acidic stomach<br />
juices to back up <strong>into</strong> the lower esophagus.<br />
The presence of stomach acids in the esophagus<br />
can lead to inflammation, ranging from mild to<br />
severe. Long-term exposure to stomach acid can<br />
cause the cells lining the esophagus to progress<br />
toward esophageal cancer. Heavy alcohol use has<br />
also been linked to pancreatitis (inflammation of<br />
the pancreas) <strong>and</strong> cancers in various other body<br />
parts, including the mouth, throat, breast, colon,<br />
<strong>and</strong> rectum.<br />
Although drinking alcohol is not specifically associated<br />
with increased risk for stomach cancer, it<br />
may be involved in gastritis (inflammation of the<br />
stomach). A bacterium called Helicobacter pylori<br />
(H. pylori) has been shown to cause gastritis <strong>and</strong><br />
stomach ulcers; heavy drinkers have higher rates<br />
of gastritis <strong>and</strong> H. pylori infection than do light<br />
drinkers. Since gastritis among alcoholics is not<br />
reduced by stopping drinking, but rather by treatment<br />
with antibiotics, it may be the bacterial infection<br />
rather than the alcohol that causes gastritis.<br />
35<br />
Information about <strong>Alcohol</strong>
<strong>Underst<strong>and</strong>ing</strong> <strong>Alcohol</strong>: <strong>Investigations</strong> <strong>into</strong> <strong>Biology</strong> <strong>and</strong> <strong>Behavior</strong><br />
However, heavy alcohol use may increase susceptibility<br />
to gastritis. Scientists currently are investigating<br />
whether the higher rate of gastritis among<br />
heavy drinkers is due to alcohol or to H. pylori<br />
infection.<br />
The cardiovascular system. At high concentrations,<br />
alcohol can interfere with the pumping action of<br />
the heart. Its effects can be acute or chronic. <strong>Alcohol</strong><br />
exerts its effects through a variety of mechanisms,<br />
including interfering with the sodiumpotassium<br />
pump (which is needed to move an<br />
electrical impulse through the heart) <strong>and</strong> disturbing<br />
the heart’s response to certain hormones. The<br />
short-term effects of alcohol disturb the electrical<br />
events that control the contraction of the heart<br />
muscle <strong>and</strong> interfere with the rhythm of the<br />
heartbeat. These effects are thought to be major<br />
reasons for sudden death among alcoholics.<br />
At high concentrations,<br />
alcohol can interfere with the<br />
pumping action of the heart.<br />
Long-term effects of heavy drinking may involve<br />
interfering with the action of the energy-producing<br />
parts of the heart cell called mitochondria.<br />
Studies of alcohol-fed hamsters have shown that<br />
after 14 weeks’ of high BACs, the heart loses some<br />
of its ability to beat properly. This effect was<br />
accompanied by a lower-than-normal energy output<br />
from the mitochondria. 54 When hamsters,<br />
which have life spans of approximately three<br />
years, were given longer exposures to high BACs,<br />
they were able to bring the energy output of their<br />
mitochondria back to normal, but their hearts still<br />
didn’t beat as well as they normally do. This study<br />
suggests that the body’s adaptive response to longterm<br />
alcohol use is unable to fully restore normal<br />
heart function.<br />
Hypertension (high blood pressure), strongly<br />
associated with drinking more than four drinks<br />
per day, can be another result of long-term alcohol<br />
use. Several mechanisms have been proposed to<br />
explain the relationship between drinking <strong>and</strong><br />
hypertension. One proposed mechanisim involves<br />
changes in the levels of various hormones <strong>and</strong><br />
neurotransmitters that regulate cardiac function.<br />
Another proposed mechanism states that alcohol<br />
interferes with the ability of muscles in the arteries<br />
to contract. <strong>Alcohol</strong>-induced hypertension is not<br />
permanent, <strong>and</strong> among heavy drinkers, it disappears<br />
within two or three weeks after drinking<br />
stops. The long-term presence of alcohol-induced<br />
hypertension in alcoholics may play a role in the<br />
association between drinking <strong>and</strong> the risk of<br />
stroke.<br />
Coronary artery disease is the leading cause of<br />
death in Western societies, accounting for about<br />
25 percent of all deaths. Despite the clear association<br />
between heavy drinking <strong>and</strong> heart disease,<br />
moderate drinking is correlated with reduced risk<br />
for coronary artery disease. 44 Scientists currently<br />
are attempting to establish whether the protection<br />
comes from the alcohol or the lifestyles of moderate<br />
drinkers. For example, a number of studies<br />
suggest that drinking moderate levels of wine produces<br />
the most protection against coronary heart<br />
disease. The reason for this is not clear. Wine<br />
drinkers are also associated with leading healthier<br />
lifestyles than are people who prefer to drink beer<br />
or liquor. This protective effect of moderate alcohol<br />
drinking must be weighed against its<br />
increased accident risk. These benefits are also<br />
offset at higher drinking levels due to increased<br />
risks of other types of disease <strong>and</strong> traumas.<br />
The immune system. It is well documented that<br />
people who drink heavily suffer more infectious<br />
diseases than do people who only drink moderately.<br />
For example, various studies have found<br />
that drug <strong>and</strong> alcohol abusers are infected by the<br />
bacterium that causes tuberculosis at a rate that is<br />
15 to 200 times greater than that of nonabusers.<br />
Today, we know that alcohol abuse can alter the<br />
distribution <strong>and</strong> function of immune cells called<br />
lymphocytes by interfering with molecules called<br />
cytokines that help orchestrate lymphocyte activities.<br />
<strong>Alcohol</strong> can increase cytokine production in<br />
liver cells, which leads to the scar formation <strong>and</strong><br />
impaired blood flow associated with cirrhosis. In<br />
36
turn, abnormal cytokine concentrations can lead<br />
to a poorly regulated immune system that is less<br />
capable of fighting off infections.<br />
<strong>Alcohol</strong>’s effects on the immune system can be even<br />
more severe. If alcohol damages the immune system<br />
to a level where it fails to accurately distinguish<br />
self from nonself, the immune system attacks the<br />
body. This can result in, or worsen, alcoholinduced<br />
organ damage such as alcohol liver disease.<br />
Regrettably, children born with fetal alcohol<br />
syndrome (FAS) must cope with the effects of alcohol<br />
on their immune systems throughout their lives<br />
(see 10.4 Drinking <strong>and</strong> pregnancy <strong>and</strong> Table 4). FAS<br />
results from alcohol consumption by pregnant<br />
women. Prenatal exposure to alcohol can disrupt<br />
the normal formation of the fetal immune system,<br />
leading to increased frequencies of infection <strong>and</strong> an<br />
increased risk of organ damage, among other<br />
adverse, lifelong effects.<br />
The endocrine system. Long-term alcohol use can<br />
also disrupt the function of the endocrine system<br />
<strong>and</strong> affect the balance of the hormones insulin<br />
<strong>and</strong> glucagon, which regulate blood glucose concentrations.<br />
Drinking alcohol can alter the release<br />
of reproductive hormones, growth hormone, <strong>and</strong><br />
testosterone. <strong>Alcohol</strong>-induced changes in hormone<br />
concentrations are associated with sexual<br />
dysfunction in both men <strong>and</strong> women. <strong>Alcohol</strong>ics<br />
also face increased risk of osteoporosis. The disruption<br />
of certain hormones, such as parathyroid<br />
hormone, vitamin D–related hormones, <strong>and</strong> calcitonin,<br />
may lead to a calcium deficiency.<br />
7 <strong>Alcohol</strong>: <strong>Behavior</strong>al Effects<br />
The brain is the origin of all human behavior, so it<br />
is not surprising that exposure to alcohol leads to<br />
changes in behavior. As discussed in 6.1 <strong>Alcohol</strong> <strong>and</strong><br />
the brain, the human brain has a high water content.<br />
Consequently, it is very sensitive to the effects of<br />
alcohol consumption. <strong>Alcohol</strong> induces several<br />
behavioral changes because it affects various areas of<br />
the brain. For example, the cerebellum (movement),<br />
the hippocampus (memory), the ventral<br />
tegmental area (reward), <strong>and</strong> even the brainstem<br />
(breathing) are all affected by drinking alcohol.<br />
The short-term behavioral effects of alcohol follow<br />
the typical dose-response relationship characteristic<br />
of a drug; that is, the greater the dose, the<br />
greater the effect [see 5.2 Measurement of blood<br />
alcohol concentration (BAC)]. Table 4 shows that<br />
increased blood alcohol concentrations lead to<br />
changes in personality as well as loss of control<br />
over physical functions. An early (<strong>and</strong> nearly universal)<br />
effect of alcohol on personality is the loss<br />
of inhibition. Other effects experienced at lower<br />
BACs (0.01–0.05) include a sense of well being<br />
<strong>and</strong> lowered alertness. These BAC values also<br />
impair thought, judgment, coordination, <strong>and</strong> concentration<br />
in most individuals.<br />
The short-term behavioral effects of<br />
alcohol follow the typical dose-response<br />
relationship characteristic of a<br />
drug; that is, the greater the dose,<br />
the greater the effect.<br />
It is easier to predict the physical effects of alcohol<br />
than the behavioral ones, especially at BACs in the<br />
range of 0.06–0.20. Personality influences behavioral<br />
responses. Loss of inhibition combined with<br />
additional drinking leads some individuals to<br />
become increasingly boisterous while others<br />
become withdrawn. Still others become angry <strong>and</strong><br />
aggressive. Not surprisingly, inappropriate expression<br />
of anger <strong>and</strong> aggression can lead to abusive<br />
behavior <strong>and</strong> violence (see 10.5 Drinking <strong>and</strong> violence).<br />
Excessive drinking may also cause some<br />
individuals to experience severe emotional swings<br />
<strong>and</strong> even trigger severe depression. At BACs of<br />
0.21–0.29, loss of muscle control leads most individuals<br />
to experience stupor <strong>and</strong> impaired sensations.<br />
Since BACs over 0.30 affect breathing <strong>and</strong><br />
heart rate, all individuals experiencing this BAC<br />
are at risk for unconsciousness, coma, <strong>and</strong> even<br />
death.<br />
Though the behavioral effects of alcohol are unpredictable<br />
<strong>and</strong> vary from one individual to another, a<br />
number of factors are known to influence alcohol’s<br />
37<br />
Information about <strong>Alcohol</strong>
<strong>Underst<strong>and</strong>ing</strong> <strong>Alcohol</strong>: <strong>Investigations</strong> <strong>into</strong> <strong>Biology</strong> <strong>and</strong> <strong>Behavior</strong><br />
Table 4. Progressive Effects of <strong>Alcohol</strong><br />
effects on behavior. One important factor that influences<br />
both personality <strong>and</strong> susceptibility to alcohol<br />
abuse is genetics (see 8.2 <strong>Alcohol</strong>ism <strong>and</strong> genetics,<br />
on page 39). Genetic influences work at both the<br />
individual <strong>and</strong> the population levels. For example,<br />
certain genetic variations that exist more often in<br />
Chinese <strong>and</strong> Japanese populations lead to an<br />
increased sensitivity to alcohol’s effects, which in<br />
turn leads to a decreased susceptibility to alcoholism.<br />
An individual possessing these genetic variations<br />
experiences facial flushing, an elevated heart<br />
rate, <strong>and</strong> a burning sensation in the stomach upon<br />
consumption of alcohol. These negative consequences<br />
generally deter further alcohol consumption.<br />
In other populations, different genetic<br />
variations lead to an increased susceptibility to<br />
alcoholism. In still other populations, genetics has<br />
not been shown to influence an individual’s drinking<br />
behavior. It is important to remember that an<br />
individual cannot control his or her genetic<br />
makeup, but being aware of it can help a person<br />
decide whether the choice to drink alcohol would<br />
be risky.<br />
Drinkers expect to feel <strong>and</strong> behave in<br />
certain ways when drinking. Expectations<br />
about drinking can begin at an<br />
early age, even before drinking begins.<br />
There are, of course, nongenetic factors that influence<br />
drinking behavior. The term expectancy<br />
refers to what a person expects will happen in a<br />
given drinking situation. Research has shown that<br />
drinkers expect to feel <strong>and</strong> behave in certain ways<br />
when drinking. Expectations about drinking can<br />
begin at an early age, even before drinking<br />
begins. 48 Students who engage in binge drinking<br />
during high school are more likely to do so in college.<br />
57 Young people are also influenced by their<br />
perceptions of how much they think their friends<br />
drink. Studies have shown that college students<br />
38
tend to think their friends drink more than they<br />
actually do. 40 This belief can cause them to<br />
increase their level of drinking in an effort to “fit<br />
in.” Other social factors that promote increased<br />
alcohol consumption are drinking in groups <strong>and</strong><br />
20, 21<br />
serving oneself.<br />
8 <strong>Alcohol</strong>ism<br />
8.1 Signs of a problem. There is no simple test to<br />
identify someone with a drinking problem. However,<br />
clinicians often use a short series of questions<br />
as a screening tool. Honest answers to the<br />
following four questions can help individuals<br />
decide whether a problem may exist. To make the<br />
questions easier to remember, they have been<br />
written in such a way that the first letter of a key<br />
word in each question spells CAGE. 41<br />
1. Have you ever felt that you should cut<br />
down on your drinking?<br />
2. Have people annoyed you by criticizing<br />
your drinking?<br />
3. Have you ever felt bad or guilty about your<br />
drinking?<br />
4. Have you ever had a drink first thing in the<br />
morning to steady your nerves or to get rid<br />
of a hangover (eye opener)?<br />
A “yes” answer to one of these questions may suggest<br />
that a drinking problem exists, while more<br />
than one “yes” response is highly indicative of a<br />
problem. Even if a person answers “no” to all four<br />
questions, an alcohol problem can still exist. If the<br />
screening procedure suggests that an alcoholabuse<br />
or alcohol-dependence problem may exist,<br />
then that individual should be further evaluated<br />
by a qualified healthcare provider.<br />
Most people who use alcohol do so<br />
without problems. However, about<br />
17 percent of alcohol users either<br />
abuse it or are dependent on it.<br />
The criteria used by healthcare providers to diagnose<br />
alcohol abuse <strong>and</strong> alcoholism continue to be<br />
refined. Prior to the 1970s, subjective judgments<br />
<strong>and</strong> clinical experience were used to diagnose alco-<br />
holism. More recently, the diagnostic criteria have<br />
relied more on data <strong>and</strong> research. Today,<br />
researchers <strong>and</strong> clinicians in the United States rely<br />
on the Diagnostic <strong>and</strong> Statistical Manual of Mental<br />
Disorders (DSM) published by the American Psychiatric<br />
Association. 1 The DSM recognizes separate<br />
criteria for the diagnosis of alcohol dependence<br />
(alcoholism) <strong>and</strong> alcohol abuse.<br />
8.2 <strong>Alcohol</strong>ism <strong>and</strong> genetics. Most people who use<br />
alcohol do so without problems. However, about<br />
17 percent of current regular drinkers either abuse<br />
it or are dependent on it. Regular drinkers are<br />
defined as those who have consumed 12 or more<br />
drinks in the past year. An individual’s susceptibility<br />
to alcoholism is influenced by many factors.<br />
Scientists believe that, among other factors, there<br />
is a genetic basis for alcoholism because children<br />
or siblings of alcoholics are at much greater risk<br />
for developing the disease.<br />
It is important to keep in mind that members of<br />
the same family share both genes <strong>and</strong> a common<br />
environment. To distinguish between the effects<br />
of nature versus nurture, scientists have conducted<br />
twin <strong>and</strong> adoption studies. Identical twins<br />
have the same set of genes. In contrast, fraternal<br />
twins, like nontwin siblings, share an average of<br />
half their genes. Thus, both types of twins share<br />
environmental influences to a similar degree, but<br />
they differ in the amount of genetic information<br />
they share. If a trait shows greater similarity<br />
among identical twins compared with fraternal<br />
twins, then genes contribute to that trait.<br />
Children who are adopted at an early age provide<br />
an opportunity to separate genetic from environmental<br />
effects. The assumption is that any similarities<br />
for a trait between biological parents <strong>and</strong><br />
their adopted-away offspring are due to genetics.<br />
Conversely, similarities between adoptive parents<br />
<strong>and</strong> their adopted children reflect shared environmental<br />
influences. Twin <strong>and</strong> adoption studies<br />
indicate that there are strong genetic influences on<br />
alcoholism. It is important to stress, however, that<br />
many individuals who are genetically predisposed<br />
to become an alcoholic do not do so.<br />
Genetic influence speaks to an individual’s risk,<br />
39<br />
Information about <strong>Alcohol</strong>
<strong>Underst<strong>and</strong>ing</strong> <strong>Alcohol</strong>: <strong>Investigations</strong> <strong>into</strong> <strong>Biology</strong> <strong>and</strong> <strong>Behavior</strong><br />
not their destiny. The environment, including the<br />
social setting of the individual, is a very important<br />
factor. The individual must engage in the behavior<br />
of drinking before the genetic predisposition can<br />
set the stage for alcoholism to develop.<br />
The genetic influence on alcoholism is described<br />
as being polygenic, meaning that there is more<br />
than one gene influencing the trait. Scientific<br />
research has identified regions on many chromosomes<br />
(1, 2, 3, 4, 7, 11, 15, <strong>and</strong> 16) that may predispose<br />
an individual to alcoholism. 16, 18, 32, 50 In<br />
addition, other regions on chromosome 4 may<br />
help protect an individual from alcoholism. One<br />
such region is near the location of the genes for<br />
the ADH enzyme (see “The cardiovascular system,”<br />
on page 36). This is especially interesting<br />
because certain alleles, or versions of the ADH<br />
gene, have been shown to reduce the risk for<br />
alcoholism in Chinese <strong>and</strong> Japanese populations.<br />
Individuals having the ADH2 <strong>and</strong> ADH3 alleles<br />
produce enzymes that metabolize alcohol to<br />
acetaldehyde at a high rate. The accumulation of<br />
toxic acetaldehyde can cause facial flushing, an<br />
elevated heart rate, <strong>and</strong> a burning sensation in the<br />
stomach. These negative effects of alcohol consumption<br />
are responsible for the reduced rates of<br />
alcoholism among people with these genotypes.<br />
8.3 <strong>Alcohol</strong>ism treatments. Although it is a<br />
chronic disease, alcoholism can be treated successfully.<br />
Any successful physiological treatment<br />
for alcoholism must also include a psychological<br />
component. Similar to other chronic diseases,<br />
such as heart disease or diabetes, relapse is common<br />
during the course of alcoholism. Thus, successful<br />
treatment is defined in terms of recovery,<br />
not cure. Research continues to develop both<br />
pharmacological <strong>and</strong> psychosocial (behavioral)<br />
therapies for alcoholism. 54<br />
Any successful physiological treatment<br />
for alcoholism must also include<br />
a psychological component.<br />
Pharmacological treatment has for many years<br />
included the use of disulfiram (Antabuse), which<br />
affects the metabolism of alcohol in the liver. A<br />
person who drinks alcohol while taking disulfiram<br />
will experience severe discomfort <strong>and</strong> illness<br />
or, in extreme cases, even death. The expectation<br />
of illness deters the ingestion of alcohol. Often,<br />
however, alcohol abusers do not take the medication,<br />
or take it but continue to drink despite the<br />
consequences. Moreover, disulfiram treats only<br />
the effects, but not the causes, of the disease. This<br />
reduces its effectiveness unless used in conjunction<br />
with other behavioral therapies.<br />
Figure 13. Disulfiram is a drug approved by the<br />
Food <strong>and</strong> Drug Administration to treat alcoholism.<br />
More recently, the drug naltrexone has been<br />
approved as a pharmacological agent to help a<br />
person maintain sobriety. 58 Endorphins are<br />
among the hormones believed to be involved in<br />
alcohol craving. Naltrexone blocks the receptors<br />
for endorphins, thus helping reduce the desire for<br />
alcohol. Although clinical trials of naltrexone<br />
have been promising, the drug must be taken consistently<br />
to be effective. This drug should be used<br />
in conjunction with psychosocial therapies.<br />
Research is now under way to identify other medications<br />
that can be used alone, or in combination<br />
with other medications, to treat alcoholism.<br />
Individual-initiated (or “self-help”) therapies have<br />
traditionally been the backbone of alcohol recovery.<br />
The first such program, <strong>Alcohol</strong>ics Anonymous<br />
(AA), describes itself as a “worldwide fellowship of<br />
men <strong>and</strong> women who help each other to stay<br />
sober.” There are formal treatment programs,<br />
which include st<strong>and</strong>ard behavioral psychology<br />
interventions, relapse prevention, <strong>and</strong> family intervention,<br />
all of which can help some patients.<br />
40
9 <strong>Alcohol</strong> <strong>and</strong> Youth<br />
<strong>Alcohol</strong> abuse <strong>and</strong> alcoholism affect not just individuals,<br />
but whole families. Children become<br />
aware of alcohol at an early age. By about five or<br />
six years of age, most children can identify alcoholic<br />
beverages by smell alone. 48 Interviews with<br />
eight- <strong>and</strong> nine-year-old children living in New<br />
Zeal<strong>and</strong> revealed that one-third of them were<br />
aware of alcohol-related problems in their own<br />
environments. 11 Most acquired their knowledge<br />
about alcohol from siblings. However, one-third<br />
cited television as their information source.<br />
By about five or six years of age,<br />
most children can identify alcoholic<br />
beverages by smell alone.<br />
The prevalence of alcoholism in the United States<br />
is such that 76 million Americans, or about<br />
43 percent of the adult population, have been<br />
exposed to alcoholism in their families. 36 There<br />
are thought to be more than 28 million children of<br />
alcoholic parents in the United States, with over<br />
11 million of them under the age of 18. 37 Children<br />
who live in a home with an alcoholic parent are<br />
four times more likely than children of nonalcoholic<br />
parents to develop alcoholism themselves. 36<br />
Children of alcoholic parents are harmed in many<br />
other ways as well (see Table 5).<br />
The interaction of genetic <strong>and</strong> environmental factors<br />
influences the probability that a young person<br />
will abuse alcohol. Children of alcoholic parents<br />
Table 5. Effects of <strong>Alcohol</strong>ism on Children 37<br />
Children of alcoholics are more likely than<br />
children of nonalcoholic parents to<br />
• suffer child abuse<br />
• exhibit symptoms of depression <strong>and</strong><br />
anxiety<br />
• experience physical <strong>and</strong> mental health<br />
problems<br />
• have difficulties in school<br />
• display behavior problems<br />
• experience higher healthcare costs<br />
generally begin drinking at an earlier age than<br />
children of nonalcoholic parents. 12 Children who<br />
are restless <strong>and</strong> easily distracted at age 3 are twice<br />
as likely as their more focused counterparts to be<br />
diagnosed as alcoholic by age 21. 10<br />
The interaction of genetic <strong>and</strong> environmental<br />
factors influences the probability<br />
that a young person will abuse alcohol.<br />
Parental drinking patterns <strong>and</strong> access to alcohol<br />
are associated with adolescents starting <strong>and</strong> continuing<br />
drinking. 26 Conversely, children who are<br />
warned about the negative consequences of<br />
drinking are less likely to begin. 2 Also, factors<br />
such as lack of parental support, monitoring, <strong>and</strong><br />
communication contribute to alcohol abuse by<br />
adolescents. Children who are rejected or mistreated<br />
are much more likely to develop problems<br />
with alcohol.<br />
Many adolescents develop positive expectations<br />
about alcohol use, which factor <strong>into</strong> their decision<br />
about whether to begin drinking. These attitudes<br />
are influenced by positive depictions of alcohol<br />
use in movies, on television, <strong>and</strong> in advertisements.<br />
Our society has an ambivalent attitude<br />
toward alcohol consumption, sometimes restricting<br />
it <strong>and</strong> at other times promoting it. For<br />
example, television networks in the United States<br />
show advertisements for beer <strong>and</strong> wine but not for<br />
distilled liquor. This voluntary ban on television<br />
advertising of hard liquor could end. The positive<br />
messages about drinking do not escape the notice<br />
of our youngest citizens. A recent study examining<br />
50 children’s animated films for examples of<br />
tobacco <strong>and</strong> alcohol use found that 25 of the films<br />
(50 percent) depicted alcohol use. Furthermore,<br />
the characters drinking alcohol were as likely to<br />
be “good” characters as “bad” ones. 22<br />
As children grow older, their drinking or abstinence<br />
is influenced more by their peers <strong>and</strong> less<br />
by their parents. College students have been<br />
found to pattern their drinking after the amounts<br />
they perceive their peers to drink, not what their<br />
peers actually consume. 4, 5, 49 These students consistently<br />
overestimated the amount of alcohol<br />
41<br />
Information about <strong>Alcohol</strong>
<strong>Underst<strong>and</strong>ing</strong> <strong>Alcohol</strong>: <strong>Investigations</strong> <strong>into</strong> <strong>Biology</strong> <strong>and</strong> <strong>Behavior</strong><br />
consumed by their peers. This bias promotes<br />
heavier drinking habits. These studies also show<br />
that college students are less prone to heavy<br />
drinking after the spring term than the fall term.<br />
Presumably, they have experienced some of the<br />
negative consequences of alcohol abuse <strong>and</strong> temper<br />
their enthusiasm for drinking. Young people<br />
are also prone to model their drinking patterns<br />
after people they admire, such as athletes, actors,<br />
<strong>and</strong> musicians. 29<br />
Ultimately, each individual must decide whether<br />
to use alcohol or not. Students who underst<strong>and</strong><br />
the changes alcohol causes in their bodies <strong>and</strong><br />
how these changes affect their health <strong>and</strong> behavior<br />
can make informed decisions about drinking.<br />
Providing that underst<strong>and</strong>ing is the first of the<br />
four objectives mentioned in the introduction to<br />
this curriculum supplement (see page 1).<br />
10 Consequences of <strong>Alcohol</strong> Abuse<br />
<strong>and</strong> <strong>Alcohol</strong>ism<br />
10.1 The costs to society. Approximately two-thirds<br />
of American adults drink alcohol at least once during<br />
the course of a year. Most people drink responsibly,<br />
but approximately 13.8 million Americans<br />
have problems related to either alcohol abuse or<br />
alcoholism. 23 The risk for developing alcoholrelated<br />
problems is higher among those who begin<br />
drinking when they are young. Research shows<br />
that biological (genetic) <strong>and</strong> psychosocial factors<br />
combine with environmental factors, such as the<br />
availability of alcohol, to increase the risk for<br />
developing drinking problems. 55<br />
Biological (genetic) <strong>and</strong> psychosocial<br />
factors combine with environmental<br />
factors, such as the availability of<br />
alcohol, to increase the risk for<br />
developing drinking problems.<br />
<strong>Alcohol</strong> abuse <strong>and</strong> alcoholism have a large economic<br />
impact on our society. In 1998, alcohol<br />
abuse <strong>and</strong> alcoholism cost an estimated $185 billion<br />
in lost productivity, illness, premature death,<br />
<strong>and</strong> healthcare expenditures. For 1995, these<br />
costs were estimated to be over $166 billion, <strong>and</strong><br />
in 1992, they were $148 billion. 47 A large portion<br />
of these costs is borne, in various ways, by<br />
nonabusers (see Figure 14). 56 While 45 percent of<br />
the costs of alcohol abuse fall on the abusers<br />
themselves <strong>and</strong> their families, 38 percent falls on<br />
government (in the form of lost or reduced tax<br />
revenue). Additional costs to nonabusers include,<br />
but are not limited to, the economic costs of the<br />
criminal justice system <strong>and</strong> higher insurance premiums,<br />
as well as the social costs of alcoholrelated<br />
crimes <strong>and</strong> trauma. Some examples of the<br />
social costs of alcohol abuse <strong>and</strong> alcoholism are<br />
discussed in greater detail later.<br />
Figure 14. Distribution of the cost of alcohol<br />
abuse in the United States in 1998.<br />
10.2 Drinking <strong>and</strong> driving. Although the proportion<br />
of crash fatalities attributable to drinking is<br />
declining, the problem is still serious, claiming<br />
about 15,000 lives annually in the United States.<br />
All states have laws stipulating driver BAC limits.<br />
Half the states have already established 0.08 as<br />
their per se level (meaning no other evidence of<br />
<strong>into</strong>xication is required), while the other half currently<br />
have a limit of 0.10. <strong>Alcohol</strong> poses a more<br />
serious risk for younger drivers. They have less<br />
experience with driving <strong>and</strong> alcohol <strong>and</strong> consequently<br />
exhibit higher crash rates. Recognizing<br />
42
this fact, all states have laws aimed specifically at<br />
preventing underage drinking <strong>and</strong> driving. Important<br />
among these are the minimum legal drinking<br />
age of 21 <strong>and</strong> zero-tolerance laws for underage<br />
drinking <strong>and</strong> driving. In addition, some states have<br />
enacted graduated driver licensing (GDL) systems.<br />
These systems often feature a three-phase process<br />
where 16- <strong>and</strong> 17-year-old drivers first are required<br />
to be supervised at all times by an older driver. The<br />
second stage allows them to drive unsupervised<br />
during daytime hours. The third stage imposes few<br />
restrictions. Recent reports indicate that GDL programs<br />
are successful. Crashes involving 16-yearold<br />
drivers declined 25 percent in Michigan <strong>and</strong> 27<br />
percent in North Carolina following implementation<br />
of GDL<br />
19, 52<br />
programs.<br />
Some driving skills are more impaired than others<br />
for a given BAC. The brain must control eye<br />
movement, briefly focusing on objects <strong>and</strong> tracking<br />
them. Low to moderate BACs (0.03–0.05) can<br />
interfere with the ability to track objects. Steering<br />
depends upon eye-to-h<strong>and</strong> reactions together<br />
with eye movements. Studies show that people<br />
have significant trouble steering a car with BACs<br />
beginning at 0.02. 42 <strong>Alcohol</strong> also interferes with<br />
the brain’s information-processing ability. Another<br />
important aspect of driving is the ability of the<br />
driver to divide his or her attention. A driver must<br />
keep the car in its proper lane while at the same<br />
time paying attention to the local environment.<br />
<strong>Alcohol</strong> causes people to favor one activity over<br />
the other. Typically, alcohol-impaired drivers pay<br />
more attention to steering their car than they do<br />
to their local surroundings.<br />
Some statistics about alcohol <strong>and</strong> driving compiled<br />
by the U.S. Department of Transportation<br />
include the following 39 :<br />
• <strong>Alcohol</strong> was involved in 39 percent of fatal<br />
crashes <strong>and</strong> in 7 percent of all crashes in 1997.<br />
• About 3 in every 10 Americans will be involved<br />
in an alcohol-related crash at some time in their<br />
lives.<br />
• In 1997, the age group of drivers with the highest<br />
rates for fatal crashes while <strong>into</strong>xicated was<br />
21–24 years old (26.3 percent), followed by ages<br />
25–34 (23.8 percent) <strong>and</strong> 35–44 (22.1 percent).<br />
Figure 15. The Breathalyzer is used by law<br />
enforcement personnel to measure BACs.<br />
• Relatively few problem drinkers (about 7 percent<br />
of all drivers) account for over 66 percent<br />
of all alcohol-related fatal crashes.<br />
• One-third of all pedestrians 16 years of age or<br />
older killed in traffic crashes in 1997 were<br />
<strong>into</strong>xicated.<br />
• In 1997, an estimated 846 lives were saved by<br />
minimum-drinking-age laws.<br />
10.3 Drinking <strong>and</strong> risky behavior. The perception<br />
of risk, risk taking, acting on impulse, <strong>and</strong> sensation-seeking<br />
behaviors are all affected by alcohol<br />
use. Among males, higher levels of drinking lead<br />
to increased risk-taking behaviors. 14 One study<br />
revealed that among a group of adults who came to<br />
the emergency room for alcohol-related injuries,<br />
three-fourths admitted to not using seat belts. 8<br />
Adolescents who drink are more likely to report<br />
that they engage in risky behaviors such as swimming<br />
alone or taking someone else’s medication. 60<br />
The perception of risk, risk taking, acting<br />
on impulse, <strong>and</strong> sensation-seeking<br />
behaviors are all affected by alcohol use.<br />
The association between alcohol use <strong>and</strong> risky<br />
behavior applies to sexual behaviors, as well. The<br />
consequences of such behaviors can include rape,<br />
43<br />
Information about <strong>Alcohol</strong>
<strong>Underst<strong>and</strong>ing</strong> <strong>Alcohol</strong>: <strong>Investigations</strong> <strong>into</strong> <strong>Biology</strong> <strong>and</strong> <strong>Behavior</strong><br />
transmission of diseases, unwanted pregnancies,<br />
<strong>and</strong> birth defects. Surveys of young people show<br />
an association between alcohol use <strong>and</strong> engaging<br />
in risky sexual behaviors. 53 Among boys, 17 percent<br />
said that they were less likely to use condoms<br />
when having sex after drinking. <strong>Alcohol</strong> use also<br />
correlates with increased risk of forced sexual<br />
activity. In one study of Massachusetts teenagers,<br />
44 percent said they were more likely to engage in<br />
sexual intercourse if they had been drinking. 53<br />
Sometimes risky behavior associated with drinking<br />
may be inadvertent. For example, mixing<br />
alcohol with some medicines can produce serious<br />
<strong>and</strong> even fatal consequences. Anyone taking prescription<br />
<strong>and</strong>/or over-the-counter medications<br />
should carefully read the labels <strong>and</strong> check with a<br />
pharmacist, physician, or other health professional<br />
to be aware of possible adverse reactions if<br />
the drug is mixed with alcohol.<br />
10.4 Drinking <strong>and</strong> pregnancy. Pregnant women<br />
who drink expose their unborn children to alcohol<br />
through the placenta. That exposure can lead<br />
to fetal alcohol syndrome (FAS), which is characterized<br />
by a variety of developmental problems,<br />
some of which can be severe (see Table 6, below,<br />
<strong>and</strong> The immune system, on pages 36–37). FAS is<br />
estimated to be the most common preventable<br />
cause of mental retardation in children. Although<br />
not completely understood, the severity of the<br />
signs <strong>and</strong> symptoms seems to be related to the<br />
amount, frequency, <strong>and</strong> timing of alcohol consumption<br />
by the mother during pregnancy.<br />
Diagnosis of FAS has been greatly improved by<br />
discoveries in alcohol research. Still, because there<br />
Table 6. Characteristics of Fetal <strong>Alcohol</strong> Syndrome<br />
growth deficiency either before or after birth<br />
distinctive abnormal facial features<br />
central nervous system disorders, including:<br />
• cognitive deficits<br />
• developmental delays<br />
• behavioral impairments<br />
• structural abnormalities<br />
is no simple laboratory test to detect FAS, it is difficult<br />
to estimate its incidence with great accuracy.<br />
Complicating this situation are studies that indicate<br />
that some physicians are reluctant to make<br />
the diagnosis even when it does exist. Presumably,<br />
they don’t want the child burdened with the<br />
stigma associated with FAS, <strong>and</strong> they recognize<br />
that the disorder has limited treatment options.<br />
Nevertheless, early <strong>and</strong> accurate diagnosis <strong>and</strong><br />
referrals of these children <strong>and</strong> their parents/caregivers<br />
for appropriate medical, social, <strong>and</strong> educational<br />
services is effective.<br />
On the basis of a study in Washington State, it has<br />
been estimated that the minimum rate of FAS in the<br />
general population is 3.1 per 1,000 live births, or<br />
0.31 percent. 15 Among heavy drinkers, the rate is<br />
4.3 percent, which translates to more than 2,000<br />
cases per year in the United States. 54 The incidence<br />
of FAS varies among different racial <strong>and</strong> ethnic<br />
groups. For example, data from the Centers for Disease<br />
Control <strong>and</strong> Prevention indicate that the incidence<br />
of FAS is seven times greater among African<br />
Americans than European Americans. Some Native<br />
American groups have a 30-fold greater incidence<br />
of FAS than the general population. 13 Since some<br />
populations are disproportionately affected by FAS,<br />
it is important that researchers, healthcare<br />
providers, <strong>and</strong> educators from these populations be<br />
involved in obtaining knowledge about <strong>and</strong> treatments<br />
for this serious disorder.<br />
An additional unestimated number of children are<br />
born each year who were exposed to alcohol in<br />
utero but do not have the full syndrome. Their<br />
condition is termed fetal alcohol effects (FAE).<br />
They show one or more birth abnormalities associated<br />
with alcohol exposure. These may be either<br />
physical or neurodevelopmental.<br />
The deficits associated with FAS are lifelong.<br />
Although the distinctive facial features of FAS<br />
become less apparent after puberty, the intellectual<br />
impairments remain, <strong>and</strong> emotional, behavioral,<br />
<strong>and</strong> social problems often get worse. In one<br />
study, adolescents <strong>and</strong> adults with FAS were found<br />
to have arithmetic skills at the second- to fourthgrade<br />
levels. 54 Children with FAS are often<br />
44
described as hyperactive with short attention<br />
spans. They display a number of behavioral problems<br />
including poor judgment, failure to consider<br />
the consequences of their actions, <strong>and</strong> failure to<br />
appropriately respond to social cues.<br />
to a child’s second birthday. In rats, this period<br />
occurs for a short period after the pup is born. The<br />
scientists exposed newborn rat pups to a BAC of<br />
0.20 (about twice the BAC defined as legally<br />
<strong>into</strong>xicated in humans). This high BAC was maintained<br />
for four hours or longer. A one-time exposure<br />
of four hours was sufficient to cause brain<br />
cells to die off at a rate nearly 30 times greater<br />
than normal. 27 Although it is difficult to translate<br />
these results from rats to humans, the uncertainties<br />
involved led the authors to advise expectant<br />
mothers to avoid alcohol entirely during their<br />
pregnancies.<br />
A high BAC can destroy nerve cells in<br />
the developing rat brain.<br />
Figure 16. Pregnant women should not drink<br />
alcohol.<br />
The timing of alcohol exposure during pregnancy<br />
is critical to the development of FAS <strong>and</strong> FAE. By<br />
using animal studies to explore the relationship<br />
between alcohol exposure <strong>and</strong> FAS, researchers<br />
are able to control not only the timing <strong>and</strong> dose of<br />
alcohol during pregnancy, but also the genetic<br />
background <strong>and</strong> environment of the test animals.<br />
A high BAC can destroy nerve cells in the developing<br />
rat brain. 27 The timing of this nervedestroying<br />
alcohol exposure in rats corresponds<br />
to the brain growth spurt in humans, called<br />
synaptogenesis, when brain cells form most of<br />
their interconnections. In humans, synaptogenesis<br />
lasts from about the sixth month of pregnancy<br />
10.5 Drinking <strong>and</strong> violence. It has long been<br />
observed that there is an association between alcohol<br />
use <strong>and</strong> aggressive or violent behavior. Clearly,<br />
violence occurs in the absence of alcohol, <strong>and</strong><br />
drinking alcohol alone is not sufficient to cause<br />
violence. However, numerous studies have found<br />
that alcohol is involved with about half of perpetrators<br />
of violence <strong>and</strong> their victims. This relationship<br />
holds across cultures <strong>and</strong> for various<br />
types of violence. In the United States, alcohol use<br />
is a significant factor in 47<br />
• 68 percent of manslaughter cases<br />
• 62 percent of assault offenders<br />
• 54 percent of murders<br />
• 48 percent of robberies<br />
• 44 percent of burgerlies<br />
The mechanism by which alcohol contributes to<br />
aggressive behaviors is not completely understood.<br />
<strong>Alcohol</strong> may interfere with the brain’s mechanisms<br />
for restraining impulsive behaviors. Individuals<br />
who are <strong>into</strong>xicated may misread social cues, overreact<br />
to situations, <strong>and</strong> not be able to accurately<br />
anticipate the consequences of their actions. In<br />
addition, alcohol consumption can lead to<br />
increased vulnerability in potential victims. Intoxicated<br />
people are often less able to defend themselves<br />
against a violent attack than are people who<br />
are sober. For example, a survey of students in<br />
45<br />
Information about <strong>Alcohol</strong>
<strong>Underst<strong>and</strong>ing</strong> <strong>Alcohol</strong>: <strong>Investigations</strong> <strong>into</strong> <strong>Biology</strong> <strong>and</strong> <strong>Behavior</strong><br />
grades 8 <strong>and</strong> 10 across the United States showed<br />
that alcohol use correlates significantly to risky<br />
behavior <strong>and</strong> victimization. This association was<br />
strongest among eighth-grade males. 61<br />
Individuals who are <strong>into</strong>xicated<br />
may misread social cues, overreact<br />
to situations, <strong>and</strong> not be able to<br />
accurately anticipate the consequences<br />
of their actions.<br />
One experimental approach to studying the relationship<br />
of alcohol to aggressive behavior is to<br />
have a test subject administer an electric shock to<br />
an unseen “opponent” as part of a competitive<br />
task, such as one involving learning <strong>and</strong> reaction<br />
time. Unknown to the test subject, a computer<br />
plays the role of the opponent. The test subject<br />
performs the task while sober <strong>and</strong> after alcohol<br />
consumption. Such studies show that test subjects<br />
administer stronger electric shocks with increasing<br />
alcohol consumption. These same studies also<br />
reveal that test subjects do not display aggressive<br />
behavior unless they feel threatened or provoked. 8<br />
Once again, these results show that alcohol alone<br />
is associated with, but not sufficient to account<br />
for, aggressive behavior.<br />
The relationship between alcohol <strong>and</strong> violence is<br />
complex. <strong>Alcohol</strong> seems to influence aggressive<br />
behaviors in some individuals but not others, <strong>and</strong><br />
only in certain social or cultural situations.<br />
Although our knowledge of the causes of violence<br />
is limited, research suggests that some violence<br />
may be treatable through behavioral therapies.<br />
Studies also show that successful alcoholism treatments<br />
have the added benefit of reducing violent<br />
behaviors.<br />
46
Glossary<br />
absorption phase: The time immediately after<br />
consumption when blood alcohol concentration<br />
rises sharply.<br />
acetaldehyde: One of the first products of the<br />
body’s metabolism of alcohol. Acetaldehyde is<br />
then converted to carbon dioxide <strong>and</strong> water,<br />
which are excreted from the body.<br />
acute: Short-term.<br />
addiction: A state that involves a physical or psychological<br />
dependency on a drug or alcohol.<br />
alcohol: The <strong>into</strong>xicating chemical in drinks such<br />
as beer, wine, <strong>and</strong> distilled liquors. <strong>Alcohol</strong> is a<br />
colorless, volatile liquid with the chemical formula<br />
C 2 H 5 OH, also called ethanol or ethyl alcohol.<br />
It is a central nervous system depressant.<br />
alcohol abuse: The continued use of alcohol<br />
despite the development of social, legal, or health<br />
problems.<br />
alcohol addiction, alcohol dependence, or alcoholism:<br />
A chronic disease characterized by a<br />
strong craving for alcohol, a constant or periodic<br />
reliance on use of alcohol despite adverse consequences,<br />
the inability to limit drinking, physical<br />
illness when drinking is stopped, <strong>and</strong> the need for<br />
increasing amounts of alcohol to feel its effects.<br />
alcohol dehydrogenase (ADH): An enzyme found<br />
in the liver <strong>and</strong> stomach that helps break down<br />
alcohol <strong>into</strong> substances that can be excreted from<br />
the body. Specifically, ADH converts alcohol <strong>into</strong><br />
acetaldehyde, which is then converted to carbon<br />
dioxide <strong>and</strong> water.<br />
alcoholic hepatitis: Liver disease caused by<br />
chronic ingestion of alcohol.<br />
alleles: Different variations of the same gene.<br />
arteries: Thick-walled blood vessels that carry<br />
blood away from the heart.<br />
axon: Extensions of nerve cells that carry the<br />
nerve impulses away from the nerve cell body.<br />
binge drinking: A pattern of heavy drinking that<br />
occurs during an extended period of time set aside<br />
for drinking. Has been described as 5/4 binge<br />
drinking: five or more drinks in a row on a single<br />
occasion for a man or four or more drinks for a<br />
woman.<br />
blood alcohol concentration (BAC): The amount<br />
of alcohol in the blood expressed as a percent:<br />
grams of ethanol per 100 milliliters (deciliter) of<br />
blood.<br />
brainstem: The part of the brain that connects the<br />
spinal cord with other parts of the brain.<br />
CAGE: Refers to a questionnaire developed by<br />
Dr. John Ewing to screen for alcohol abuse <strong>and</strong><br />
alcoholism. The name comes from the first letters<br />
of key words in the questionnaire: Cut down on<br />
drinking, Annoyed by people criticizing your<br />
drinking, Guilty about drinking, <strong>and</strong> drinking as<br />
an Eye opener.<br />
cardiovascular system: The organ system that<br />
includes the blood, the heart, <strong>and</strong> blood vessels.<br />
cerebellum: The region of the brain involved with<br />
coordination of muscles <strong>and</strong> maintaining balance<br />
<strong>and</strong> posture.<br />
chromosomes: Rod-like, gene-bearing structures<br />
found in the cell nucleus. They are composed of<br />
DNA <strong>and</strong> protein. Humans have 46 chromosomes.<br />
47
<strong>Underst<strong>and</strong>ing</strong> <strong>Alcohol</strong>: <strong>Investigations</strong> <strong>into</strong> <strong>Biology</strong> <strong>and</strong> <strong>Behavior</strong><br />
chronic: Long-term; refers to diseases or habits<br />
that last a long time, recur, or are difficult to cure.<br />
cirrhosis: Hardening of connective tissue in the<br />
liver; fibrosis.<br />
cognitive: Relating mental awareness <strong>and</strong> judgment.<br />
coronary artery disease: A condition in which<br />
cholesterol <strong>and</strong> fat in the blood build up in<br />
clumps known as plaque on the inside walls of<br />
arteries. This build-up can restrict the flow of<br />
blood <strong>and</strong> thus of oxygen to the heart. Oxygen<br />
starvation of the heart muscle can lead to a heart<br />
attack.<br />
cytokines: A class of molecules that help regulate<br />
the activities of the immune system.<br />
delirium tremens (DTs): A serious alcohol-withdrawal<br />
syndrome observed in persons who stop<br />
drinking alcohol following continuous <strong>and</strong> heavy<br />
consumption. It involves profound confusion,<br />
hallucinations, <strong>and</strong> severe nervous system overactivity,<br />
typically beginning between 48 <strong>and</strong> 96 hours<br />
after the last drink.<br />
dendrite: A cluster of small fibers that receive<br />
chemical messages from neighboring neurons <strong>and</strong><br />
transmit them to the cell body.<br />
depressant: A substance that causes sedation <strong>and</strong><br />
drowsiness. <strong>Alcohol</strong> is a central nervous system<br />
depressant.<br />
diffusion: The passive movement of a substance<br />
from a region where it is more concentrated to a<br />
region where it is less concentrated. For example,<br />
blood alcohol concentration decreases as alcohol<br />
diffuses from the blood <strong>into</strong> body tissues.<br />
distillation: A process that uses heat to purify or<br />
separate a fraction of a complex substance. Various<br />
components of the mixture are collected as<br />
gases condense to liquids. Liquors are produced<br />
through distillation.<br />
distribution phase: The process by which ethanol<br />
spreads from the blood to all tissues <strong>and</strong> fluids in<br />
proportion to their relative water content.<br />
dopamine: A chemical messenger (neurotransmitter)<br />
that regulates brain processes such as<br />
those that control movements, emotions, pleasure,<br />
<strong>and</strong> pain.<br />
drug: In a medical context, any substance used in<br />
the diagnosis, prevention, treatment, or cure of a<br />
disease. In an abuse context, any substance that<br />
alters consciousness <strong>and</strong> may be habit forming.<br />
elimination phase: The combined processes of<br />
metabolism <strong>and</strong> excretion that decrease blood<br />
alcohol concentration.<br />
endorphins: A class of protein hormones produced<br />
in the brain that have pain-relieving properties.<br />
endotoxin: A bacterial toxin composed of protein,<br />
lipid, <strong>and</strong> polysaccharides.<br />
enzyme: A class of proteins that speed up chemical<br />
reactions in the body.<br />
esophageal cancer: Cancer of the esophagus<br />
(throat).<br />
esophagus: The part of the digestive system that<br />
receives food. This is the tube leading from the<br />
mouth to the stomach.<br />
ethanol: See alcohol.<br />
ethyl alcohol: See alcohol.<br />
euphoria: A feeling of well being.<br />
excretion: The loss of ethanol from the body<br />
through urine, sweat, breath, <strong>and</strong> other routes of<br />
exit.<br />
fermentation: An anaerobic process (not requiring<br />
oxygen) in which organisms convert sugars<br />
<strong>into</strong> alcohol <strong>and</strong> carbon dioxide. This process<br />
does not occur in animals but is used extensively<br />
by yeast (single-celled fungi). Humans exploit this<br />
phenomenon to make bread (the gas bubbles<br />
exp<strong>and</strong> the dough) as well as wine <strong>and</strong> beer (for<br />
the alcohol produced).<br />
fetal alcohol effects (FAE): A pattern of mental<br />
<strong>and</strong> physical birth abnormalities associated with<br />
children whose mothers abused alcohol during<br />
48
pregnancy. The symptoms are less severe than<br />
those in fetal alcohol syndrome.<br />
fetal alcohol syndrome (FAS): A pattern of mental<br />
<strong>and</strong> physical birth abnormalities found in some<br />
children of mothers who drank excessively during<br />
pregnancy.<br />
fibrosis: A condition within a tissue or an organ<br />
that is characterized by an increase in fibrous<br />
tissue.<br />
free radicals: Short-lived, highly reactive molecules<br />
that have one or more unpaired electrons.<br />
functional tolerance: A state in which a chronic<br />
alcohol abuser learns to function under the influence<br />
of alcohol. The impairment normally associated<br />
with performing a familiar task is reduced,<br />
but the ability to perform unfamiliar tasks remains<br />
impaired.<br />
gastritis: An inflammation of the stomach lining.<br />
gene: The functional <strong>and</strong> physical unit of heredity.<br />
Genes are segments of DNA found along a chromosome.<br />
They typically encode information used<br />
to produce a specific protein.<br />
genetically predisposed: Having variations in<br />
genes that increase the probability of displaying a<br />
given trait.<br />
genotype: The genetic makeup of an individual.<br />
The expression of genotype as visible traits is<br />
called the phenotype.<br />
glucagon: A pancreatic hormone that increases<br />
the concentration of blood sugar. Its effect is<br />
opposite to that of insulin.<br />
growth hormones: Hormones that affect growth<br />
of the body, for example, by stimulating cell division<br />
<strong>and</strong> bone growth.<br />
hallucination: The experience of sights <strong>and</strong><br />
sounds that are not actually present.<br />
hippocampus: A part of the brain that is responsible<br />
for learning <strong>and</strong> spatial relations.<br />
hormone: A chemical released <strong>into</strong> the bloodstream<br />
that stimulates or inhibits an action in<br />
another body tissue.<br />
hypertension: A condition of abnormally high<br />
blood pressure.<br />
hypothalamus: A small area of the brain that is<br />
responsible for regulating the release of some hormones<br />
<strong>and</strong> maintaining body temperature.<br />
impairment: Diminished ability, such as when<br />
alcohol decreases motor function or interferes<br />
with thinking.<br />
inflammation: The body’s response to tissue damage<br />
characterized by redness, swelling, heat, <strong>and</strong><br />
pain.<br />
inhibition: As related to behavior, restraint on<br />
instinctive impulses.<br />
insulin: A hormone produced in the pancreas that<br />
lowers the blood sugar level. Its effect is opposite<br />
to that of glucagon.<br />
<strong>into</strong>xication: The condition of being drunk. An<br />
abnormal state that is essentially alcohol poisoning.<br />
It is characterized by slurred speech <strong>and</strong> a loss<br />
of coordination.<br />
limbic system: The areas of the brain involved<br />
with emotions <strong>and</strong> memory.<br />
lymphocytes: The white blood cells, the T cells,<br />
<strong>and</strong> B cells of the immune system.<br />
metabolism: All the chemical reactions that<br />
enable the body to function. Nutrients <strong>and</strong> materials<br />
are broken down <strong>into</strong> stored energy or <strong>into</strong><br />
usable compounds. The biological transformation<br />
of ethanol to acetaldehyde <strong>and</strong> other products.<br />
mitochondria: The cellular organelles that function<br />
as energy factories in the cell. Mitochondria<br />
produce ATP (the energy currency of our bodies).<br />
motor function: The ability to use <strong>and</strong> control<br />
muscles <strong>and</strong> movements. <strong>Alcohol</strong> <strong>and</strong> drugs interfere<br />
with the neuronal messages from our brain to<br />
muscles resulting in impaired motor function.<br />
naltrexone: A drug that has been effective in the<br />
recovery from alcoholism. It blocks receptors for<br />
endorphins, thereby reducing alcohol cravings.<br />
Use of the drug in combination with psychosocial<br />
therapy improves the effectiveness of treatment.<br />
49<br />
Glossary
<strong>Underst<strong>and</strong>ing</strong> <strong>Alcohol</strong>: <strong>Investigations</strong> <strong>into</strong> <strong>Biology</strong> <strong>and</strong> <strong>Behavior</strong><br />
neurons: One of two principal classes of cells in<br />
the nervous system, composed of three parts: the<br />
cell body, dendrites, <strong>and</strong> axons. Neurons receive<br />
<strong>and</strong> conduct electrical impulses.<br />
neurotransmission: The process by which neurons<br />
transmit messages to other neurons, muscle<br />
cells, or gl<strong>and</strong> cells.<br />
neurotransmitter: A chemical substance that<br />
transmits a nerve impulse across a synapse.<br />
nucleus accumbens: The part of the brain related<br />
to the limbic system that controls emotions.<br />
pancreatitis: An acute or chronic inflammation of<br />
the pancreas associated with alcoholism <strong>and</strong><br />
marked by severe abdominal pain, nausea, <strong>and</strong><br />
fever.<br />
pharmacokinetics: The study of the absorption,<br />
distribution, <strong>and</strong> elimination of alcohol <strong>and</strong> other<br />
drugs.<br />
physical dependence: A condition in which the<br />
presence of a drug or alcohol is required to maintain<br />
normal functioning of the central nervous<br />
system. (See withdrawal symptoms.) Physical<br />
dependence is caused by changes in the relationships<br />
among nerve cell membranes, neurotransmitters<br />
<strong>and</strong> their receptors, <strong>and</strong> the reward<br />
pathway.<br />
placenta: A membranous organ that develops during<br />
pregnancy. It lines the uterine wall, partially<br />
envelopes the fetus, <strong>and</strong> is attached to the umbilical<br />
cord. The placenta exchanges nutrients,<br />
wastes, <strong>and</strong> gases between maternal <strong>and</strong> fetal<br />
blood. Substances ingested by the mother during<br />
pregnancy pass through the placenta to the fetus.<br />
polygenic: A trait, such as alcoholism, whose<br />
expression is influenced by more than one gene.<br />
predispose: To make susceptible, such as to certain<br />
health problems or to alcohol dependency.<br />
For example, the presence of certain gene combinations<br />
or environmental conditions can predispose<br />
an individual to develop alcoholism.<br />
prefrontal cortex: The part of the frontal lobe of<br />
the brain that relates to pleasure.<br />
psychosocial: Involving both social <strong>and</strong> psychological<br />
behavior.<br />
reinforcement: The positive effects of alcohol,<br />
such as its euphoric <strong>and</strong> anxiety-reducing effects,<br />
that help promote continued drinking. Specific<br />
neurotransmitters <strong>and</strong> regions of the brain are<br />
implicated in alcohol’s reinforcing effects.<br />
relapse: To fall back or revert to an earlier state; to<br />
regress after partial recovery. In the context of<br />
alcohol abuse <strong>and</strong> alcoholism, relapse means to<br />
start drinking again after giving up alcohol.<br />
reproductive hormones: Hormones that influence<br />
development of secondary sexual traits <strong>and</strong> the<br />
production of or maturation of the sperm <strong>and</strong> the<br />
egg. These include testosterone, leutinizing hormone<br />
(LH), follicle stimulating hormone (FSH),<br />
estrogen, <strong>and</strong> progesterone.<br />
reward pathway: A specialized network of neurons<br />
in the brain that produce <strong>and</strong> regulate pleasure<br />
associated with eating, drinking, <strong>and</strong> sex.<br />
These neurons use dopamine as a neurotransmitter.<br />
<strong>Alcohol</strong> activates the reward pathway. <strong>Alcohol</strong><br />
abusers <strong>and</strong> alcoholics use alcohol to avoid the<br />
pain (lack of pleasure) associated with withdrawal.<br />
sobriety: The condition of refraining from drinking<br />
alcohol.<br />
sodium-potassium pump: Proteins embedded in<br />
the cell membrane that actively move potassium<br />
ions <strong>into</strong> the cell <strong>and</strong>, at the same time, move<br />
sodium ions out.<br />
soluble: Capable of being dissolved in a solvent<br />
such as water or another liquid.<br />
stimulant: A substance such as caffeine, nicotine,<br />
or amphetamines that temporarily arouses or<br />
accelerates physiological activity in the brain.<br />
stupor: A state of impaired consciousness accompanied<br />
by diminished responsiveness to external<br />
stimuli <strong>and</strong> surroundings.<br />
synapse: The tiny space between two nerve cells<br />
or between a nerve cell <strong>and</strong> a muscle or gl<strong>and</strong> cell.<br />
50
synaptogenesis: The time frame from about the<br />
sixth month of pregnancy to a child’s second<br />
birthday when the brain experiences a growth<br />
spurt <strong>and</strong> brain cells form most of their interconnections.<br />
testosterone: A sex hormone responsible for secondary<br />
sex characteristics. Present in both males<br />
<strong>and</strong> females but at lower concentrations in<br />
females.<br />
tolerance: The body’s ability to adapt to chronic<br />
alcohol or substance use. Higher BACs are needed<br />
to produce <strong>into</strong>xication in alcohol abusers <strong>and</strong><br />
alcoholics. Chronic alcohol use leads to increased<br />
levels of liver enzymes that metabolize alcohol.<br />
Since they allow the liver to more efficiently break<br />
down alcohol, the individual must consume a<br />
larger dose to reach a given BAC. This increased<br />
level of alcohol can severely damage the body’s<br />
physiological systems, despite the apparent “normalcy”<br />
displayed by the individual.<br />
tuberculosis: A communicable disease caused by<br />
a bacterium that causes lesions of the lung, bone,<br />
<strong>and</strong> other body parts. Drug <strong>and</strong> alcohol abusers<br />
are infected at a rate 15–200 times greater than<br />
that of nonabusers.<br />
ventral tegmental area: Component of the reward<br />
pathway in the brain; located near the top of the<br />
brainstem.<br />
withdrawal symptoms: Severe alcohol cravings as<br />
well as physical <strong>and</strong> psychological problems<br />
caused by the withdrawal from excessive, chronic<br />
alcohol consumption. The biochemical changes<br />
lead to short-term memory loss, disruption of<br />
cognitive <strong>and</strong> motor function, reduced perceptual<br />
abilities, <strong>and</strong> emotional <strong>and</strong> personality changes<br />
that include acts of aggression.<br />
zero-tolerance laws: Laws that exist in all states<br />
<strong>and</strong> the District of Columbia making it illegal for<br />
anyone under the age of 21 to drive a car after<br />
drinking any alcohol.<br />
51<br />
Glossary
References<br />
1. American Psychiatric Association. 1994.<br />
Diagnostic <strong>and</strong> Statistical Manual of Mental<br />
Disorders (4th ed.). Washington, DC: American<br />
Psychiatric Association.<br />
2. Ary, D.V., Tildesley, E., Hops, H., <strong>and</strong><br />
Andrews, J. 1993. The influence of parent,<br />
sibling, <strong>and</strong> peer modeling attitudes on adolescent<br />
use of alcohol. International Journal of<br />
Addiction, 28: 853–880.<br />
3. Badawy, A.A.B. 1998. <strong>Alcohol</strong>, aggression,<br />
<strong>and</strong> serotonin: Metabolic aspects. <strong>Alcohol</strong>,<br />
33: 66–72.<br />
4. Baer, J.S. 1994. Effects of college residence<br />
on perceived norms for alcohol consumption:<br />
An examination of the first year in college.<br />
Psychology of Addictive <strong>Behavior</strong>s, 8:<br />
43–50.<br />
5. Baer, J.S., <strong>and</strong> Carney, M.M. 1993. Biases in<br />
perceptions of the consequences of alcohol<br />
use among college students. Journal of Studies<br />
on <strong>Alcohol</strong>, 54: 54–60.<br />
6. Boggan, B. 2001. <strong>Alcohol</strong>, chemistry <strong>and</strong><br />
you. Retrieved January 15, 2002, from<br />
http://chemcases.com/alcohol/alc-04.htm<br />
7. Brotman, S., Indeck, M.C., Leonard, D., <strong>and</strong><br />
Huber, J. 1995. The study of the relationship<br />
between lifestyle characteristic self-reported<br />
drinking patterns <strong>and</strong> trauma. American Surgeon,<br />
61: 975–979.<br />
8. Brown, S.A., Tapert, S.F., Granholm, E., <strong>and</strong><br />
Delis, D.C. 2000. Neurocognitive functioning<br />
of adolescents: Effects of protracted alcohol<br />
use. <strong>Alcohol</strong>ism Clinical <strong>and</strong> Experimental<br />
Research, 24: 164–171.<br />
9. Bushman, B.J. 1997. Effects of alcohol on<br />
human aggression: validity of proposed<br />
explanations. In M. Galanter, Ed. Recent<br />
Developments in <strong>Alcohol</strong>ism (Vol. 13,<br />
pp. 227–243). New York: Plenum Press.<br />
10. Caspi, A., Moffitt, T.E., Newman, D.L., <strong>and</strong><br />
Sylvia, P.A. 1996. <strong>Behavior</strong>al observations at<br />
age 3 years predict adult psychiatric disorders:<br />
Longitudinal evidence from a birth<br />
cohort. Archives of General Psychiatry, 53:<br />
1033–1039.<br />
11. Casswell, S., <strong>and</strong> Gilmore, L. 1983. Early<br />
experiences with alcohol: A survey of an<br />
eight <strong>and</strong> nine year old sample. New Zeal<strong>and</strong><br />
Medical Journal, 96: 1001–1003.<br />
12. Chassin, L., <strong>and</strong> Barrera, M. Jr. 1993. Substance<br />
use escalation <strong>and</strong> substance use<br />
restraint among adolescent children of alcoholics.<br />
Psychology of Addictive <strong>Behavior</strong>s, 7:<br />
3–20.<br />
13. Chavez, G.F., Cordero, J.F., <strong>and</strong> Becerra, J.E.<br />
1989. Leading major congenital malformations<br />
among minority groups in the United<br />
States. Journal of the American Medical Association,<br />
261: 205–209.<br />
14. Cherpitel, C.J. 1993. <strong>Alcohol</strong>, injury, <strong>and</strong><br />
risk-taking behavior: Data from a national<br />
sample. <strong>Alcohol</strong> Clinical Experimental<br />
Research, 17: 762–766.<br />
15. Clarren, S.K., R<strong>and</strong>els, S.P., S<strong>and</strong>erson, M.,<br />
<strong>and</strong> Fineman, R.M. 2001. Screening for fetal<br />
alcohol syndrome in primary schools: A feasibility<br />
study. Teratology, 63: 3–10.<br />
53
<strong>Underst<strong>and</strong>ing</strong> <strong>Alcohol</strong>: <strong>Investigations</strong> <strong>into</strong> <strong>Biology</strong> <strong>and</strong> <strong>Behavior</strong><br />
16. Dick, D.M., Nurnberger, J.I. Jr., Edenberg,<br />
H.J., Goate, A., Crowe, R., Rice, J., et al.<br />
2002. Suggestive linkage in chromosome 1<br />
for a quantitative alcohol-related phenotype.<br />
<strong>Alcohol</strong> Clinical Experimental Research, 26:<br />
1453–1460.<br />
17. Dufour, M.C., Stinson, F.S., <strong>and</strong> Caces, M.F.<br />
1993. Trends in cirrhosis morbidity <strong>and</strong> mortality:<br />
United States. Seminars on Liver Disease,<br />
13: 109–125.<br />
18. Foroud, T., Bucholz, K.K., Edenberg, H.J.,<br />
Goate, A., Neuman, R.J., Porjesz, B., et al.<br />
1998. Linkage of an alcoholism-related severity<br />
phenotype to chromosome 16. <strong>Alcohol</strong>ism<br />
Clinical <strong>and</strong> Experimental Research, 22:<br />
2035–2042.<br />
19. Foss, R.D., Feaganes, J.R., <strong>and</strong> Rodgman,<br />
E.A. 2001. Initial effects of graduated driver<br />
licensing on 16-year-old driver crashes in<br />
North Carolina. Journal of the American Medical<br />
Association, 286: 1588–1592.<br />
20. Geller, E.S., <strong>and</strong> Kalsher, M.J. 1990. Environmental<br />
determinants of party drinking: Bartenders<br />
versus self-service. Environment <strong>and</strong><br />
<strong>Behavior</strong>, 22: 74–90.<br />
21. Geller, E.S., Russ, N.W., <strong>and</strong> Altomari, M.G.<br />
1986. Naturalistic observations of beer drinking<br />
among college students. Journal of<br />
Applied <strong>Behavior</strong> Analysis, 19: 391–396.<br />
22. Goldstein, A.O., Sobel, R.A., <strong>and</strong> Newman,<br />
G.R. 1999. Tobacco <strong>and</strong> alcohol use in G-<br />
rated children’s animated films. Journal of the<br />
American Medical Association, 281:<br />
1131–1136.<br />
23. Gordis, E. 1998. The neurobiology of alcohol<br />
abuse <strong>and</strong> alcoholism: Building knowledge,<br />
creating hope. Drug <strong>and</strong> <strong>Alcohol</strong> Dependence,<br />
51: 9–11.<br />
24. Grant, B.F. 1997. Age at onset of alcohol use<br />
<strong>and</strong> its association with DSM-IV alcohol abuse<br />
<strong>and</strong> dependence: Results of the national longitudinal<br />
alcohol epidemiologic survey. Journal<br />
of Substance Abuse, 9: 103–110.<br />
25. Grant, B.F., <strong>and</strong> Dawson, D.A. 1998. Age at<br />
onset of alcohol use <strong>and</strong> its association with<br />
DSM-IV alcohol abuse <strong>and</strong> dependence:<br />
Results of the national longitudinal alcohol<br />
epidemiologic survey. Journal of Substance<br />
Abuse, 10: 163–173.<br />
26. Hawkins, J.D., Graham, J.W., Maguin, E.,<br />
Hill, K.G., <strong>and</strong> Catalano, R.F. 1997. Exploring<br />
the effects of age of alcohol use initiation<br />
<strong>and</strong> psychosocial risk factors on subsequent<br />
alcohol misuse. Journal of Studies on <strong>Alcohol</strong>,<br />
58: 280–290.<br />
27. Ikonomidou, C., Bittigau, P., Ishimaru, M.J.,<br />
Wozniak, D.F., Koch, C., Genz, K., Price,<br />
M.T., Stefovska, V., Horster, F., Tenkova, T.,<br />
Dickranian, K., <strong>and</strong> Olney, J.W. 2000. Ethanolinduced<br />
apoptotic neurodegeneration <strong>and</strong> fetal<br />
alcohol syndrome. Science, 287: 1056–1060.<br />
28. Kalant, H. 1996. Pharmacokinetics of alcohol:<br />
Aborption, distribution, <strong>and</strong> elimination. In<br />
H. Begleiter <strong>and</strong> B. Kissin, Eds. (pp. 15–58).<br />
Pharmacology of <strong>Alcohol</strong> <strong>and</strong> <strong>Alcohol</strong> Dependence.<br />
New York: Oxford University, Inc.<br />
29. Klein, J.D., Brown, J.D., Childers, K.W., Oliveri,<br />
J., Porter, C., <strong>and</strong> Dykers, C. 1993. Adolescents’<br />
risky behavior <strong>and</strong> mass media use.<br />
Pediatrics, 92: 24–31.<br />
30. Kuhn, C., Swartzwelder, S., <strong>and</strong> Wilson, W.<br />
1998. <strong>Alcohol</strong>. In Buzzed: The Straight Facts<br />
about the Most Used <strong>and</strong> Abused Drugs from<br />
<strong>Alcohol</strong> to Ecstasy (pp. 29–54). New York:<br />
W.H. Norton.<br />
31. Little, P.J., Kuhn, C.M., Wilson, W.A., <strong>and</strong><br />
Swartzwelder, H.S. 1996. Differential effects<br />
of ethanol in adolescent <strong>and</strong> adult rats. <strong>Alcohol</strong>ism:<br />
Clinical <strong>and</strong> Experimental Research,<br />
20: 1336–1351.<br />
32. Long, J.C., Knowler, W.C., Hanson, R.L.,<br />
Robin, R.W., Urbanek, M., Moore, E., Bennett,<br />
P.H., <strong>and</strong> Goldman, D. 1998. Evidence for<br />
genetic linkage to alcohol dependence on chromosomes<br />
4 <strong>and</strong> 11 from an autosome-wide<br />
scan in an American Indian population. American<br />
Journal of Medical Genetics, 81: 216–221.<br />
54
33. Loucks-Horsley, S., Hewson, P., Love, N., <strong>and</strong><br />
Stiles, K. 1998. Designing Professional Development<br />
for Teachers of Science <strong>and</strong> Mathematics.<br />
Thous<strong>and</strong> Oaks, CA: Corwin Press.<br />
34. Martin, C.S., Langenbucher, J.W., Kaczynski,<br />
N.A., <strong>and</strong> Chung, T. 1996. Staging in the<br />
onset of DSM-IV alcohol symptoms in adolescents:<br />
Survival/hazard analyses. Journal of<br />
Studies on <strong>Alcohol</strong>, 57: 549–558.<br />
35. National Association for Children of <strong>Alcohol</strong>ics.<br />
1998. Children of alcoholics: Important<br />
facts. Rockville, MD: NACA.<br />
36. National Association for Children of <strong>Alcohol</strong>ics.<br />
1999. Children of alcoholics: Important<br />
facts. Rockville, MD: NACA.<br />
37. National Association for Children of <strong>Alcohol</strong>ics.<br />
2001. Children of alcoholics: A kit for<br />
educators. Rockville, MD: NACA.<br />
38. National Highway Traffic Safety Administration.<br />
1994. Computing a BAC estimate. Washington,<br />
DC: U.S. Department of<br />
Transportation.<br />
39. National Highway Traffic Safety Administration.<br />
1997. <strong>Alcohol</strong>: Traffic safety facts. Washington,<br />
DC: U.S. Department of<br />
Transportation.<br />
40. National Institute on <strong>Alcohol</strong> Abuse <strong>and</strong><br />
<strong>Alcohol</strong>ism. 1995. <strong>Alcohol</strong> Alert No. 29: College<br />
students <strong>and</strong> drinking. Bethesda, MD:<br />
National Institute on <strong>Alcohol</strong> Abuse <strong>and</strong><br />
<strong>Alcohol</strong>ism.<br />
41. National Institute on <strong>Alcohol</strong> Abuse <strong>and</strong><br />
<strong>Alcohol</strong>ism. 1996. <strong>Alcohol</strong>ism: Getting the<br />
facts. Bethesda, MD: National Institute on<br />
<strong>Alcohol</strong> Abuse <strong>and</strong> <strong>Alcohol</strong>ism.<br />
42. National Institute on <strong>Alcohol</strong> Abuse <strong>and</strong><br />
<strong>Alcohol</strong>ism. 1996. <strong>Alcohol</strong> Alert No. 31:<br />
Drinking <strong>and</strong> driving factors. Bethesda, MD:<br />
National Institute on <strong>Alcohol</strong> Abuse <strong>and</strong><br />
<strong>Alcohol</strong>ism.<br />
43. National Institute on <strong>Alcohol</strong> Abuse <strong>and</strong><br />
<strong>Alcohol</strong>ism. 1997. <strong>Alcohol</strong> Alert No. 37:<br />
Youth drinking: risk factors <strong>and</strong> consequences.<br />
Bethesda, MD: National Institute on <strong>Alcohol</strong><br />
Abuse <strong>and</strong> <strong>Alcohol</strong>ism.<br />
44. National Institute on <strong>Alcohol</strong> Abuse <strong>and</strong><br />
<strong>Alcohol</strong>ism. 1999. <strong>Alcohol</strong> Alert No. 45:<br />
<strong>Alcohol</strong> <strong>and</strong> coronary heart disease. Bethesda,<br />
MD: National Institute on <strong>Alcohol</strong> Abuse <strong>and</strong><br />
<strong>Alcohol</strong>ism.<br />
45. National Institute on <strong>Alcohol</strong> Abuse <strong>and</strong><br />
<strong>Alcohol</strong>ism. 1999. <strong>Alcohol</strong> Alert No. 46: Are<br />
women more vulnerable to alcohol’s effects?<br />
Bethesda, MD: National Institute on <strong>Alcohol</strong><br />
Abuse <strong>and</strong> <strong>Alcohol</strong>ism.<br />
46. National Institute on <strong>Alcohol</strong> Abuse <strong>and</strong><br />
<strong>Alcohol</strong>ism. 2000. Make a difference: talk to<br />
your child about alcohol. NIH Publication<br />
No. 4314. Bethesda, MD: National Institute<br />
on <strong>Alcohol</strong> Abuse <strong>and</strong> <strong>Alcohol</strong>ism.<br />
47. National Institute on Drug Abuse <strong>and</strong> the<br />
National Institute on <strong>Alcohol</strong> Abuse <strong>and</strong><br />
<strong>Alcohol</strong>ism. 1998. The economic cost of alcohol<br />
<strong>and</strong> drug abuse in the United States 1992.<br />
Bethesda, MD: National Institute on <strong>Alcohol</strong><br />
Abuse <strong>and</strong> <strong>Alcohol</strong>ism.<br />
48. Noll, R.B., Zucker, R.A., <strong>and</strong> Greenberg, G.S.<br />
1990. Identification of alcohol by smell<br />
among preschoolers: evidence for early<br />
socialization about drugs occurring at home.<br />
Child Development, 61: 1520–1527.<br />
49. Prentice, D.A., <strong>and</strong> Miller, D.T. 1993. Pluralistic<br />
ignorance <strong>and</strong> alcohol use on campus:<br />
some consequences of misperceiving the<br />
social norm. Journal of Personality <strong>and</strong> Social<br />
Psychology, 64: 243–256.<br />
50. Reich, T., Edenberg, H.J., Goate, A., Williams,<br />
J.T., Rice, J.P., Van Eerdewegh, P., et al. 1998.<br />
Genome-wide search for genes affecting the<br />
risk for alcohol dependence. American Journal<br />
of Medical Genetics, 81: 207–215.<br />
51. Segal, B., <strong>and</strong> Duffy, L.K. 1999. Biobehavioral<br />
effects of psychoactive drugs. In R.J.M.<br />
Niesink, R.M.A. Jaspers, L.M.W. Kornet,<br />
<strong>and</strong> J.M. van Ree, Eds. Drugs of Abuse <strong>and</strong><br />
55<br />
References
<strong>Underst<strong>and</strong>ing</strong> <strong>Alcohol</strong>: <strong>Investigations</strong> <strong>into</strong> <strong>Biology</strong> <strong>and</strong> <strong>Behavior</strong><br />
Addiction: Neurobehavioral Toxicology<br />
(pp. 24–64). Boca Raton, FL: CRC Press.<br />
52. Shope, J.T., Molnar, L.J., Elliot, M.R., <strong>and</strong><br />
Waller, P.F. 2001. Graduated driver licensing<br />
in Michigan: Early impact on motor vehicle<br />
crashes among 16 year-old drivers. Journal of<br />
the American Medical Association, 286:<br />
1593–1598.<br />
53. Strunin, L., <strong>and</strong> Hingson, R. 1992. <strong>Alcohol</strong>,<br />
drugs, <strong>and</strong> adolescent behavior. International<br />
Journal of Addictions, 27: 129–146.<br />
54. Tinsley, J.A., Finlayson, R.E., <strong>and</strong> Morse,<br />
R.M. 1998. Developments in the treatment of<br />
alcoholism. Mayo Clinic Proceedings, 73:<br />
857–863.<br />
55. U.S. Department of Health <strong>and</strong> Human Services.<br />
1997. Ninth Special Report to the U.S.<br />
Congress on <strong>Alcohol</strong> <strong>and</strong> Health. Bethesda,<br />
MD: National Institute on <strong>Alcohol</strong> Abuse <strong>and</strong><br />
<strong>Alcohol</strong>ism.<br />
56. U.S. Department of Health <strong>and</strong> Human Services.<br />
2000. Tenth Special Report to the U.S.<br />
Congress on <strong>Alcohol</strong> <strong>and</strong> Health. Bethesda,<br />
MD: National Institute on <strong>Alcohol</strong> Abuse <strong>and</strong><br />
<strong>Alcohol</strong>ism.<br />
57. Wechsler, H., Isaac, N.E., Grodstein, F., <strong>and</strong><br />
Sellers, D.E. 1994. Continuation <strong>and</strong> initia-<br />
tion of alcohol use from the first to second<br />
year of college. Journal of Studies on <strong>Alcohol</strong>,<br />
55: 41–45.<br />
58. Weinrieb, R.M., <strong>and</strong> O’Brien, C.P. 1997. Naltrexone<br />
in the treatment of alcoholism.<br />
Annual Review of Medicine, 48: 477–487.<br />
59. White, A.M., Ghia, A.J., Levin, E.D., <strong>and</strong><br />
Swartzwelder, H.S. 2000. Binge pattern<br />
ethanol exposure in adolescent <strong>and</strong> adult<br />
rats: Differential impact on subsequent<br />
responsiveness to ethanol. <strong>Alcohol</strong>ism: Clinical<br />
<strong>and</strong> Experimental Research, 24:<br />
1251–1256.<br />
60. Windle, M. 1992. <strong>Alcohol</strong> use, suicidal<br />
behavior, <strong>and</strong> risky activities among adolescents.<br />
Journal of Research on Adolescence, 2:<br />
317–330.<br />
61. Windle, M. 1994. Substance use, risky<br />
behaviors, <strong>and</strong> victimization among a U.S.<br />
national adolescent sample. Addiction, 89:<br />
175–182.<br />
62. Zador, P., Krawchuk, S.A., <strong>and</strong> Voas, R.B.<br />
2000. <strong>Alcohol</strong>-related relative risk of driver<br />
fatalities <strong>and</strong> driver involvement in fatal<br />
crashes in relation to driver age <strong>and</strong> gender:<br />
An update using 1996 data. Journal of Studies<br />
on <strong>Alcohol</strong>, 61: 387-395.<br />
56
<strong>Alcohol</strong>: Separating<br />
Fact from Fiction<br />
Lesson 1<br />
Engage<br />
Figure 1.1.<br />
When it comes<br />
to alcohol, it’s<br />
not always easy<br />
to separate fact<br />
from fiction.<br />
Overview<br />
For teachers with Web access, the first lesson of the module begins by having<br />
students watch two short video clips of mouse activity. Students then<br />
record their observations of the behavior of the mice. Students come to<br />
realize that the differences in behavior are due to the effects of alcohol<br />
<strong>into</strong>xication. Students are then confronted with a series of statements about<br />
alcohol <strong>and</strong> asked whether they agree or disagree with each statement. This<br />
activity helps you assess students’ prior knowledge of the topic while helping<br />
students clarify their own underst<strong>and</strong>ing.<br />
At a Glance<br />
Major Concepts<br />
Students receive mixed messages about alcohol consumption. On the one<br />
h<strong>and</strong>, they observe that society considers drinking alcohol socially acceptable.<br />
Movies, media, <strong>and</strong> advertisements often portray the use of alcohol as<br />
part of a desirable lifestyle. Simultaneously, however, students are warned<br />
that alcohol is dangerous <strong>and</strong> should be avoided. This situation leaves<br />
many adolescents with incomplete underst<strong>and</strong>ing <strong>and</strong> misconceptions<br />
about alcohol use <strong>and</strong> its effects.<br />
Objectives<br />
During this lesson, students will<br />
• obtain a clearer underst<strong>and</strong>ing of their knowledge about alcohol;<br />
• recognize that their attitudes, beliefs, <strong>and</strong> knowledge about alcohol<br />
may be different from those of their peers;<br />
57
<strong>Underst<strong>and</strong>ing</strong> <strong>Alcohol</strong>: <strong>Investigations</strong> <strong>into</strong> <strong>Biology</strong> <strong>and</strong> <strong>Behavior</strong><br />
• identify areas where their underst<strong>and</strong>ing of alcohol is incomplete or<br />
even wrong; <strong>and</strong><br />
• gain experience with scientific methods, such as observation <strong>and</strong><br />
inference.<br />
Teacher Background<br />
Consult the following sections in Information about <strong>Alcohol</strong>:<br />
1 Introduction (pages 23–24)<br />
2 <strong>Alcohol</strong> Use, Abuse, <strong>and</strong> <strong>Alcohol</strong>ism: Definitions (pages 24–25)<br />
3 Misconceptions about <strong>Alcohol</strong> Use, Abuse, <strong>and</strong> <strong>Alcohol</strong>ism (pages 25–27)<br />
7 <strong>Alcohol</strong>: <strong>Behavior</strong>al Effects (pages 37–39)<br />
In Advance<br />
Web-Based Activities<br />
Activity<br />
1<br />
2<br />
Web Version?<br />
Yes<br />
No<br />
Photocopies<br />
Activity 1<br />
Activity 2<br />
no photocopies needed<br />
Master 1.1, <strong>Alcohol</strong>: Is This Right? (Make 1 copy for each<br />
student <strong>and</strong> prepare an overhead transparency.)<br />
Materials<br />
Activity 1<br />
Activity 2<br />
computers with an Internet connection a<br />
no materials needed (except photocopies)<br />
a Ideally, videos are presented to the class using a single computer whose monitor is projected<br />
to the class. Alternatively, students view the videos on computers individually or in<br />
small groups.<br />
Preparation<br />
Check with your computer lab personnel to determine which type of Internet<br />
connection you will be using. For Activity 1, you need to know<br />
whether you will use a modem, an ISDN line, or a T1 connection.<br />
58
Procedure<br />
Activity 1: What’s Up with This Mouse?<br />
Teacher note<br />
This activity is for classes with access to the Internet. The activity is<br />
designed to be conducted by students before they are told they will be participating<br />
in a module about alcohol. Students are asked to carefully<br />
observe the behavior of two mice <strong>and</strong> record their observations. One<br />
mouse has been given a dose of alcohol sufficient to render it <strong>into</strong>xicated,<br />
while the other mouse has not been given alcohol. The students’ observations<br />
are discussed in this activity <strong>and</strong> referred to again in Lesson 3,<br />
Responding to <strong>Alcohol</strong>: What’s Important?<br />
It is not essential that the students are unaware that they will be participating<br />
in a module about alcohol for this activity to be useful. During field<br />
testing of this module, even when students knew that one mouse had been<br />
given an <strong>into</strong>xicating dose of alcohol, they could not always identify which<br />
mouse was <strong>into</strong>xicated. Regardless of whether the class knows that alcohol<br />
is the topic under investigation, the discussion of which aspects of mouse<br />
behavior are caused by alcohol <strong>and</strong> their relevance to humans who consume<br />
alcohol is a useful one.<br />
1. Log onto the Web site<br />
http://science.education.nih.gov/supplement/alcohol/student <strong>and</strong> click<br />
on “Lesson 1—<strong>Alcohol</strong>: Separating Fact from Fiction.” Select the<br />
type of Internet connection you are using (56k modem, ISDN, or<br />
T1) <strong>and</strong> click to play a mouse video.<br />
2. Explain to the class that they will view two short video clips of<br />
mice. Ask the students to observe the behavior of each mouse <strong>and</strong><br />
record their observations on a sheet of paper. If some students are<br />
aware that the module is about alcohol, do not reveal which video<br />
clip shows the mouse that has been given alcohol.<br />
3. Discuss the difference between an observation <strong>and</strong> an inference.<br />
Ask students:<br />
• What is an observation?<br />
Answers may vary. An observation relates to what a person can actually<br />
see. It involves the noting <strong>and</strong> recording of facts.<br />
• What is an inference?<br />
Figure 1.2. <strong>Alcohol</strong> has<br />
many effects on mouse<br />
behavior.<br />
59<br />
Student Lesson 1
<strong>Underst<strong>and</strong>ing</strong> <strong>Alcohol</strong>: <strong>Investigations</strong> <strong>into</strong> <strong>Biology</strong> <strong>and</strong> <strong>Behavior</strong><br />
An inference is a conclusion that follows logically from available<br />
evidence but is not a direct result of that evidence. This means that<br />
people may make different inferences from the same evidence.<br />
• If I say that the mouse is white, is that an observation or an<br />
inference?<br />
This statement is an observation because you can see that the mouse<br />
is white.<br />
• If I say that the mouse is happy, is that an observation or an<br />
inference?<br />
This statement is an inference because the mouse cannot tell you<br />
that it is happy, <strong>and</strong> it cannot display a behavior that indicates only<br />
happiness.<br />
• If I say that the mouse is drinking water, is that an observation or<br />
an inference?<br />
If you see a mouse drinking water, then the statement is an observation.<br />
You can infer that, because the mouse is drinking water, it is<br />
thirsty.<br />
• Why is it important for scientists to distinguish between observations<br />
<strong>and</strong> inferences?<br />
Content St<strong>and</strong>ard A:<br />
Develop descriptions,<br />
explanations, predictions,<br />
<strong>and</strong> models<br />
using evidence.<br />
Observations provide the facts that all scientists can agree on, while<br />
inferences are subject to individual interpretation.<br />
4. Ask students to take out a piece of paper <strong>and</strong> label it as follows:<br />
Observations<br />
Mouse 1<br />
Inferences<br />
Observations<br />
Mouse 2<br />
Inferences<br />
60
5. Click on “mouse 1” to play the first video clip. Ask the class to<br />
observe carefully <strong>and</strong> record the behavior of the mouse.<br />
Do not mention anything about the mouse or why you are asking<br />
them to observe it. This first clip shows the mouse that has not been<br />
given alcohol being placed on the center of a table. The mouse is<br />
nervous <strong>and</strong> tentatively explores its environment. It cautiously<br />
moves short distances in a circular pattern around the spot upon<br />
which it was placed. It occasionally rears up <strong>and</strong> sniffs the air. Replay<br />
the video if necessary.<br />
6. Invite students to share their observations <strong>and</strong> inferences about the<br />
behavior of the mouse. Ask students if they agree or disagree with<br />
the statements.<br />
Students report various descriptions of the mouse’s behavior. Some<br />
of the words <strong>and</strong> phrases provided by the field-test students are<br />
listed in the following table.<br />
Mouse 1<br />
Observations<br />
sniffing<br />
moving slowly<br />
moving in circles<br />
moving head up <strong>and</strong> down<br />
rising on back legs<br />
Inferences<br />
confused<br />
hungry<br />
tired<br />
afraid<br />
drunk<br />
7. Click on “mouse 2” to play the second video clip. Again, ask the<br />
class to observe carefully <strong>and</strong> record the behavior of the mouse. As<br />
before, do not mention anything about the mouse.<br />
This second clip features the mouse that is <strong>into</strong>xicated with alcohol.<br />
It has lost its sense of inhibition <strong>and</strong> immediately runs off the edge of<br />
the table. Each time the mouse is repositioned <strong>and</strong> released, it again<br />
recklessly runs off the table’s edge. Replay the video if necessary.<br />
8. Invite students to share their observations <strong>and</strong> inferences about the<br />
behavior of the mouse. Ask students if they agree or disagree with<br />
the statements.<br />
Once again, student descriptions of the mouse’s behavior will vary.<br />
Some of the words <strong>and</strong> phrases provided by the field-test students<br />
are listed in the following table.<br />
61<br />
Student Lesson 1
<strong>Underst<strong>and</strong>ing</strong> <strong>Alcohol</strong>: <strong>Investigations</strong> <strong>into</strong> <strong>Biology</strong> <strong>and</strong> <strong>Behavior</strong><br />
Mouse 2<br />
Observations<br />
running<br />
moves in a straight line<br />
doesn’t sniff<br />
falls off table<br />
stays low on table<br />
Inferences<br />
scared<br />
alert<br />
not hungry<br />
not cautious<br />
drunk<br />
9. Point out that the behavior of the second mouse was clearly different<br />
from the first mouse. Ask students to suggest reasons that<br />
could account for the differences in behavior.<br />
Their answers will vary but may include sickness (either hereditary<br />
or infectious); exposure to drugs, alcohol, or chemicals; <strong>and</strong> age.<br />
Accept all responses that could reasonably account for the differences<br />
in behavior. List the responses on the board.<br />
Content St<strong>and</strong>ard A:<br />
Recognize <strong>and</strong> analyze<br />
alternative explanations<br />
<strong>and</strong> predictions.<br />
10. Explain that, in fact, the second mouse was <strong>into</strong>xicated with alcohol.<br />
Ask the class how the behavior of the <strong>into</strong>xicated mouse is<br />
similar to that of <strong>into</strong>xicated humans.<br />
Answers will vary. Make sure that students appreciate that alcohol<br />
causes the mouse to lose its normal cautious nature in a manner<br />
similar to that in which humans lose their inhibitions after drinking<br />
alcoholic beverages.<br />
Activity 2: <strong>Alcohol</strong>—Separating Fact from Fiction<br />
Assessment:<br />
Listening to students’<br />
explanations gives you<br />
another opportunity to<br />
assess whether they<br />
underst<strong>and</strong> the difference<br />
between observations<br />
<strong>and</strong> inferences.<br />
Teacher note<br />
The purpose of this activity is to assess students’ prior knowledge about<br />
alcohol. Explain to the class that the h<strong>and</strong>out they are about to receive is<br />
not a test or a quiz <strong>and</strong> it will not be graded. At the conclusion of the<br />
entire module (all six lessons), the class will receive another copy of the<br />
h<strong>and</strong>out <strong>and</strong> again will have an opportunity to react to the statements. This<br />
enables you <strong>and</strong> the class to see how attitudes <strong>and</strong> beliefs change as a consequence<br />
of the module.<br />
1. Explain to the class that they will now participate in a discussion<br />
to see what they know (or think they know) about alcohol.<br />
2. Pass out a copy of Master 1.1, <strong>Alcohol</strong>: Is This Right?, to each<br />
student.<br />
62
3. Instruct students to write their names on the h<strong>and</strong>out. Ask them<br />
to circle whether they agree or disagree with each of the numbered<br />
statements.<br />
Students may ask you to clarify some statements. It is not necessary<br />
to define terms at this point. The idea is to provoke students <strong>into</strong><br />
assessing what they currently know or think they know about alcohol.<br />
Through the lessons of this module, students will become more<br />
familiar with terms associated with alcohol. Remind students that<br />
this is not a test.<br />
4. After students have had an opportunity to respond to each of the<br />
statements, collect their h<strong>and</strong>outs <strong>and</strong> save them until the conclusion<br />
of the module.<br />
5. Show the class a transparency of Master 1.1, <strong>Alcohol</strong>: Is this Right?<br />
Read each statement aloud <strong>and</strong> ask them to raise their h<strong>and</strong>s if<br />
they agree with it.<br />
At this time, do not judge the students’ responses or provide them<br />
with additional information.<br />
6. Invite students to share their views about each statement with the<br />
class. Allow several students to respond to each statement.<br />
As students discuss their beliefs about alcohol, they may bring up<br />
issues related to their family life. Such circumstances require sensitivity<br />
on your part. If other students make judgmental or inappropriate<br />
comments, be sure to reinforce the idea of being respectful of<br />
others’ experiences. If necessary, talk to affected students individually<br />
to determine whether they have issues that might require professional<br />
help. Also, refer to How Can Controversial Topics Be H<strong>and</strong>led in<br />
the Classroom?, on page 14.<br />
Assessment:<br />
The discussion of students’<br />
responses to the<br />
statements on Master<br />
1.1 provides you with<br />
an assessment of their<br />
current underst<strong>and</strong>ing<br />
about alcohol.<br />
7. Ask students how they learned about alcohol. Use the following<br />
questions to guide the discussion.<br />
• Where did you get your information about alcohol?<br />
Students will list a variety of sources that may include parents, siblings,<br />
friends, television, movies, magazines, songs, <strong>and</strong> observations<br />
of people.<br />
• How do you know if your information is accurate?<br />
Content St<strong>and</strong>ard A:<br />
Different kinds of<br />
questions suggest different<br />
kinds of scientific<br />
investigations.<br />
63<br />
Student Lesson 1
<strong>Underst<strong>and</strong>ing</strong> <strong>Alcohol</strong>: <strong>Investigations</strong> <strong>into</strong> <strong>Biology</strong> <strong>and</strong> <strong>Behavior</strong><br />
Figure 1.3. Students learn about alcohol from different sources including teachers, parents, <strong>and</strong> friends.<br />
Responses will vary. Information from another person depends on<br />
the level of trust they have with that person. Students may regard<br />
information from doctors or news reports to be more accurate than<br />
that from movies or friends.<br />
• How would a scientist learn about alcohol?<br />
Students may respond that scientists conduct research, sometimes<br />
using animal models, to learn about alcohol. This may involve making<br />
hypotheses, recording observations, gathering data, making inferences,<br />
<strong>and</strong> reaching conclusions based upon evidence. Scientists also<br />
review the work of other scientists who have investigated the topic.<br />
This is an opportunity to reinforce the idea that gathering <strong>and</strong> analyzing<br />
data are critical to scientific investigations.<br />
8. Inform students that they will think about these statements again<br />
at the end of the module.<br />
64
Lesson 1 Organizer<br />
Activity 1: What’s Up with This Mouse?<br />
What the Teacher Does<br />
Procedure Reference<br />
Log onto Web site <strong>and</strong> click on “Lesson 1—<strong>Alcohol</strong>: Separating<br />
Fact from Fiction.” Select the type of Internet connection<br />
you are using. Select a mouse video clip.<br />
Page 59<br />
Step 1<br />
Instruct the class to pay close attention as you play each of<br />
the mouse videos <strong>and</strong> to record their observations of each<br />
mouse’s behavior.<br />
Page 59<br />
Step 2<br />
Discuss the difference between an observation <strong>and</strong> an<br />
inference.<br />
Pages 59–60<br />
Step 3<br />
Replay the video clip of mouse 1 <strong>and</strong> invite the class to<br />
share their observations <strong>and</strong> inferences.<br />
Pages 60–61<br />
Steps 4–6<br />
Replay the video clip of mouse 2 <strong>and</strong> invite the class to<br />
share their observations <strong>and</strong> inferences.<br />
Pages 61–62<br />
Steps 7 <strong>and</strong> 8<br />
Ask the class to account for differences in behavior between<br />
the two mice.<br />
Page 62<br />
Step 9<br />
Discuss how the behavior of the <strong>into</strong>xicated mouse relates<br />
to that of <strong>into</strong>xicated humans.<br />
Page 62<br />
Step 10<br />
= Involves using the Internet.<br />
= Involves copying a master.<br />
= Involves using a transparency.<br />
65<br />
Student Lesson 1
<strong>Underst<strong>and</strong>ing</strong> <strong>Alcohol</strong>: <strong>Investigations</strong> <strong>into</strong> <strong>Biology</strong> <strong>and</strong> <strong>Behavior</strong><br />
Activity 2: <strong>Alcohol</strong>—Separating Fact from Fiction<br />
What the Teacher Does<br />
Procedure Reference<br />
Explain to the class that they will discuss what they know<br />
(or think they know) about alcohol.<br />
Page 62<br />
Step 1<br />
Have the class indicate whether they agree or disagree<br />
with a series of statements about alcohol on Master 1.1,<br />
<strong>Alcohol</strong>: Is This Right?<br />
Pages 62–63<br />
Steps 2 <strong>and</strong> 3<br />
Collect their responses <strong>and</strong> save them until the end of the<br />
module.<br />
Page 63<br />
Step 4<br />
Using a transparency of Master 1.1, read each statement <strong>and</strong><br />
ask students to indicate whether or not they agree with it.<br />
• Allow several students to share their views about each<br />
statement.<br />
Page 63<br />
Steps 5 <strong>and</strong> 6<br />
Discuss with the class how they learned about alcohol.<br />
• Where did they get their information?<br />
• How do they know if the information is accurate?<br />
• How would a scientist learn about alcohol?<br />
Pages 63–64<br />
Step 7<br />
Explain that you will return to these statements about<br />
alcohol at the conclusion of the module.<br />
Page 64<br />
Step 8<br />
66
<strong>Alcohol</strong>: Is This Right?<br />
Name ______________________________<br />
Date ______________________<br />
Please circle whether you agree or disagree with each statement.<br />
1. <strong>Alcohol</strong> is a stimulant.<br />
Agree<br />
2. Caffeine will sober you up.<br />
Agree<br />
Disagree<br />
Disagree<br />
3. Food will keep you from becoming <strong>into</strong>xicated.<br />
Agree<br />
Disagree<br />
4. Drinking beer is safer than drinking wine or hard liquor such as vodka or whiskey.<br />
Agree<br />
Disagree<br />
5. <strong>Alcohol</strong>-related car crashes are all caused by drunk drivers.<br />
Agree<br />
Disagree<br />
6. <strong>Alcohol</strong>ism is a disease.<br />
Agree<br />
Disagree<br />
7. <strong>Alcohol</strong> abuse <strong>and</strong> alcoholism affect only the abuser.<br />
Agree<br />
Disagree<br />
8. <strong>Alcohol</strong> abuse or alcoholism will never be my problem.<br />
Agree<br />
Disagree<br />
9. Nothing can be done about alcohol abuse or alcoholism.<br />
Agree<br />
Disagree<br />
10. It is a good idea to drink alcohol to prevent heart disease.<br />
Agree<br />
Disagree<br />
11. Drinking a large amount of alcohol occasionally is less harmful than drinking a<br />
smaller amount every day.<br />
Agree<br />
Disagree<br />
12. Drinking alcohol makes you feel more confident.<br />
Agree<br />
Disagree<br />
Master 1.1
A Drink Is a Drink, but<br />
People Are Different<br />
Lesson 2<br />
Explore<br />
Figure 2.1. Different people<br />
respond differently to drinking<br />
alcohol.<br />
Overview<br />
Students investigate what is meant by a drink in reference to an alcoholic<br />
beverage. Demonstrations using food coloring <strong>and</strong> water illustrate that various<br />
types of alcoholic drinks contain the same amount of alcohol although<br />
the total volume of liquid is different. Simulated alcoholic drinks are then<br />
diluted <strong>into</strong> a mixture of oil <strong>and</strong> water that represents the fat- <strong>and</strong> watercontaining<br />
portions of the body. This demonstrates how alcohol is distributed<br />
within the body.<br />
At a Glance<br />
Major Concepts<br />
The concentration of alcohol in beer is lower than that in wine or hard<br />
liquor. However, the total amount of alcohol in a typical serving of beer<br />
(12 ounces), wine (5 ounces), <strong>and</strong> hard liquor (1.5 ounces) is the same.<br />
Because alcohol is miscible, or able to mix, with water, it distributes<br />
throughout the water-containing portions of the body. The brain has a high<br />
water content, <strong>and</strong> alcohol exerts many of its effects there.<br />
69
<strong>Underst<strong>and</strong>ing</strong> <strong>Alcohol</strong>: <strong>Investigations</strong> <strong>into</strong> <strong>Biology</strong> <strong>and</strong> <strong>Behavior</strong><br />
Objectives<br />
After completing this lesson, students will<br />
• be able to explain that concentration is a measure of the amount of a<br />
substance in comparison with the total amount of the solution;<br />
• underst<strong>and</strong> that various alcoholic drinks contain the same amount of<br />
alcohol even though the serving size may be different;<br />
• explain that alcohol is miscible with water but not with fat;<br />
• be able to describe that alcohol distributes throughout the water-containing<br />
portions of the body;<br />
• recognize that body size <strong>and</strong> type influence an individual’s response<br />
to alcohol; <strong>and</strong><br />
• recognize the brain as an important site of alcohol’s actions.<br />
Teacher Background<br />
Consult the following sections in Information about <strong>Alcohol</strong>:<br />
5 <strong>Alcohol</strong>: Pharmacokinetics (pages 28–31)<br />
6 <strong>Alcohol</strong>: Biological Effects (pages 31–37)<br />
In Advance<br />
Web-Based Activities<br />
Activity<br />
1<br />
2<br />
Web Version?<br />
No<br />
No<br />
Photocopies<br />
Activity 1<br />
Activity 2<br />
Master 2.1, What Is a Drink? (Make one copy per student<br />
<strong>and</strong> prepare a transparency.)<br />
Master 2.2, Tracing <strong>Alcohol</strong>’s Path through the Body (Prepare<br />
a transparency.)<br />
Materials<br />
Activity 1<br />
For the class:<br />
4 identical 1-gallon containers, such as clear plastic milk<br />
bottles a, b<br />
1 measuring cup, marked in ounces<br />
1 clear shot glass, or other clear cup that holds 1.5 ounces<br />
1 clear wine glass, or other clear cup that holds 5 ounces<br />
1 clear beer mug, or other clear cup that holds 12 ounces<br />
water<br />
70
Activity 1<br />
Activity 2<br />
red food coloring (0.3-ounce bottle) c<br />
1 stirring rod<br />
1 piece of white poster board to use as a backdrop for the<br />
demonstration<br />
For the class:<br />
2 clear containers (drinking glasses) that hold at least<br />
8 ounces of liquid d, e<br />
2 containers that hold at least 2 ounces of liquid<br />
2 ounces of rubbing alcohol (isopropyl alcohol)<br />
water<br />
mineral oil (8 ounces) f<br />
red food coloring (0.3-ounce bottle) c<br />
a Large beakers (2,000 mL) or clear, 2-liter soda bottles may be good choices if larger containers<br />
are not available.<br />
b Ideally, all of the containers will be transparent to help the class see the color intensities of<br />
the simulated alcoholic beverages.<br />
c Other colors of food coloring may be used. Be sure to select a color that will show up well<br />
in the demonstration. Yellow may not be a good choice.<br />
d The 8-ounce containers should be tall <strong>and</strong> slender (such as a drinking glass) as opposed to<br />
short <strong>and</strong> stout. This helps students visualize the water <strong>and</strong> oil phases.<br />
e If you are doing this demonstration in front of a large class, you may wish to adapt it for<br />
your situation. If you use the volumes of water, mineral oil, <strong>and</strong> food-coloring solution<br />
listed, you may wish to walk around the room with the containers so that students can see<br />
them well. Alternatively, you may scale up the volumes of each liquid <strong>and</strong> use larger containers.<br />
Visually, this may be more effective, but it necessitates additional materials.<br />
f If you are doing the demonstration for multiple classes, you can separate the mineral oil<br />
from the water <strong>and</strong> reuse it, but that requires additional preparation time.<br />
Preparation<br />
ACTIVITY 1<br />
Fill four 1-gallon containers about three-quarters full of water.<br />
Prepare diluted red-food-coloring solution by adding 1 teaspoon of the<br />
food coloring to one of the gallon containers that has been filled about<br />
three-quarters full with water. Mix.<br />
Prepare the simulated shot of hard liquor by adding 1.5 ounces of<br />
the diluted red-food-coloring solution to the shot glass or small cup<br />
(1.5 ounces total).<br />
Prepare the simulated glass of wine by adding 1.5 ounces of the diluted<br />
red-food-coloring solution to the wine glass or a medium cup containing<br />
3.5 ounces of water (5 ounces total).<br />
Prepare the simulated mug of beer by adding 1.5 ounces of the diluted redfood-coloring<br />
solution to the beer mug or large cup containing 10.5 ounces<br />
of water (12 ounces total).<br />
71<br />
Student Lesson 2
<strong>Underst<strong>and</strong>ing</strong> <strong>Alcohol</strong>: <strong>Investigations</strong> <strong>into</strong> <strong>Biology</strong> <strong>and</strong> <strong>Behavior</strong><br />
Teacher note<br />
Practice this demonstration before attempting it in front of a class to ensure<br />
that the differences in color are obvious. Notice that each of the three simulated<br />
beverages contains the same amount of food coloring (“alcohol”). The<br />
“shot” should be noticeably darker than the “wine,” which should be<br />
noticeably darker than the “beer.” If the three drinks do not have noticeably<br />
different color intensities, then you may have to change the amount of food<br />
coloring that you add when you make the diluted food-coloring solution.<br />
ACTIVITY 2<br />
Teacher note<br />
To reduce the amount of materials needed, this activity is described as a<br />
teacher demonstration. You can perform the dilutions yourself or have student<br />
volunteers assist. If you prefer, you can divide the class <strong>into</strong> small<br />
groups <strong>and</strong> have them each perform the activity.<br />
Place 2 ounces of rubbing alcohol <strong>into</strong> a container <strong>and</strong> add three drops of<br />
red food coloring. Mix to give the solution a uniform color. Divide the red<br />
rubbing-alcohol solution equally between the two smaller containers.<br />
To simulate different body types, pour 6 ounces of water <strong>into</strong> one drinking<br />
glass (or other transparent container), <strong>and</strong> pour 4 ounces of water <strong>into</strong> the<br />
other drinking glass.<br />
Slowly <strong>and</strong> carefully pour 2 ounces of mineral oil down the side of the<br />
drinking glass that contains 6 ounces of water. Being less dense than<br />
water, the mineral oil will form a layer on top of the water.<br />
Slowly <strong>and</strong> carefully pour 4 ounces of mineral oil down the side of the<br />
drinking glass that contains 4 ounces of water.<br />
Teacher note<br />
Save some diluted food coloring <strong>and</strong> the beer mug (or a clear glass) to use<br />
during Lesson 4.<br />
Procedure<br />
Teacher note<br />
You may notice that this lesson uses units of ounces <strong>and</strong> gallons instead of<br />
metric units. This is because alcoholic beverages in the United States are<br />
typically described using ounces <strong>and</strong> this system is more familiar to students.<br />
Activity 1: What Is a Drink?<br />
1. Introduce the activity by asking students to name different kinds of<br />
alcoholic beverages. List the different beverages on the board.<br />
72
Students will name a variety of alcoholic beverages, including specific<br />
varieties of beers, wines, <strong>and</strong> hard liquors.<br />
2. On the board, write the three categories of alcoholic beverages:<br />
beer, wine, <strong>and</strong> hard liquor. Invite students to suggest <strong>into</strong> which<br />
category each beverage should be placed.<br />
Students likely will have heard the term hard liquor, but they may<br />
not underst<strong>and</strong> what it means. At this stage, simply tell students that<br />
it refers to the way the alcoholic beverages are produced.<br />
3. Invite students to consider the differences among the alcoholic<br />
beverages they named. Why can alcoholic beverages be placed in<br />
different categories? Are they all the same in terms of amount of<br />
alcohol? Do they cause different effects?<br />
Allow students to express their views. Some students will have misconceptions<br />
about the different types of alcoholic beverages. For<br />
example, some students will say that the effects of alcohol depend<br />
only on the amount, or total volume, of a drink (of any type) that a<br />
person consumes. Other students will volunteer that hard liquor<br />
contains more alcohol per unit of volume than does beer or wine.<br />
Students will revisit this question after the demonstration.<br />
4. Explain to the class that you are going to conduct a demonstration<br />
to investigate the amount of alcohol in the three different types of<br />
drinks.<br />
5. Place the three simulated alcoholic beverages—the beer, wine, <strong>and</strong><br />
hard liquor—on the table in front of the class. Explain that the liquid<br />
is actually water with red food coloring. The red food coloring<br />
represents the alcohol in each drink. Ask students to share their<br />
observations about the three drinks.<br />
Figure 2.2. All three<br />
of these drinks contain<br />
the same<br />
amount of alcohol.<br />
73<br />
Student Lesson 2
<strong>Underst<strong>and</strong>ing</strong> <strong>Alcohol</strong>: <strong>Investigations</strong> <strong>into</strong> <strong>Biology</strong> <strong>and</strong> <strong>Behavior</strong><br />
Content St<strong>and</strong>ard A:<br />
Think critically <strong>and</strong><br />
logically to make the<br />
relationships between<br />
evidence <strong>and</strong> explanations.<br />
Content St<strong>and</strong>ard B:<br />
A substance has characteristic<br />
properties,<br />
such as density, a<br />
boiling point, <strong>and</strong><br />
solubility, all of which<br />
are independent of the<br />
amount of the sample.<br />
Students will mention that the beverages have different volumes of<br />
liquid, <strong>and</strong> that the red color varies in shade among the different<br />
drinks. The liquid in the shot glass has the deepest red color, <strong>and</strong> the<br />
liquid in the beer glass has the lightest red color. Do not explain at<br />
this point that each drink has the same amount of “alcohol.”<br />
6. Place the three 1-gallon containers, each about three-quarters full<br />
of water, in view of the class. Explain that each container represents<br />
the water in a human body. Point out that the three containers<br />
hold equal amounts of water. Ask students to predict what will<br />
happen if you pour the “drinks” <strong>into</strong> the containers. Will the three<br />
containers look different from each other after you add the different<br />
“drinks” to them, or will they look the same?<br />
7. Pour the simulated shot of hard liquor <strong>into</strong> the first gallon container<br />
<strong>and</strong> mix to allow the food coloring to quickly distribute<br />
throughout the water. Ask the class to observe what is happening.<br />
8. Pour the simulated glass of wine <strong>into</strong> the second gallon container<br />
<strong>and</strong> mix to allow the food coloring to quickly distribute throughout<br />
the water.<br />
9. Pour the simulated mug of beer <strong>into</strong> the third gallon container<br />
<strong>and</strong> mix.<br />
10. Invite students to share their observations of the colors in the three<br />
containers. Do the different containers look the same or do they<br />
look different from each other? Which contains the most alcohol?<br />
Because each glass contains 1.5 ounces of the diluted red-food-coloring<br />
solution, the shade of red in each should be about the same.<br />
(Since the simulated drinks have different volumes, the final volumes<br />
in the gallon containers will be slightly different.) If the gallon<br />
containers are not clear enough for the class to see the colors of the<br />
solutions, then pour equal quantities of the solutions <strong>into</strong> separate<br />
clear beakers or drinking glasses, so that students can accurately<br />
compare the tints of the three solutions.<br />
Before proceeding, make sure that the class underst<strong>and</strong>s that the red<br />
food coloring represents alcohol in the drink <strong>and</strong> that its spread<br />
throughout the water simulates the distribution of alcohol throughout<br />
a person’s bloodstream.<br />
11. Ask the class to consider which container has the most alcohol in<br />
it. Introduce the term concentration to students. Concentration is a<br />
measure of the amount of a substance in comparison to the total<br />
74
Figure 2.3. Each<br />
type of alcoholic<br />
drink produces<br />
the same alcohol<br />
concentration in<br />
the blood.<br />
amount of solution. (In this discussion, we will restrict the definition<br />
of concentration to liquids.) Which container has the highest<br />
concentration of alcohol?<br />
Since the color intensity is an indicator of concentration, students<br />
should report that the containers have equal concentrations of food<br />
coloring (alcohol).<br />
12. Ask students to consider the three types of drinks poured <strong>into</strong> the<br />
containers. If the concentration of food coloring (alcohol) in each<br />
large container is the same, what can they say about the amount of<br />
alcohol that was added to each container?<br />
Students should respond that if the final concentrations are equal,<br />
then the total amount of alcohol added to each container is the same<br />
because the volumes in the containers are about the same.<br />
13. Ask the class which alcoholic beverage, the beer, the wine, or the<br />
hard liquor, has the lowest concentration of alcohol. Which has the<br />
highest?<br />
Without using actual alcohol concentrations, make sure that the<br />
class underst<strong>and</strong>s that beer has the lowest concentration, wine an<br />
intermediate concentration, <strong>and</strong> hard liquor the highest.<br />
14. (Optional) If students have difficulty underst<strong>and</strong>ing the concept of<br />
concentrations in different volumes of liquid, you may wish to<br />
demonstrate the mixing of the simulated alcoholic beverages. Add<br />
1.5 ounces of the diluted red food coloring solution to a beer mug,<br />
a wine glass, <strong>and</strong> a shot glass. Then add water to the beer mug<br />
(10.5 ounces) <strong>and</strong> wine glass (3.5 ounces) to show the typical servings.<br />
These will be identical to the simulated drinks that you used<br />
for the first demonstration.<br />
75<br />
Student Lesson 2
<strong>Underst<strong>and</strong>ing</strong> <strong>Alcohol</strong>: <strong>Investigations</strong> <strong>into</strong> <strong>Biology</strong> <strong>and</strong> <strong>Behavior</strong><br />
Having students see that the different glasses contain the same<br />
amount of “alcohol” even though the final volume of liquid is different<br />
should help eliminate confusion.<br />
Assessment:<br />
Listening to students’<br />
responses to these<br />
questions will help<br />
you assess their<br />
underst<strong>and</strong>ing of<br />
concentration.<br />
Content St<strong>and</strong>ard A:<br />
Use mathematics in all<br />
aspects of scientific<br />
inquiry.<br />
15. Ask the class to think about how the same amount of alcohol<br />
affects different people, for example, a small person <strong>and</strong> a large<br />
person. Guide the discussion with questions like the following:<br />
• Would the concentration of alcohol in the blood of each person<br />
be the same?<br />
• Which person would have a higher concentration of alcohol in<br />
the blood?<br />
• Why does the same amount of alcohol have a greater effect on<br />
a smaller person than a larger one?<br />
<strong>Alcohol</strong> distributes throughout a person’s bloodstream. A smaller person<br />
has a lesser volume of blood compared with a larger one. This<br />
means that a given amount of alcohol will lead to a greater blood<br />
alcohol concentration in the smaller person than the larger one.<br />
16. Pass out a copy of Master 2.1, What Is a Drink?, to each student.<br />
Explain that the table on their h<strong>and</strong>out lists the serving size <strong>and</strong><br />
percentage of alcohol for each type of drink. Instruct students to<br />
calculate the amount of alcohol in each of the three types of alcoholic<br />
beverage <strong>and</strong> to write their answers in the appropriate spaces<br />
on the h<strong>and</strong>out.<br />
17. After students complete Master 2.1, ask them to draw conclusions<br />
about the amount of alcohol in an alcoholic beverage.<br />
Type of drink Volume of serving Concentration of Concentration of Total amount of<br />
(in ounces) alcohol expressed alcohol expressed alchol<br />
as a percent as a percent in (in ounces)<br />
decimal form<br />
Beer 12 5 0.05 0.6<br />
Wine 5 12 0.12 0.6<br />
Hard liquor 1.5 40 0.40 0.6<br />
Answers to questions on Master 2.1, What Is a Drink?, follow:<br />
Students should recognize that typical servings of beer, wine, <strong>and</strong><br />
hard liquor contain about the same amounts of alcohol. It is not the<br />
type of drink but rather the amount of alcohol consumed that determines<br />
the extent to which an individual is affected by drinking.<br />
76
Question 1. Which contains more alcohol, a 12-ounce bottle of beer<br />
that is 5 percent alcohol or 1 ounce of whiskey that is 50 percent alcohol?<br />
Show your calculations.<br />
The serving of beer contains more alcohol than does the serving of<br />
whiskey.<br />
Beer: 12 ounces x 0.05 (that is, 5% alcohol) = 0.6 ounces alcohol<br />
Whiskey: 1 ounce x 0.50 (that is, 50% alcohol) = 0.5 ounces alcohol<br />
Question 2. Based on your calculations, is it safer for a person to<br />
drink beer than it is to drink whiskey?<br />
The higher alcohol content of the beer in Question 1 demonstrates<br />
that it is not safer to drink beer than it is to drink hard liquor.<br />
Rather, the alcohol content <strong>and</strong> volume consumed determine the<br />
effects of the alcoholic beverage on an individual.<br />
Working through this question enables students to respond correctly<br />
to Statement 4 on Master 1.1, <strong>Alcohol</strong>: Is This Right?: “Drinking beer<br />
is safer than drinking wine or hard liquor such as vodka or whiskey.”<br />
Teacher note<br />
Students may raise questions about a “shot,” or 1.5 ounces, being the typical<br />
serving size for hard liquor. Students are likely to have seen mixed<br />
drinks containing hard liquor that are much larger than 1.5 ounces.<br />
Remind students that these drinks often have other liquids, such as water,<br />
juice, or soft drinks, mixed in with the alcohol. You may remind students<br />
that a 12-ounce beer contains the same number of ounces of alcohol<br />
(0.6 ounces; see the table above), <strong>and</strong> the rest is primarily water.<br />
Teacher note<br />
In the classroom, you may encounter questions about how the percentage<br />
of alcohol in a drink relates to the concept of proof. In the United States,<br />
proof is a measure equivalent to twice the percentage of alcohol by volume;<br />
that is, an 80-proof liquor is 40 percent alcohol by volume.<br />
18. Ask students to summarize what they have learned from the activity<br />
by asking them to identify the factors that determine the<br />
amount of alcohol contained in an alcoholic beverage.<br />
Students should respond that the percentage of alcohol in the drink<br />
<strong>and</strong> the serving size determine the amount of alcohol contained in<br />
an alcoholic beverage.<br />
Assessment:<br />
To evaluate the students’<br />
underst<strong>and</strong>ing<br />
of concentration,<br />
assign a few problems<br />
to solve, such as, How<br />
many 12-ounce beers<br />
containing 5 percent<br />
alcohol does it take to<br />
equal the amount of<br />
alcohol contained in a<br />
30-ounce bottle of<br />
wine that contains<br />
12 percent alcohol?<br />
(Answer: Six bottles of<br />
beer.)<br />
77<br />
Student Lesson 2
<strong>Underst<strong>and</strong>ing</strong> <strong>Alcohol</strong>: <strong>Investigations</strong> <strong>into</strong> <strong>Biology</strong> <strong>and</strong> <strong>Behavior</strong><br />
Activity 2: Where Does <strong>Alcohol</strong> Go in the Body?<br />
1. Introduce this part of the lesson by asking, “What happens to the<br />
alcohol after a person takes a drink? Where does it go?” As students<br />
name parts of the body, ask them to put their responses in<br />
the proper sequence, tracing the path that alcohol takes as it<br />
passes through the body.<br />
You may want to prompt students by saying that alcohol enters<br />
through the mouth. Then ask, “Where does alcohol go next?”<br />
2. To help students visualize how alcohol is distributed throughout<br />
the body, display the transparency of Master 2.2, Tracing <strong>Alcohol</strong>’s<br />
Path through the Body.<br />
<strong>Alcohol</strong> is normally taken <strong>into</strong> the body through the mouth. After it<br />
is swallowed, it passes down the throat (esophagus). Help the students<br />
appreciate that when alcohol is consumed, it is first absorbed<br />
by the stomach <strong>and</strong> small intestine, then incorporated <strong>into</strong> the<br />
bloodstream. Students may continue by saying that alcohol goes to<br />
the liver, where it is metabolized (or broken down). After alcohol is<br />
metabolized, it passes through the kidneys, which process it for<br />
excretion in the urine. Be sure that students trace the path as<br />
depicted in Figure 2.4 below.<br />
1. <strong>Alcohol</strong> enters the mouth.<br />
2. <strong>Alcohol</strong> travels down the throat to the stomach.<br />
3. <strong>Alcohol</strong> is absorbed <strong>into</strong> the blood by the stomach<br />
<strong>and</strong> small intestine.<br />
4. <strong>Alcohol</strong> travels through the blood to the water-containing<br />
organs of the body.<br />
5. <strong>Alcohol</strong> affects many brain functions.<br />
6. <strong>Alcohol</strong> is metabolized in the liver.<br />
7. <strong>Alcohol</strong> is excreted from the body after processing<br />
by the kidneys.<br />
Figure 2.4. Tracing alcohol’s path through the body.<br />
78
3. Now that students have traced the path of alcohol as it moves<br />
through the body, ask them to consider whether the alcohol distributes<br />
evenly through the body or whether it stays in only certain<br />
types of body tissues. Explain to the class that you will conduct a<br />
demonstration to investigate this question.<br />
4. Place the two containers with different ratios of oil <strong>and</strong> water in<br />
full view of the class. As with the previous demonstration, explain<br />
that each container represents a human body. Inform students that<br />
each container has oil <strong>and</strong> water in it. Ask what differences they<br />
observe in the two containers. Which layer is the oil? Which layer<br />
is the water?<br />
Students should note that the liquids form two layers <strong>and</strong> that the<br />
layers differ in size. The total volume of liquid (oil + water) is the<br />
same in each container. The oil is the top layer, <strong>and</strong> the water is the<br />
bottom layer.<br />
Tip from the field test: Students can relate the two containers to people<br />
with different body types—one a lean athlete with a lower amount of body<br />
fat <strong>and</strong> the other a couch potato with a higher amount of body fat. However,<br />
be sure to reinforce the idea that you are comparing two people of the<br />
same weight.<br />
Content St<strong>and</strong>ard A:<br />
Think critically <strong>and</strong> logically<br />
to make the relationships<br />
between<br />
evidence <strong>and</strong> explanations.<br />
Content St<strong>and</strong>ard B:<br />
A substance has characteristic<br />
properties,<br />
such as density, a boiling<br />
point, <strong>and</strong> solubility,<br />
all of which are<br />
independent of the<br />
amount of the sample.<br />
5. Ask the class why the water <strong>and</strong> oil form two separate layers.<br />
Explain that water is immiscible, or does not mix, with oil. If a liquid<br />
mixes with another liquid, it is miscible with the other liquid.<br />
Other examples of immiscible liquids that students may think of<br />
include oil spills in the ocean where the oil floats on the surface <strong>and</strong><br />
oil-<strong>and</strong>-vinegar salad dressings that separate <strong>into</strong> layers when the<br />
bottle is not shaken. An example of miscible liquids that students<br />
would be familiar with would be lemon juice <strong>and</strong> water (lemonade).<br />
Assessment:<br />
To reinforce the<br />
concept of miscibility,<br />
provide the students<br />
with a short list of<br />
everyday liquids <strong>and</strong><br />
ask them which<br />
liquids will mix with<br />
which other liquids.<br />
Figure 2.5. Bottles containing oil <strong>and</strong><br />
water can simulate people with different<br />
body types.<br />
79<br />
Student Lesson 2
<strong>Underst<strong>and</strong>ing</strong> <strong>Alcohol</strong>: <strong>Investigations</strong> <strong>into</strong> <strong>Biology</strong> <strong>and</strong> <strong>Behavior</strong><br />
6. Ask the class to predict what will happen if you pour alcohol <strong>into</strong><br />
the containers. List the predictions on the board.<br />
Again, responses will vary. Some will respond that alcohol will mix<br />
evenly throughout the solutions, while others will predict that alcohol<br />
will mix with either the oil or the water.<br />
7. Quickly pour 1 ounce of the red-colored alcohol solution <strong>into</strong> one<br />
of the containers. Use a stirring rod to gently mix the solution. Ask<br />
students what happened to the alcohol.<br />
The alcohol mixes with the lower water layer. Bubbles will appear in<br />
the oil layer as the alcohol passes through it. Some red color might<br />
be seen in the bubbles, but it should be obvious that the alcohol is<br />
preferentially mixing with the water layer.<br />
8. Pour the second 1 ounce of red-colored alcohol solution <strong>into</strong> the<br />
second container. Gently mix with the stirring rod. Again, ask students<br />
what happened to the alcohol.<br />
As with the first container, students should notice that the alcohol<br />
mixes with the water but not the oil.<br />
9. Ask the class to compare the two containers. Are there differences<br />
that they can see? Is alcohol miscible with oil or water?<br />
Students should note that the red color is more concentrated in the<br />
glass containing the smaller amount of water (4 ounces) <strong>and</strong> more<br />
mineral oil than in the glass containing more water (6 ounces) <strong>and</strong><br />
less mineral oil. As before, the total amount of liquid in each container<br />
is equal. <strong>Alcohol</strong> is miscible with water <strong>and</strong> not with oil.<br />
10. Ask the class to relate their observations to people who drink alcoholic<br />
beverages.<br />
• Can you tell how alcohol will affect a person by his or her<br />
appearance alone?<br />
It is not possible to tell just by appearance how people will be<br />
affected by alcohol. As you recall from the demonstrations, alcohol<br />
mixes with water <strong>and</strong> not with oil; this is true in the body as well.<br />
Two people of the same size may have different amounts of body fat.<br />
The leaner person’s body contains more water than the body of the<br />
person with the higher body-fat level. Therefore, the concentration<br />
of alcohol (in the water-containing portions of the body) would be<br />
higher in the person with more body fat (same amount of alcohol in<br />
80
a lower total volume). This means that the higher-body-fat person<br />
would be more affected by a given dose of alcohol than a lean person<br />
of the same size. Because females, on average, have more body fat<br />
than males, they tend to feel the effects of alcohol more readily than<br />
do men. In summary, because body-fat content cannot be determined<br />
by appearance alone, it is not possible to predict the effects of alcohol<br />
on an individual solely by visual examination.<br />
• If two individuals have the same amount of body fat but one individual<br />
is larger than the other, who would be more affected by<br />
drinking a beer?<br />
A number of factors, including body size, account for human variation<br />
in response to alcohol. A larger body size means a greater blood<br />
volume for alcohol distribution as compared with a smaller body size<br />
with an equal body fat content. Thus, in general, a larger person will<br />
be less influenced by a given alcohol dose than a smaller person will.<br />
• Because the brain is sensitive to the effects of alcohol, what can<br />
you conclude about the composition of the brain?<br />
Since the brain is affected by alcohol, it must contain a significant<br />
amount of water <strong>into</strong> which the alcohol can mix.<br />
Teacher note<br />
These questions may bring up some sensitive issues for students. The<br />
effects of alcohol on the body are more complex than body size <strong>and</strong><br />
amount of body fat. Although females are usually smaller than males <strong>and</strong><br />
have higher levels of body fat, a comparison strictly on the basis of gender<br />
is not accurate. Other factors also influence how alcohol affects a person.<br />
For example, females, in general, are more sensitive to the effects of alcohol<br />
than males are because of differences in distribution.<br />
81<br />
Student Lesson 2
<strong>Underst<strong>and</strong>ing</strong> <strong>Alcohol</strong>: <strong>Investigations</strong> <strong>into</strong> <strong>Biology</strong> <strong>and</strong> <strong>Behavior</strong><br />
Lesson 2 Organizer<br />
Activity 1: What Is a Drink?<br />
What the Teacher Does<br />
Procedure Reference<br />
Ask the class to name different kinds of alcoholic beverages<br />
<strong>and</strong> list them on the board.<br />
Pages 72–73<br />
Step 1<br />
Have the class categorize each beverage as beer, wine, or<br />
hard liquor.<br />
Page 73<br />
Step 2<br />
Invite students to consider differences between the different<br />
types of drinks.<br />
Page 73<br />
Step 3<br />
Show the class three simulated alcoholic beverages <strong>and</strong> ask<br />
the students to share their observations about them.<br />
Pages 73–74<br />
Steps 4 <strong>and</strong> 5<br />
Show the class three containers of water that each represent<br />
a human body.<br />
• Ask the class to predict what will happen when the<br />
simulated drinks are poured <strong>into</strong> the containers.<br />
Page 74<br />
Step 6<br />
Pour each of the simulated drinks <strong>into</strong> a separate container<br />
<strong>and</strong> ask the class,<br />
• Do they look the same or different from each other?<br />
• Which container has the most “alcohol” in it?<br />
Page 74<br />
Steps 7–10<br />
Introduce the concept of concentration <strong>and</strong> ask the class,<br />
• Which container has the highest concentration of<br />
alcohol?<br />
Pages 74–76<br />
Steps 11–14<br />
= Involves copying a master. = Involves using a transparency.<br />
82
• How do the amounts of alcohol added to each container<br />
compare?<br />
• Which simulated drink has the highest (<strong>and</strong> lowest)<br />
alcohol concentration?<br />
Pages 74–76<br />
Steps 11–14<br />
(continued)<br />
Have the class consider how the same amount of alcohol<br />
affects a smaller person compared with a larger person.<br />
• Would the concentration of alcohol in the blood be the<br />
same for each person?<br />
• Which person would have the higher concentration of<br />
alcohol in their blood?<br />
• Why does the same amount of alcohol have a greater<br />
effect on the smaller person?<br />
Page 76<br />
Step 15<br />
Have the students calculate the amount of alcohol in each<br />
type of drink using Master 2.1, What Is a Drink? Ask them to<br />
draw conclusions about how different drinks compare with<br />
each other.<br />
Pages 76–77<br />
Steps 16<br />
<strong>and</strong> 17<br />
Ask the class to identify factors that determine the amount<br />
of alcohol in an alcoholic beverage.<br />
Page 77<br />
Step 18<br />
Activity 2: Where Does <strong>Alcohol</strong> Go in the Body?<br />
What the Teacher Does<br />
Procedure Reference<br />
Discuss where alcohol goes once it enters the body.<br />
• Help students visualize the pathway of alcohol through<br />
the body using Master 2.2, Tracing <strong>Alcohol</strong>’s Path<br />
through the Body.<br />
• Ask students if alcohol distributes evenly throughout<br />
the different body tissues.<br />
Pages 78–79<br />
Steps 1–3<br />
83<br />
Student Lesson 2
<strong>Underst<strong>and</strong>ing</strong> <strong>Alcohol</strong>: <strong>Investigations</strong> <strong>into</strong> <strong>Biology</strong> <strong>and</strong> <strong>Behavior</strong><br />
Show the class two containers with mixtures of oil <strong>and</strong><br />
water.<br />
• Explain that each container represents a human body.<br />
• Discuss the concept of miscible liquids.<br />
Page 79<br />
Steps 4 <strong>and</strong> 5<br />
Ask the class to predict what will happen when a simulated<br />
alcoholic drink is poured <strong>into</strong> each container.<br />
Page 80<br />
Step 6<br />
Pour the simulated drinks <strong>into</strong> each container. Ask the class,<br />
• Are there differences between the two containers?<br />
• Is alcohol miscible with oil or water?<br />
Page 80<br />
Steps 7–9<br />
Have the class relate their observations to people drinking<br />
alcohol.<br />
• Can appearance alone tell you how alcohol will affect a<br />
person?<br />
• Why do people show variation in response to the same<br />
amount of alcohol?<br />
• Since the brain is sensitive to the effects of alcohol,<br />
what can you conclude about its composition?<br />
Pages 80–81<br />
Step 10<br />
84
What Is a Drink?<br />
Name ________________________<br />
Date _____________________<br />
Calculate the total amount of alcohol in a typical serving of the following alcoholic drinks.<br />
Type of drink Volume of serving Concentration of Concentration of Total amount of<br />
(in ounces) alcohol expressed alcohol expressed alcohol<br />
as a percent as a percent in (in ounces)<br />
decimal form<br />
Beer 12 5 0.05<br />
Wine 5 12 0.12<br />
Hard liquor 1.5 40 0.40<br />
The amount of alcohol in a drink can be calculated by multiplying the volume of the drink by the<br />
percentage of alcohol it contains. Remember to express percentage of alcohol in its decimal form<br />
before doing the multiplication. For example, 5% = 0.05 when expressed as a decimal.<br />
Volume Percentage Total Amount of <strong>Alcohol</strong><br />
of x of = in<br />
Serving <strong>Alcohol</strong> Serving<br />
(in decimal form)<br />
Answer the following questions.<br />
1. Which contains more alcohol, a 12-ounce bottle of beer that is 5 percent alcohol or 1 ounce of<br />
whiskey that is 50 percent alcohol? Show your calculations.<br />
2. Based on your calculations, is it safer for a person to drink beer than it is to drink whiskey?<br />
Master 2.1
Tracing <strong>Alcohol</strong>’s Path through the Body<br />
Master 2.2
Responding to <strong>Alcohol</strong>:<br />
What’s Important?<br />
Lesson 3<br />
Explore/<br />
Explain<br />
Figure 3.1. A variety of factors<br />
influences an organism’s<br />
response to alcohol.<br />
Overview<br />
In Lesson 3, students explore the effects of alcohol on the motor activity<br />
(movement) of mice by analyzing data from three experiments. In the first<br />
experiment, students investigate the effect of alcohol dose on mouse activity.<br />
In the second experiment, students track the effect of increasing time<br />
after alcohol consumption on mouse activity. In the third experiment,<br />
aimed at underst<strong>and</strong>ing the role of genetics in alcohol response, students<br />
compare the effects of alcohol dose on activity using two different strains<br />
of mice. Students make measurements, then graph <strong>and</strong> interpret their data.<br />
In each experiment, students are asked to draw conclusions about the animal’s<br />
response to alcohol.<br />
At a Glance<br />
Major Concepts<br />
<strong>Alcohol</strong> produces a variety of effects on animal behavior including their<br />
movement. <strong>Alcohol</strong> exhibits a typical dose-response relationship: the<br />
greater the amount of alcohol consumed (dose), the greater the effect on<br />
behavior (response). Individuals within a population differ in their<br />
response to alcohol; some individuals are more sensitive to its effects than<br />
others. These differences in alcohol response have a genetic contribution.<br />
Since alcohol is metabolized at a constant rate by the body, the acute effects<br />
of alcohol decrease with increasing time after consumption.<br />
87
<strong>Underst<strong>and</strong>ing</strong> <strong>Alcohol</strong>: <strong>Investigations</strong> <strong>into</strong> <strong>Biology</strong> <strong>and</strong> <strong>Behavior</strong><br />
Objectives<br />
During this lesson, students will<br />
• underst<strong>and</strong> that the effect of alcohol is dose dependent;<br />
• realize that alcohol can both stimulate <strong>and</strong> inhibit motor behaviors;<br />
• explore individual variation in response to alcohol;<br />
• recognize that genotype is one factor responsible for variation in<br />
response to alcohol;<br />
• explain how the effects of alcohol on behavior change over time;<br />
• explain the use of experimental controls; <strong>and</strong><br />
• recognize the usefulness of animal models in biology.<br />
Teacher Background<br />
Consult the following sections in Information about <strong>Alcohol</strong>:<br />
5 <strong>Alcohol</strong>: Pharmacokinetics (page 28)<br />
5.1 Absorption <strong>and</strong> distribution of alcohol in the body (page 29)<br />
5.2 Measurement of blood alcohol concentration (BAC) (page 29)<br />
5.3 Factors affecting alcohol absorption <strong>and</strong> elimination (pages 29–30)<br />
5.4 <strong>Alcohol</strong> metabolism (pages 30–31)<br />
6.1 <strong>Alcohol</strong> <strong>and</strong> the brain (pages 31–35)<br />
6.2 <strong>Alcohol</strong> <strong>and</strong> body systems (pages 35–37)<br />
7 <strong>Alcohol</strong>: <strong>Behavior</strong>al Effects (page 37)<br />
8.2 <strong>Alcohol</strong>ism <strong>and</strong> genetics (pages 39–40)<br />
10.1 The costs to society (page 42)<br />
10.3 Drinking <strong>and</strong> risky behavior (pages 43–44)<br />
10.5 Drinking <strong>and</strong> violence (pages 45–46)<br />
In Advance<br />
Web-Based Activities<br />
Activity<br />
1<br />
2<br />
Web Version?<br />
Yes<br />
No<br />
Photocopies<br />
Activity 1<br />
Master 3.1, Study 1—Effect of <strong>Alcohol</strong> Dose on Mouse<br />
Movement (Make 1 copy per student.)<br />
Master 3.2, Study 1—Mouse Movement Data (Make 1 copy<br />
per student.) a<br />
Master 3.3, Study 1—Worksheet <strong>and</strong> Graph Template (Make 1<br />
copy per student <strong>and</strong> prepare an overhead transparency.)<br />
Master 3.4, Study 2—Effect of Time on <strong>Alcohol</strong> Response<br />
(Make 1 copy per student.)<br />
88
Activity 1<br />
Activity 2<br />
Master 3.5, Study 2a—Control Mouse Movement Data<br />
(Make 1 copy per student.) a<br />
Master 3.6, Study 2b—Experimental Mouse Movement Data<br />
(Make 1 copy per student.) a<br />
Master 3.7, Study 2—Worksheet <strong>and</strong> Graph Template (Make<br />
1 copy per student <strong>and</strong> prepare an overhead transparency.)<br />
Master 3.8, Study 3—Effect of Genetics on <strong>Alcohol</strong> Response<br />
(Make 1 copy per student.)<br />
Master 3.9, Study 3a—Mouse Movement Data (Make 1<br />
copy per student.) a<br />
Master 3.10, Study 3b—Mouse Movement Data (Make 1<br />
copy per student.) a<br />
Master 3.11, Study 3—Worksheet <strong>and</strong> Graph Template<br />
(Make 1 copy per student <strong>and</strong> prepare an overhead<br />
transparency.)<br />
no photocopies needed<br />
a Only needed for print-based version.<br />
Materials<br />
Activity 1<br />
Activity 2<br />
computers with Internet connection <strong>and</strong> a sound card<br />
no materials needed except Masters 3.3, 3.7, <strong>and</strong> 3.11<br />
from Activity 1<br />
Teacher note<br />
If multiple computers are not available, project images from a single computer<br />
for the class.<br />
Preparation<br />
If necessary, check with your computer lab personnel to determine which<br />
type of Internet connection your school uses. For Activity 1, you need to<br />
know whether you will use a modem, an ISDN line, or a T1 connection.<br />
No preparations needed (except for photocopying).<br />
Make sure that the Internet connections are working <strong>and</strong> that the sound is<br />
functioning.<br />
Teacher note<br />
The alcohol doses used in these experiments are described in units of<br />
grams of alcohol per kilogram of body weight. Students may ask how these<br />
doses compare with human consumption. The lowest dose of 1.5 grams of<br />
alcohol per kilogram of body weight corresponds to the amount of alcohol<br />
needed to cause an average-sized person to just reach the legal limit of<br />
Procedure<br />
89<br />
Student Lesson 3
<strong>Underst<strong>and</strong>ing</strong> <strong>Alcohol</strong>: <strong>Investigations</strong> <strong>into</strong> <strong>Biology</strong> <strong>and</strong> <strong>Behavior</strong><br />
<strong>into</strong>xication. The doses of 2.0 <strong>and</strong> 3.0 grams of alcohol per kilogram of<br />
body weight correspond to higher levels of <strong>into</strong>xication.<br />
Teacher note<br />
If possible, we recommend using the Web-based versions of the activities<br />
in this lesson. Instructions are provided first for the Web version of the<br />
activity <strong>and</strong> then for the print-based version.<br />
Activity 1: Gathering Data<br />
For classes using the<br />
Web-based version of this lesson:<br />
Study 1—Effect of <strong>Alcohol</strong> Dose on Mouse Activity<br />
1. Log onto the Web site<br />
http://science.education.nih.gov/supplement/alcohol/student <strong>and</strong> click<br />
on “Lesson 1—<strong>Alcohol</strong>: Separating Fact from Fiction.” Select the<br />
type of Internet connection you are using (56k modem, ISDN, or<br />
T1) <strong>and</strong> click to play a mouse video.<br />
Content St<strong>and</strong>ard C:<br />
<strong>Behavior</strong> is one kind of<br />
response an organism<br />
can make to an internal<br />
or external environmental<br />
stimulus.<br />
2. Introduce the activity by having the class review the two short<br />
video clips of the mice used during Lesson 1. Remind students<br />
which type of Internet connection your school uses. Ask students<br />
to recall their conclusions about the effects of alcohol on mouse<br />
behavior, especially with regard to the loss of inhibition.<br />
3. Explain to students that they will be analyzing data from three<br />
experiments that investigate the effects of alcohol on the movement<br />
of mice. They will begin by investigating the effects of alcohol<br />
dose on motor activity (movement) in mice.<br />
4. Instruct students to click on the “Student Activities” link to return<br />
to the “Web Portion of Student Activities” page.<br />
5. Give each student a copy of Master 3.1, Study 1—Effect of <strong>Alcohol</strong><br />
Dose on Mouse Movement, <strong>and</strong> Master 3.3, Study 1—Worksheet <strong>and</strong><br />
Graph Template.<br />
6. Instruct students to read Master 3.1, Study 1—Effect of <strong>Alcohol</strong><br />
Dose on Mouse Movement. Be sure they underst<strong>and</strong> how the experiment<br />
was performed <strong>and</strong> answer any questions.<br />
7. Next, instruct students to click on the link to Lesson 3—Responding<br />
to <strong>Alcohol</strong>: What’s Important? They should click on the “Start”<br />
button to listen to the introduction.<br />
90
Students will hear a brief introduction to the activity <strong>and</strong> be taken<br />
<strong>into</strong> the virtual laboratory.<br />
8. Instruct students to click on the link to Study 1—Effect of Dose.<br />
Students will read instructions asking them to select a mouse <strong>and</strong><br />
count the number of grid lines it crosses. This number should be<br />
recorded in their data table on Master 3.3. This process is repeated<br />
for the three remaining mice.<br />
Study 2—Effect of Time on Response to <strong>Alcohol</strong><br />
Teacher note<br />
The experimental mice in this study were given alcohol at a dose of<br />
3 grams alcohol/kg body weight.<br />
1. Give each student 1 copy of both Master 3.4, Study 2—Effect of<br />
Time on <strong>Alcohol</strong> Response, <strong>and</strong> Master 3.7, Study 2—Worksheet <strong>and</strong><br />
Graph Template.<br />
2. Instruct students to read Master 3.4, Study 2—Effect of Time on<br />
<strong>Alcohol</strong> Response. Be sure they underst<strong>and</strong> how the experiment was<br />
performed <strong>and</strong> answer any questions.<br />
3. Instruct students to click on the “Back” button <strong>and</strong> then on the<br />
link for Study 2a—Effect of Time.<br />
Students will read instructions asking them to select the control<br />
mouse <strong>and</strong> count the number of grid lines it crosses for each time<br />
interval. These numbers should be recorded in their data table on<br />
Master 3.7.<br />
4. After collecting data on the fourth mouse, students should click on<br />
the “Back” button. Next, they click on the link for Study 2b—Effect<br />
of Time.<br />
5. Students repeat the data collection procedure in Step 3 for the<br />
experimental mice.<br />
Study 3—Effect of Genetics on Response to <strong>Alcohol</strong><br />
1. Explain to students that the different colors of the two mouse<br />
strains used in this study reflect genetic differences. Ask students<br />
what sort of genetic differences might exist between the two<br />
strains that could account for different responses to alcohol.<br />
91<br />
Student Lesson 3
<strong>Underst<strong>and</strong>ing</strong> <strong>Alcohol</strong>: <strong>Investigations</strong> <strong>into</strong> <strong>Biology</strong> <strong>and</strong> <strong>Behavior</strong><br />
Students’ responses may be very general: differences in the brain or<br />
differences in the way the animals metabolize the alcohol may be<br />
suggested. Accept all reasonable answers <strong>and</strong> explain that it is time<br />
to investigate. Discussion of genetic variation can occur after this<br />
study <strong>and</strong> during Lessons 4 <strong>and</strong> 5.<br />
2. Give each student 1 copy of both Master 3.8, Study 3—Effect of<br />
Genetics on <strong>Alcohol</strong> Response, <strong>and</strong> Master 3.11, Study 3—Worksheet<br />
<strong>and</strong> Graph Template.<br />
3. Instruct students to read Master 3.8, Study 3—Effect of Genetics on<br />
<strong>Alcohol</strong> Response. Be sure that they underst<strong>and</strong> how the experiment<br />
was performed <strong>and</strong> answer any questions.<br />
4. Instruct students to click on the “Back” button <strong>and</strong> then on the<br />
link for Study 3a—Effect of Genetics.<br />
Content St<strong>and</strong>ard C:<br />
<strong>Behavior</strong> is one kind of<br />
response an organism<br />
can make to an internal<br />
or external environmental<br />
stimulus.<br />
Students will read instructions asking them to select a mouse <strong>and</strong><br />
count the number of grid lines it crosses. This number should be<br />
recorded in their data table on Master 3.11. This process is repeated<br />
for the three remaining mice of that genetic strain.<br />
5. After collecting data on the fourth mouse, students should click on<br />
the “Back” button. Next they click on the link for Study 3b—Effect<br />
of Genetics to access the experiment with mice using a different<br />
genetic strain.<br />
6. Students repeat the data-collection procedure in Step 4 for mice of<br />
the second strain.<br />
Alternate version of Activity 1 for classes<br />
without access to the Internet:<br />
Study 1—Effect of <strong>Alcohol</strong> Dose on Mouse Activity<br />
1. Explain that students will be analyzing data from three experiments<br />
to investigate the effects of alcohol on the movement of<br />
mice. They will begin by investigating the effects of alcohol dose<br />
on motor activity (movement) in mice.<br />
2. Give each student 1 copy of Master 3.1, Study 1—Effect of <strong>Alcohol</strong><br />
Dose on Mouse Movement, Master 3.2, Study 1—Mouse Movement<br />
Data, <strong>and</strong> Master 3.3, Study 1—Worksheet <strong>and</strong> Graph Template.<br />
92
• Master 3.1 describes how the experiment was performed.<br />
• Master 3.2 contains the experimental data.<br />
• Master 3.3 contains a worksheet <strong>and</strong> graph template.<br />
3. Instruct students to read Master 3.1, Study 1—Effect of <strong>Alcohol</strong><br />
Dose on Mouse Movement. Be sure they underst<strong>and</strong> how the experiment<br />
was performed <strong>and</strong> answer any questions.<br />
4. Next, instruct students to count the number of grid lines crossed<br />
by each mouse on Master 3.2 <strong>and</strong> record the numbers in the appropriate<br />
spaces on their data table on Master 3.3.<br />
Study 2—Effect of Time on Response to <strong>Alcohol</strong><br />
Teacher note<br />
The experimental mice in this study were given alcohol at a dose of<br />
3 grams alcohol/kg body weight.<br />
1. Give each student 1 copy of Master 3.4, Study 2—Effect of Time on<br />
<strong>Alcohol</strong> Response, Master 3.5, Study 2a—Control Mouse Movement<br />
Data, Master 3.6, Study 2b—Experimental Mouse Movement Data,<br />
<strong>and</strong> Master 3.7, Study 2—Worksheet <strong>and</strong> Graph Template.<br />
• Master 3.4 describes how the experiment was performed.<br />
• Masters 3.5 <strong>and</strong> 3.6 contain the experimental data.<br />
• Master 3.7 contains a worksheet <strong>and</strong> graph template.<br />
2. Instruct students to read Master 3.4, Study 2—Effect of Time on<br />
<strong>Alcohol</strong> Response. Be sure they underst<strong>and</strong> how the experiment was<br />
performed <strong>and</strong> answer any questions.<br />
3. Instruct the students to count the number of grid lines crossed by<br />
each mouse on Masters 3.5 <strong>and</strong> 3.6 <strong>and</strong> record the numbers in<br />
their data table on Master 3.7.<br />
Study 3—Effect of Genetics on Response to <strong>Alcohol</strong><br />
1. Explain to students that this study uses two mouse strains with<br />
different genetic backgrounds. Ask students what sort of genetic<br />
differences might exist between the two strains that could account<br />
for differing responses to alcohol.<br />
Students’ responses may be very general: differences in the brain or<br />
differences in the way the animals metabolize the alcohol may be<br />
suggested. Accept all reasonable answers <strong>and</strong> explain that it is time<br />
93<br />
Student Lesson 3
<strong>Underst<strong>and</strong>ing</strong> <strong>Alcohol</strong>: <strong>Investigations</strong> <strong>into</strong> <strong>Biology</strong> <strong>and</strong> <strong>Behavior</strong><br />
to investigate. Discussion of genetic variation can occur after this<br />
study <strong>and</strong> during Lessons 4 <strong>and</strong> 5.<br />
2. Give each student 1 copy of Master 3.8, Study 3—Effect of Genetics<br />
on <strong>Alcohol</strong> Response, Master 3.9, Study 3a—Mouse Movement Data,<br />
Master 3.10, Study 3b—Mouse Movement Data, <strong>and</strong> Master 3.11,<br />
Study 3—Worksheet <strong>and</strong> Graph Template.<br />
• Master 3.8 describes how the experiment was performed.<br />
• Masters 3.9 <strong>and</strong> 3.10 contain the experimental data.<br />
• Master 3.11 contains a worksheet <strong>and</strong> graph template.<br />
3. Instruct students to read Master 3.8, Study 3—Effect of Genetics on<br />
<strong>Alcohol</strong> Response. Be sure that they underst<strong>and</strong> how the experiment<br />
was performed <strong>and</strong> answer any questions.<br />
Content St<strong>and</strong>ard A:<br />
Think critically <strong>and</strong><br />
logically to make the<br />
relationships between<br />
evidence <strong>and</strong> explanations.<br />
4. Instruct students to count the number of grid lines crossed by each<br />
mouse on Masters 3.9 <strong>and</strong> 3.10 <strong>and</strong> record the numbers in their<br />
data table on Master 3.11.<br />
Activity 2: Data Analysis <strong>and</strong> Discussion<br />
Study 1—Effect of <strong>Alcohol</strong> Dose on Mouse Activity<br />
1. Students should use their data <strong>and</strong> the graph template on Master<br />
3.3, Study 1—Worksheet <strong>and</strong> Graph Template, to create a plot of<br />
movement (number of grid lines crossed) versus alcohol dose.<br />
After students plot their data, instruct them to connect the data<br />
points with lines.<br />
If you prefer, have students graph their data in histogram form.<br />
2. Students’ data for Study 1 should be as follows:<br />
Dose of alcohol<br />
Number of<br />
(g alcohol/kg body weight) grid lines crossed<br />
0.0 10<br />
1.5 16<br />
2.0 20<br />
3.0 4<br />
3. Ask the class how the movement of mice varies with increasing<br />
doses of alcohol.<br />
94
Figure 3.2. Data<br />
for Study 1—<br />
Effect of <strong>Alcohol</strong><br />
Dose on Mouse<br />
Movement.<br />
Students should explain that mouse movement<br />
(number of grid lines crossed) increases as the dose of alcohol increases<br />
from 0 to 1.5 g/kg <strong>and</strong> again from 1.5 g/kg to 2.0 g/kg. Movement then<br />
decreases from 2.0 g/kg to 3.0 g/kg. Students should note that alcohol<br />
affects the movement of mice <strong>and</strong> that this effect depends on the dose<br />
of the alcohol.<br />
4. Ask the class why the study included a mouse that was not given<br />
any alcohol.<br />
The mouse that was not given alcohol is called a control mouse.<br />
Mice given alcohol are called the experimental mice. In order to<br />
reach a conclusion about the effect of alcohol on mouse movement,<br />
it is necessary to compare mice that were given alcohol with those<br />
that were not. Ideally, the control mouse should be just like the<br />
experimental mice except for the variable being tested (alcohol).<br />
Study 2—Effect of Time on Response to <strong>Alcohol</strong><br />
1. Students should use their data <strong>and</strong> the graph template on Master<br />
3.7 to create a plot of movement (grid lines crossed) versus time<br />
after alcohol consumption. After plotting their data, instruct them<br />
to connect the data points with lines.<br />
Content St<strong>and</strong>ard A:<br />
Design <strong>and</strong> conduct a<br />
scientific investigation.<br />
95<br />
Student Lesson 3
<strong>Underst<strong>and</strong>ing</strong> <strong>Alcohol</strong>: <strong>Investigations</strong> <strong>into</strong> <strong>Biology</strong> <strong>and</strong> <strong>Behavior</strong><br />
If you prefer, have students graph their data in histogram form. Data<br />
for the control <strong>and</strong> experimental mice should be plotted on the same<br />
graph.<br />
2. Students’ data for Study 2 should be as follows:<br />
Control mouse<br />
Experimental mouse<br />
Time Number of grid Time Number of grid<br />
lines crossed<br />
lines crossed<br />
0 to 1 min. 6 0 to 1 min. 12<br />
5 to 6 min. 8 5 to 6 min. 10<br />
10 to 11 min. 8 10 to 11 min. 6<br />
15 to 16 min. 10 15 to 16 min. 2<br />
3. Ask the class to describe the effect of alcohol on mouse activity<br />
over time.<br />
Compared with the control mouse, the mouse given alcohol was initially<br />
more active, but then as time passed, its activity slowed, while<br />
that of the control mouse increased.<br />
4. Ask students if they collected data on the mouse given alcohol for<br />
hours instead of minutes, what would happen?<br />
Figure 3.3. Data for<br />
Study 2—Effect of<br />
Time on Response to<br />
<strong>Alcohol</strong>.<br />
96
This question may be difficult for students to answer. The movement<br />
of the mouse would slow to its lowest level <strong>and</strong> remain there for a<br />
while; then, the rate of movement would slowly increase up to the<br />
level of the control mouse. This is because the alcohol is being<br />
metabolized, <strong>and</strong> the blood alcohol concentration slowly decreases<br />
back to zero. When the BAC of the experimental mouse reaches<br />
zero, the mouse given alcohol <strong>and</strong> the control mouse would be<br />
expected to behave similarly.<br />
5. Why does the movement of the control mouse change over time?<br />
This is an opportunity to discuss the nature of science. As mice<br />
become familiar with their environment, they tend to be less cautious.<br />
Since control mouse activity increases over time, this mouse is<br />
becoming familiar with its test surroundings.<br />
Study 3—Effect of Genetics on Response to <strong>Alcohol</strong><br />
1. Students should use their data <strong>and</strong> the graph template on Master<br />
3.11 to create a plot of movement (number of grid lines crossed)<br />
versus alcohol dose. After plotting their data, instruct students to<br />
connect the data points for each mouse.<br />
If you prefer, have the students graph their data in histogram form.<br />
Data for the two different mouse strains should be plotted on the<br />
same graph.<br />
2. Students’ data for Study 3 should be as follows:<br />
Study 3a mice<br />
Study 3b mice<br />
<strong>Alcohol</strong> dose Number of grid <strong>Alcohol</strong> dose Number of grid<br />
(g alcohol/kg lines crossed (g alcohol/kg lines crossed<br />
body weight)<br />
body weight)<br />
0.0 10 0.0 12<br />
1.5 10 1.5 14<br />
2.0 6 2.0 20<br />
3.0 1 3.0 6<br />
3. Ask the class whether the mice in Study 3a behaved like the mice<br />
in Study 3b.<br />
In some ways the mice in Study 3a did behave like the mice in<br />
Study 3b. Initially, they both were fairly active. They responded<br />
differently, however, to the higher doses of alcohol. The mice in<br />
97<br />
Student Lesson 3
<strong>Underst<strong>and</strong>ing</strong> <strong>Alcohol</strong>: <strong>Investigations</strong> <strong>into</strong> <strong>Biology</strong> <strong>and</strong> <strong>Behavior</strong><br />
Figure 3.4. Data for Study<br />
3—Effect of Genetics on<br />
Response to <strong>Alcohol</strong>.<br />
Study 3a rapidly slowed down their movement as the dose increased<br />
from 1.5 to 3.0 g alcohol/kg body weight. In contrast, the mice in<br />
Study 3b first increased, then decreased their movement as the<br />
alcohol dose went from 1.5 to 3.0 g alcohol/kg body weight.<br />
4. Does this experiment suggest that genes play a role in an animal’s<br />
response to alcohol? Why or why not?<br />
The Study 3a <strong>and</strong> Study 3b mice show different responses to alcohol.<br />
The experimental environments for the two strains of mice were the<br />
same. The two mouse strains were h<strong>and</strong>led identically in Study 3a<br />
<strong>and</strong> Study 3b. However, the two mouse strains have some genes that<br />
are different from each other. This genetic difference between the<br />
two mouse strains is the experimental variable. Consequently, the<br />
experiment suggests that genes play a role in response to alcohol.<br />
5. Ask the class to summarize what they have learned about alcohol’s<br />
effects on behavior from these three studies.<br />
Students should mention that the effects of alcohol depend on the<br />
dose, the time after the alcohol was consumed, <strong>and</strong> the genetic background<br />
of the individual.<br />
6. Ask the class why scientists would use mice to investigate the<br />
effects of alcohol.<br />
98
Student responses will vary. Be sure to bring out the idea that scientists<br />
use animals in experiments when using humans is either<br />
impractical or unethical. Data obtained from mice have relevance<br />
because the mice have similar genes <strong>and</strong> biochemistry to humans. It<br />
is important to keep in mind the limitations of such studies, however.<br />
Humans have greater cognitive abilities than mice <strong>and</strong> can<br />
more readily alter their behaviors.<br />
7. On the basis of data from these three studies, can you make any<br />
inferences about the effects of alcohol on humans?<br />
These studies allow students to make inferences about how alcohol<br />
might affect humans. For example, students may comment that at the<br />
lowest dose of alcohol, the mice became more active, then, as the<br />
dose was increased, less active. They may propose that something<br />
similar happens to people <strong>and</strong> comment that some people who have a<br />
few drinks at a party become more outgoing <strong>and</strong> talkative, but if they<br />
drink to excess, they can become very quiet <strong>and</strong> may even pass out.<br />
Students should also reflect on individual variation in response to<br />
alcohol. Results of the study using mice of different strains suggest<br />
that different people may respond to the same dose of alcohol differently.<br />
This is true. <strong>Alcohol</strong> affects some people more profoundly than<br />
others. Some of the variation in response to alcohol is due to genetics<br />
(see Information about <strong>Alcohol</strong>, 8.2 <strong>Alcohol</strong>ism <strong>and</strong> genetics).<br />
8. Conclude the lesson by reminding the class of the statement from<br />
the survey in Lesson 1, which declared that alcohol is a stimulant.<br />
At that time, students either agreed or disagreed with the statement.<br />
Ask the class to use what they learned in this lesson now to<br />
respond to that statement.<br />
This likely will be a difficult concept for students. Based on the studies<br />
explored in this lesson, students may believe that alcohol initially<br />
acts as a stimulant. In fact, alcohol is always a depressant. It appears<br />
to be a stimulant because it initially depresses that part of the brain<br />
that controls inhibitions. See “Misconception 1: <strong>Alcohol</strong> is a stimulant,”<br />
on page 25.<br />
Assessment:<br />
Ask students to define<br />
scientific controls as<br />
related to the design<br />
of experiments.<br />
Instruct them to<br />
describe how the<br />
concept of controls<br />
was used in each of<br />
the three mouse studies<br />
in this lesson.<br />
Assessment:<br />
Before the class discussion,<br />
you may want to<br />
have students write a<br />
short summary of what<br />
they learned from the<br />
mouse experiments.<br />
This gives students an<br />
opportunity to organize<br />
their thoughts. Listening<br />
to the discussion<br />
<strong>and</strong> reading their summaries<br />
will help you<br />
evaluate their underst<strong>and</strong>ing<br />
of the experiments.<br />
99<br />
Student Lesson 3
<strong>Underst<strong>and</strong>ing</strong> <strong>Alcohol</strong>: <strong>Investigations</strong> <strong>into</strong> <strong>Biology</strong> <strong>and</strong> <strong>Behavior</strong><br />
Lesson 3 Organizer: Web Version<br />
Activity 1: Gathering Data<br />
Study 1—Effect of <strong>Alcohol</strong> Dose on Mouse Activity<br />
What the Teacher Does<br />
Have students log onto the Web site, click on “Lesson 1—<br />
<strong>Alcohol</strong>: Separating Fact from Fiction.” Select the type of<br />
Internet connection you are using. Have students click on a<br />
mouse video. Have them recall their conclusions about the<br />
effects of alcohol on mouse behavior.<br />
Explain to the class that they will analyze data from three<br />
experiments that investigate the effects of alcohol on the<br />
movement of mice.<br />
Instruct students to return to the Web site’s main page by<br />
clicking on “Student Activities.”<br />
Pass out to each student a copy of Master 3.1, Study 1—Effect<br />
of <strong>Alcohol</strong> Dose on Mouse Movement, <strong>and</strong> Master 3.3, Study<br />
1—Worksheet <strong>and</strong> Graph Template.<br />
Have students read Master 3.1, Study 1—Effect of <strong>Alcohol</strong><br />
Dose on Mouse Movement.<br />
Instruct students to click on “Lesson 3—Responding to <strong>Alcohol</strong>:<br />
What’s Important?,” then on the “Start” button to listen to the<br />
introduction, <strong>and</strong> then on “Study 1—Effect of Dose.”<br />
• Allow students to collect data on the effect of alcohol dose.<br />
Study 2—Effect of Time on Response to <strong>Alcohol</strong><br />
Pass out to each student a copy of Master 3.4, Study 2—Effect<br />
of Time on <strong>Alcohol</strong> Response, <strong>and</strong> Master 3.7, Study 2—Worksheet<br />
<strong>and</strong> Graph Template.<br />
Procedure Reference<br />
Page 90<br />
Steps 1 <strong>and</strong> 2<br />
Page 90<br />
Step 3<br />
Page 90<br />
Step 4<br />
Page 90<br />
Step 5<br />
Page 90<br />
Step 6<br />
Pages 90–91<br />
Steps 7 <strong>and</strong> 8<br />
Page 91<br />
Step 1<br />
= Involves using<br />
the Internet.<br />
= Involves copying<br />
a master.<br />
100<br />
= Involves using<br />
a transparency.
Have students read Master 3.4, Study 2—Effect of Time on<br />
<strong>Alcohol</strong> Response.<br />
Instruct students to click on the “Back” button <strong>and</strong> then on<br />
the link for Study 2a—Effect of Time. Have students collect<br />
data for the control mouse (mouse 2a).<br />
Instruct students to click on the “Back” button <strong>and</strong> then on<br />
the link to Study 2b—Effect of Time. Have students collect<br />
data for the experimental mouse (mouse 2b).<br />
Page 91<br />
Step 2<br />
Page 91<br />
Step 3<br />
Page 91<br />
Steps 4 <strong>and</strong> 5<br />
Study 3—Effect of Genetics on Response to <strong>Alcohol</strong><br />
Explain the use of two different mouse strains <strong>and</strong> ask students<br />
to suggest how genetics may influence a mouse’s<br />
response to alcohol.<br />
Pass out to each student a copy of Master 3.8, Study 3—<br />
Effect of Genetics on <strong>Alcohol</strong> Response, <strong>and</strong> Master 3.11,<br />
Study 3—Worksheet <strong>and</strong> Graph Template.<br />
Have students read Master 3.8, Study 3—Effect of Genetics<br />
on <strong>Alcohol</strong> Response.<br />
Instruct students to click on the “Back” button <strong>and</strong> then on<br />
the link for Study 3a—Effect of Genetics. Have students collect<br />
data for the first mouse strain.<br />
Instruct students to click on the “Back” button<br />
<strong>and</strong> then on the link to Study 3b—Effect of Genetics. Have<br />
students collect data from the second mouse strain.<br />
Pages 91–92<br />
Step 1<br />
Page 92<br />
Step 2<br />
Page 92<br />
Step 3<br />
Page 92<br />
Step 4<br />
Page 92<br />
Steps 5 <strong>and</strong> 6<br />
Activity 2: Data Analysis <strong>and</strong> Discussion<br />
Study 1—Effect of <strong>Alcohol</strong> Dose on Mouse Activity<br />
What the Teacher Does<br />
Students create a graph of movement (grid lines crossed)<br />
versus alcohol dose on Master 3.3.<br />
Procedure Reference<br />
Page 94<br />
Steps 1 <strong>and</strong> 2<br />
101<br />
Student Lesson 3
<strong>Underst<strong>and</strong>ing</strong> <strong>Alcohol</strong>: <strong>Investigations</strong> <strong>into</strong> <strong>Biology</strong> <strong>and</strong> <strong>Behavior</strong><br />
Ask students,<br />
• How does the movement of mice vary with increasing<br />
doses of alcohol?<br />
• Why did the study include a mouse that was not given<br />
any alcohol?<br />
Pages 94–95<br />
Steps 3 <strong>and</strong> 4<br />
Study 2—Effect of Time on Response to <strong>Alcohol</strong><br />
Students create a graph of movement (grid lines crossed)<br />
versus time after alcohol consumption on Master 3.7.<br />
Ask students,<br />
• How would you describe the effect of alcohol on<br />
mouse activity over time?<br />
• What would happen if you collected data in this study<br />
over hours rather than minutes?<br />
• Why does the movement of the control mouse change<br />
over time?<br />
Pages 95–96<br />
Steps 1 <strong>and</strong> 2<br />
Pages 96–97<br />
Steps 3–5<br />
Study 3—Effect of Genetics on Response to <strong>Alcohol</strong><br />
Students create a graph of movement (grid lines crossed)<br />
versus alcohol dose on Master 3.11.<br />
Ask students,<br />
• Did the mice in Study 3a behave like the mice in<br />
Study 3b?<br />
• Does this study suggest whether genes play a role in<br />
the animal’s response to alcohol?<br />
• Summarize what you learned about alcohol’s effects<br />
on behavior.<br />
• Why do scientists use mice to investigate the effects<br />
of alcohol?<br />
• On the basis of these studies, can you make inferences<br />
about the effects of alcohol on humans?<br />
• Use what you learned here to respond to the statement<br />
that alcohol is a stimulant.<br />
Page 97<br />
Steps 1 <strong>and</strong> 2<br />
Pages 97–99<br />
Steps 3–8<br />
102
Lesson 3 Organizer: Print Version<br />
Activity 1: Gathering Data<br />
Study 1—Effect of <strong>Alcohol</strong> Dose on Mouse Activity<br />
What the Teacher Does<br />
Explain to the class that they will analyze data from three<br />
experiments that investigate the effects of alcohol on the<br />
movement of mice.<br />
Give each student 1 copy of Master 3.1, Study 1—Effect of<br />
<strong>Alcohol</strong> Dose on Mouse Movement, Master 3.2, Study 1—<br />
Mouse Movement Data, <strong>and</strong> Master 3.3, Study 1—Worksheet<br />
<strong>and</strong> Graph Template.<br />
Instruct students to read Master 3.1, Study 1—Effect of<br />
<strong>Alcohol</strong> Dose on Mouse Movement.<br />
Instruct students to count the number of grid lines crossed<br />
by each mouse on Master 3.2, Study 1—Mouse Movement<br />
Data <strong>and</strong> record their data on Master 3.3, Study 1—Worksheet<br />
<strong>and</strong> Graph Template.<br />
Procedure Reference<br />
Page 92<br />
Step 1<br />
Pages 92–93<br />
Step 2<br />
Page 93<br />
Step 3<br />
Page 93<br />
Step 4<br />
Study 2—Effect of Time on Response to <strong>Alcohol</strong><br />
Give each student 1 copy of Master 3.4, Study 2—Effect of<br />
Time on <strong>Alcohol</strong> Response, Master 3.5, Study 2a—Control<br />
Mouse Movement Data, Master 3.6, Study 2b—Experimental<br />
Mouse Movement Data, <strong>and</strong> Master 3.7, Study 2—Worksheet<br />
<strong>and</strong> Graph Template.<br />
Have students read Master 3.4, Study 2—Effect of Time on<br />
<strong>Alcohol</strong> Response.<br />
Page 93<br />
Step 1<br />
Page 93<br />
Step 2<br />
= Involves copying a master.<br />
103<br />
Student Lesson 3
<strong>Underst<strong>and</strong>ing</strong> <strong>Alcohol</strong>: <strong>Investigations</strong> <strong>into</strong> <strong>Biology</strong> <strong>and</strong> <strong>Behavior</strong><br />
Instruct students to count the number of grid lines crossed<br />
by each mouse on Masters 3.5 <strong>and</strong> 3.6 <strong>and</strong> record their<br />
data on Master 3.7<br />
Page 93<br />
Step 3<br />
Study 3—Effect of Genetics on Response to <strong>Alcohol</strong><br />
Explain the use of two different mouse strains <strong>and</strong> ask<br />
students to suggest how genetics may influence a mouse’s<br />
response to alcohol.<br />
Give each student 1 copy of Master 3.8, Study 3—Effect of<br />
Genetics on <strong>Alcohol</strong> Response, Master 3.9, Study 3a—Mouse<br />
Movement Data, Master 3.10, Study 3b—Mouse Movement<br />
Data, <strong>and</strong> Master 3.11, Study 3—Worksheet <strong>and</strong> Graph<br />
Template.<br />
Have students read Master 3.8, Study 3—Effect of Genetics<br />
on <strong>Alcohol</strong> Response.<br />
Instruct students to count the number of grid lines crossed<br />
by each mouse on Masters 3.9 <strong>and</strong> 3.10 <strong>and</strong> record their<br />
data on Master 3.11.<br />
Pages 93–94<br />
Step 1<br />
Page 94<br />
Step 2<br />
Page 94<br />
Step 3<br />
Page 94<br />
Step 4<br />
Activity 2: Data Analysis <strong>and</strong> Discussion<br />
Study 1—Effect of <strong>Alcohol</strong> Dose on Mouse Activity<br />
What the Teacher Does<br />
Students create a graph of movement (grid lines crossed)<br />
versus alcohol dose on Master 3.3.<br />
Procedure Reference<br />
Page 94<br />
Steps 1 <strong>and</strong> 2<br />
Ask students,<br />
• How does the movement of mice vary with increasing<br />
doses of alcohol?<br />
• Why did the study include a mouse that was not given<br />
any alcohol?<br />
Pages 94–95<br />
Steps 3 <strong>and</strong> 4<br />
104
Study 2—Effect of Time on Response to <strong>Alcohol</strong><br />
Students create a graph of movement (grid lines crossed)<br />
versus time after alcohol consumption on Master 3.7.<br />
Pages 95–96<br />
Steps 1 <strong>and</strong> 2<br />
Ask students,<br />
• How would you describe the effect of alcohol on<br />
mouse activity over time?<br />
• What would happen if you collected data in this study<br />
over hours rather than minutes?<br />
• Why does the movement of the control mouse change<br />
over time?<br />
Pages 96–97<br />
Steps 3–5<br />
Study 3—Effect of Genetics on Response to <strong>Alcohol</strong><br />
Students create a graph of movement (grid lines crossed)<br />
versus alcohol dose on Master 3.11.<br />
Ask students,<br />
• Did the mice in Study 3a behave like the mice in<br />
Study 3b?<br />
• Does this study suggest whether genes play a role in<br />
the animal’s response to alcohol?<br />
• Summarize what you learned about alcohol’s effects<br />
on behavior.<br />
• Why do scientists use mice to investigate the effects<br />
of alcohol?<br />
• On the basis of these studies, can you make inferences<br />
about the effects of alcohol on humans?<br />
• Use what you learned here to respond to the statement<br />
that alcohol is a stimulant.<br />
Page 97<br />
Steps 1 <strong>and</strong> 2<br />
Pages 97–99<br />
Steps 3–8<br />
105<br />
Student Lesson 3
Study 1—Effect of <strong>Alcohol</strong><br />
Dose on Mouse Movement<br />
This study investigates the effect of different levels of alcohol consumption on the activity (movement)<br />
of mice. The experiment begins by placing a control mouse that has not been exposed to alcohol on the<br />
center square (labeled “S” for start) of a grid pattern. This is time zero. The mouse is observed for one<br />
minute. The movement of the mouse during this minute is shown by a line on the grid pattern.<br />
To collect your data, count the number of grid lines crossed by the mouse during the one minute of<br />
observation <strong>and</strong> record that number in the space provided on Master 3.3, Study 1—Worksheet <strong>and</strong><br />
Graph Template. Repeat this process for the remaining three mice that have been given alcohol to levels<br />
of 1.5, 2.0, <strong>and</strong> 3.0 grams of alcohol per kilogram of body weight, respectively. In each case, the activity<br />
patterns for these mice were obtained 10 minutes after the mice had been given the alcohol.<br />
Master 3.1
Study 1—Mouse Movement Data<br />
Count the number of grid lines crossed by each mouse <strong>and</strong> record those numbers on Master 3.3, Study<br />
1—Worksheet <strong>and</strong> Graph Template. Note that “S” indicates “start” <strong>and</strong> “F” indicates “finish.”<br />
Master 3.2
Study 1—Worksheet <strong>and</strong> Graph Template<br />
Name ______________________________ Date ______________________<br />
Master 3.3
Study 2—Effect of<br />
Time on <strong>Alcohol</strong> Response<br />
This study investigates the effect of time on the response of mice to alcohol consumption. The activity<br />
(movement) of a control mouse (unexposed to alcohol) is compared with that of a mouse that has<br />
been given alcohol to a level of 3 grams of alcohol per kilogram of body weight. Ten minutes after the<br />
alcohol is given, the mice are placed on the center square (labeled “S” for “start”) of a grid pattern.<br />
This is time zero. Each mouse is observed for one-minute intervals (from 0 to 1 minute, 5 to 6 minutes,<br />
10 to 11 minutes, <strong>and</strong> 15 to 16 minutes). The movement of each mouse during these intervals is<br />
shown by a line on the grid pattern.<br />
To collect your data, count the number of lines crossed by the control mouse during each one minute<br />
of observation <strong>and</strong> record those numbers in the spaces provided on Master 3.7, Study 2—Worksheet<br />
<strong>and</strong> Graph Template. Repeat this process for the experimental mouse that was given alcohol.<br />
Master 3.4
Study 2a—Control-Mouse<br />
Movement Data<br />
Count the number of grid lines crossed by each mouse <strong>and</strong> record those numbers on Master 3.7, Study<br />
2—Worksheet <strong>and</strong> Graph Template. Note that “S” indicates “start” <strong>and</strong> “F” indicates “finish.”<br />
Master 3.5
Study 2b—Experimental-Mouse<br />
Movement Data<br />
Count the number of grid lines crossed by each mouse <strong>and</strong> record those numbers on Master 3.7, Study<br />
2—Worksheet <strong>and</strong> Graph Template. Note that “S” indicates “start” <strong>and</strong> “F” indicates “finish.”<br />
Master 3.6
Study 2—Worksheet<br />
<strong>and</strong> Graph Template<br />
Name ______________________________ Date ______________________<br />
Master 3.7
Study 3—Effect of<br />
Genetics on <strong>Alcohol</strong> Response<br />
This study investigates the effect of genotype (genes) on the response of mice to alcohol consumption.<br />
Two strains of mice that have genetic differences are compared for their responses to alcohol. As in<br />
Study 1, a control mouse that has not been exposed to alcohol is placed on the center square (labeled<br />
“S” for “start”) of a grid pattern. This is time zero. The mouse is observed for one minute. The movement<br />
of the mouse during this minute is depicted by a line on the grid pattern.<br />
To collect your data, count the number of lines crossed by the mouse during the one minute of observation<br />
<strong>and</strong> record that number in the space provided on Master 3.11, Study 3—Worksheet <strong>and</strong> Graph<br />
Template. For the remaining three mice that have been given alcohol to levels of 1.5, 2.0, <strong>and</strong> 3.0 grams<br />
of alcohol per kilogram of body weight, respectively, repeat this process. These activity patterns were<br />
obtained 10 minutes after the mice had been given the alcohol. Be sure to collect data for both strains<br />
of mice (Studies 3a <strong>and</strong> 3b).<br />
Master 3.8
Study 3a—Mouse Movement Data<br />
Count the number of grid lines crossed by each mouse <strong>and</strong> record those numbers on Master 3.11,<br />
Study 3—Worksheet <strong>and</strong> Graph Template. Note that “S” indicates “start” <strong>and</strong> “F” indicates “finish.”<br />
Master 3.9
Study 3b—Mouse Movement Data<br />
Count the number of grid lines crossed by each mouse <strong>and</strong> record those numbers on Master 3.11,<br />
Study 3—Worksheet <strong>and</strong> Graph Template. Note that “S” indicates “start” <strong>and</strong> “F” indicates “finish.”<br />
Master 3.10
Study 3—Worksheet <strong>and</strong> Graph Template<br />
Name ______________________________ Date ______________________<br />
Master 3.11
<strong>Alcohol</strong> Use, Abuse,<br />
<strong>and</strong> <strong>Alcohol</strong>ism<br />
Lesson 4<br />
Explain/<br />
Elaborate<br />
Figure 4.1. Some adults choose to drink alcoholic beverages<br />
while others choose to drink nonalcoholic beverages.<br />
Overview<br />
In Lesson 4, students roll dice to model factors that lead some individuals<br />
to use alcohol <strong>and</strong> others to abstain from it. As part of the modeling activities,<br />
students examine influences that contribute to, or help prevent, alcohol<br />
use, alcohol abuse, <strong>and</strong> alcoholism. Students also explore the<br />
frequencies of alcohol use, abuse, <strong>and</strong> alcoholism in the population.<br />
At a Glance<br />
Major Concepts<br />
<strong>Alcohol</strong> consumption ranges along a continuum from no use to alcoholism.<br />
Many factors including the environment <strong>and</strong> genetics determine<br />
where an individual’s alcohol use falls on this continuum. Personal choice<br />
plays a key role in the decision to use or abstain from alcohol.<br />
Objectives<br />
After completing this lesson, students will<br />
• be able to identify factors that influence alcohol use;<br />
• be able to distinguish among alcohol use, abuse, <strong>and</strong> alcoholism;<br />
• recognize that everyone who chooses to consume alcohol does not<br />
necessarily develop a drinking problem;<br />
• recognize that everyone who abuses alcohol does not necessarily<br />
become an alcoholic; <strong>and</strong><br />
• be able to explain that alcoholism is a complex disease influenced by<br />
genetic <strong>and</strong> environmental factors, as well as by personal choice.<br />
117
<strong>Underst<strong>and</strong>ing</strong> <strong>Alcohol</strong>: <strong>Investigations</strong> <strong>into</strong> <strong>Biology</strong> <strong>and</strong> <strong>Behavior</strong><br />
Teacher Background<br />
Consult the following sections in Information about <strong>Alcohol</strong>:<br />
8.1 Signs of a problem (page 39)<br />
8.2 <strong>Alcohol</strong>ism <strong>and</strong> genetics (pages 39–40)<br />
8.3 <strong>Alcohol</strong>ism treatments (page 40)<br />
10.1 The costs to society (page 42)<br />
In Advance<br />
Web-Based Activities<br />
Activity<br />
1<br />
2<br />
3<br />
4<br />
Web Version?<br />
No<br />
No<br />
No<br />
No<br />
Photocopies<br />
Activity 1<br />
Activity 2<br />
Activity 3<br />
Activity 4<br />
Master 4.1, Environmental Factors Influencing <strong>Alcohol</strong> Use<br />
<strong>and</strong> Nonuse (Make 1 copy per student.)<br />
Master 4.2, Score Sheet for Modeling <strong>Alcohol</strong> Use (Prepare<br />
an overhead transparency.)<br />
Master 4.3, Results for Modeling <strong>Alcohol</strong> Use (Prepare an<br />
overhead transparency.)<br />
Master 4.4, Modeling Genetic Influence (Prepare an overhead<br />
transparency.)<br />
Master 4.5, Factors Influencing <strong>Alcohol</strong> Use <strong>and</strong> Abuse<br />
(Make 1 copy per student.)<br />
Master 4.6, Results for Modeling <strong>Alcohol</strong> Abuse (Prepare an<br />
overhead transparency.)<br />
Master 4.7, Factors Influencing <strong>Alcohol</strong> Abuse <strong>and</strong> <strong>Alcohol</strong>ism<br />
(Make 1 copy per student.)<br />
Master 4.8, Score Sheet for Modeling <strong>Alcohol</strong>ism (Prepare an<br />
overhead transparency.)<br />
Master 4.9, Results for Modeling <strong>Alcohol</strong>ism (Prepare an<br />
overhead transparency.)<br />
Master 4.10, When Is <strong>Alcohol</strong> Use a Problem? (Prepare an<br />
overhead transparency.)<br />
118
Materials<br />
Activity 1<br />
Activity 2<br />
Activity 3<br />
Activity 4<br />
For the class:<br />
1 beer mug or a clear drinking glass (used in Lesson 2) a<br />
water<br />
red food coloring b<br />
dice c<br />
dice c<br />
dice c<br />
no materials needed<br />
a<br />
In Activity 1, you will use a simulated beer, similar to that used in Lesson 2.<br />
b<br />
If you have saved the diluted-food-coloring solution prepared in Lesson 2, use that to prepare<br />
the simulated beer. Otherwise, use a few drops of concentrated food coloring in<br />
water.<br />
c<br />
You can decrease the number of dice needed if you have each group share 1 die. This may<br />
take slightly more class time than giving each student his or her own die.<br />
Preparation<br />
To prepare the simulated beer, fill the beer mug with water, add a couple of<br />
drops of food coloring, <strong>and</strong> mix.<br />
Activity 1: To Drink or Not to Drink?<br />
Procedure<br />
1. Ask the class to recall what they learned from the mouse simulations<br />
in Lesson 3 about which factors influence the response to<br />
alcohol.<br />
Students should recall that the amount of alcohol, the time after consumption,<br />
<strong>and</strong> individual variation (genetic differences) all affect<br />
how a mouse (or a person) responds to alcohol.<br />
2. Remind the students that those simulations looked at what happened<br />
after alcohol was taken <strong>into</strong> the body. Hold up the simulated<br />
alcoholic beverage (see Preparation) for the class to see. Remind<br />
students that this represents a beer (an alcoholic drink). Ask students<br />
to consider what things might influence a person’s decision<br />
to drink or not to drink the beer. Write their answers on the board.<br />
Content St<strong>and</strong>ard F:<br />
Students should<br />
develop an underst<strong>and</strong>ing<br />
of populations,<br />
resources, <strong>and</strong><br />
environments.<br />
119<br />
Student Lesson 4
<strong>Underst<strong>and</strong>ing</strong> <strong>Alcohol</strong>: <strong>Investigations</strong> <strong>into</strong> <strong>Biology</strong> <strong>and</strong> <strong>Behavior</strong><br />
3. Sort their answers <strong>into</strong> five categories:<br />
• availability,<br />
• family environment,<br />
• peer pressure,<br />
• media pressure, <strong>and</strong><br />
• legal restrictions.<br />
Explain that these five categories influence a person’s decision to<br />
drink or not to drink alcohol.<br />
The items in these five categories account for most of the environmental<br />
factors that influence a person’s decision to drink or not to<br />
drink. Other types of factors, including genetics, will be examined in<br />
Activities 2 <strong>and</strong> 3. Of course the effects of environment <strong>and</strong> genetics<br />
are not separated in time as discussed here; they interact with each<br />
other. When students are given an opportunity to discuss how the<br />
model represents, or fails to represent, reality, this fact can be<br />
brought out.<br />
4. Inform students that they will be exploring these environmental<br />
factors <strong>and</strong> their contributions to the decision whether or not to<br />
use alcohol. In the activity, students will roll dice to model fictitious<br />
individuals’ decisions about drinking alcohol. Emphasize to<br />
students that they are going to model the behavior of fictitious individuals.<br />
The results of this activity do not reflect on their behavior<br />
or that of their classmates, family, or other acquaintances.<br />
This activity models behavior. As a model, it has limitations. It is<br />
important to realize that students should not draw conclusions<br />
about the behavior of a friend or family member based on this<br />
activity. See How Can Controversial Topics Be H<strong>and</strong>led in the Classroom?,<br />
on page 14.<br />
5. Give each student a die <strong>and</strong> a copy of Master 4.1, Environmental<br />
Factors Influencing <strong>Alcohol</strong> Use <strong>and</strong> Nonuse.<br />
Figure 4.2. Rolling dice can be<br />
used to model aspects of human<br />
behavior.<br />
120
6. Explain to the class that they will roll the die 5 times for each individual<br />
<strong>and</strong> record the number of each roll in the spaces provided<br />
on Master 4.1. After the first roll, the student records the number<br />
in the space provided under the “Availability” factor on their h<strong>and</strong>out.<br />
The results of rolls two through five are recorded on the<br />
h<strong>and</strong>out in the spaces provided under “Family environment,” “Peer<br />
pressure,” “Media pressure,” <strong>and</strong> “Legal restriction,” respectively.<br />
For a class of 30 students, we suggest that each student model two<br />
fictitious individuals, thus providing data for 60 total individuals.<br />
For classes with fewer than 30 students, adjust the number of individuals<br />
each student models appropriately. The larger the data pool,<br />
the more closely the data will approximate the known distribution.<br />
Students will need these scores when they do Activity 2. Students<br />
should keep Master 4.1 h<strong>and</strong>y.<br />
7. Display a transparency of Master 4.2, Score Sheet for Modeling<br />
<strong>Alcohol</strong> Use. Ask students to record a score for each category based<br />
on the die rolls they recorded. Each student should then add the<br />
values for the five factors to obtain a total score for each modeled<br />
individual.<br />
8. Next, display the overhead transparency of Master 4.3, Results for<br />
Modeling <strong>Alcohol</strong> Use. Summarize the results of the activity by constructing<br />
a histogram of the total scores for the entire class. Remember<br />
that each student will have data for two fictitious individuals.<br />
If you want to make this graphing exercise more interactive, you<br />
may draw a graph template on the chalkboard <strong>and</strong> have students<br />
add their own data to it. Students should place an X above the range<br />
Content St<strong>and</strong>ard A:<br />
Use mathematics in all<br />
aspects of scientific<br />
inquiry.<br />
Figure 4.3. Sample histogram of class data for modeling alcohol use.<br />
121<br />
Student Lesson 4
<strong>Underst<strong>and</strong>ing</strong> <strong>Alcohol</strong>: <strong>Investigations</strong> <strong>into</strong> <strong>Biology</strong> <strong>and</strong> <strong>Behavior</strong><br />
corresponding to their calculated alcohol-use score. As more students<br />
add their Xs to the same score, they place their X above the<br />
preceding one, building up a histogram.<br />
9. Ask students to interpret the graph. Guide the discussion with<br />
questions like the following:<br />
• How are the scores distributed on the graph?<br />
Even though class results will vary, the data should reflect a bellshaped<br />
curve with scores ranging from a low of 0 to a high of 45.<br />
If the data from a particular class do not yield a bell-shaped curve,<br />
this is an opportunity to discuss another limitation of the model.<br />
The class may benefit from a discussion of sample size in experiments<br />
or of probability.<br />
Tip from the field test: If you do this activity with several classes, you may<br />
wish to collect the data from all classes <strong>and</strong> generate a single histogram.<br />
This should result in a graph that more closely resembles that of alcohol<br />
use in a population.<br />
• What do the low scores represent?<br />
A fictitious individual with a score of 15 or less represents someone<br />
who doesn’t drink. It might help for students to refer to the transparency<br />
of Master 4.2, Score Sheet for Modeling <strong>Alcohol</strong> Use, when<br />
answering the next question.<br />
• What factors are responsible for some individuals having scores of<br />
15 or less?<br />
No alcohol was available.<br />
Little or no use of alcohol among peers.<br />
Little exposure to or influence from the media.<br />
Family <strong>and</strong>/or religious values discourage alcohol use.<br />
Respect for laws that prohibit alcohol consumption by minors.<br />
• Do you think this distribution accurately models the actual alcohol<br />
use in a population?<br />
Students may suggest a number of reasons why this model fails to<br />
depict alcohol use in the population accurately. For example, the<br />
model includes only five variables to account for alcohol use <strong>and</strong><br />
only describes two or three variations for each factor. Some students<br />
may suggest that genes may contribute to alcohol use. You may point<br />
out there is evidence for a genetic influence on alcohol abuse <strong>and</strong><br />
122
alcoholism. This will be taken <strong>into</strong> account in the next two activities.<br />
However, there is no evidence that the decision to first consume<br />
alcohol has a genetic component.<br />
10. Continue to display the graph on Master 4.3, Results for Modeling<br />
<strong>Alcohol</strong> Use, on the overhead projector. Ask students to refer to the<br />
completed graph to answer the following questions.<br />
• How many individuals have scores of 15 or less <strong>and</strong>, consequently,<br />
chose not to drink alcoholic beverages?<br />
Answers will vary depending on the data generated by the class.<br />
• According to the Surgeon General, about 33 percent of the population<br />
report that they do not drink alcoholic beverages. Keeping this<br />
in mind, how many fictitious individuals would you expect not to<br />
drink?<br />
If the class models a total of 60 individuals, 33 percent of that group,<br />
or 20 individuals, would not consume alcohol. You can easily revise<br />
that number based on the total sample size that your class generates.<br />
• On the basis of your class’s data, is the number of individuals who<br />
choose to drink higher or lower than the predicted number?<br />
The scoring for this model was designed so that approximately<br />
33 percent of the scores would be 15 or lower. This correlates to the<br />
statistics for the population. In some classes, however, the number of<br />
fictitious individuals whose scores are 15 or less may be higher or<br />
lower than the predicted 33 percent who choose not to drink alcohol.<br />
If your class’s results differ significantly from the predicted number,<br />
you can use this as an opportunity to discuss this limitation of this<br />
model. Discuss the effect of sample size <strong>and</strong> reliance on probability.<br />
Tip from the field test: As the class proceeds through Activity 3, fewer<br />
individuals will be modeled at each stage to help students underst<strong>and</strong> that<br />
fewer people are alcoholic than abuse alcohol <strong>and</strong> that there are fewer<br />
abusers of alcohol than alcohol users. You may find it helpful to write a<br />
chart on the board to summarize the number of fictitious individuals who<br />
fall <strong>into</strong> each of the following categories:<br />
• Total number of modeled individuals:<br />
• Number of alcohol users:<br />
• Number of alcohol abusers:<br />
• Number of alcoholics:<br />
_______<br />
_______<br />
_______<br />
_______<br />
123<br />
Student Lesson 4
<strong>Underst<strong>and</strong>ing</strong> <strong>Alcohol</strong>: <strong>Investigations</strong> <strong>into</strong> <strong>Biology</strong> <strong>and</strong> <strong>Behavior</strong><br />
Activity 2: Modeling <strong>Alcohol</strong> Use <strong>and</strong> Abuse<br />
1. Ask students to recall what they learned in Lesson 3 about genetics<br />
<strong>and</strong> alcohol. What conclusions did they draw about the two different<br />
mice <strong>and</strong> why they responded differently to alcohol? Is it reasonable<br />
to suggest that humans, too, might vary in their response<br />
to alcohol?<br />
Students should recall that Study 3 demonstrated that different<br />
strains of mice react differently to alcohol. These differences are<br />
largely attributable to differences in the genetic makeup of the two<br />
different mice strains. Students should predict (<strong>and</strong> are likely to have<br />
previous knowledge) that different individuals will respond differently<br />
to alcohol <strong>and</strong> that these differences, like those in the mice,<br />
may be affected by different genes.<br />
2. Remind students that the die-rolling activity they just completed<br />
models a person’s decision whether to drink or not to drink alcohol.<br />
Tell the students that they will now be doing an activity that<br />
models whether a person who drinks alcohol will simply use alcohol<br />
appropriately or be more likely to abuse alcohol. Define alcohol<br />
abuse for students.<br />
<strong>Alcohol</strong> abuse is characterized by consumption of excessive amounts<br />
of alcohol <strong>and</strong> is associated with social problems, but the individual<br />
does not experience intense cravings for or withdrawal from alcohol<br />
as with alcoholism.<br />
3. Ask students to consider the question, Can someone who chooses<br />
not to drink alcohol abuse alcohol? On the basis of their responses,<br />
guide students to the conclusion that a person who does not consume<br />
alcohol cannot abuse alcohol.<br />
Students should realize that someone who does not drink alcohol<br />
will not be an abuser. Abuse of alcohol requires drinking alcohol.<br />
Therefore, nondrinkers will not participate in this activity.<br />
Content St<strong>and</strong>ard F:<br />
Students should<br />
develop an underst<strong>and</strong>ing<br />
of personal<br />
health.<br />
4. Inform students that they will again use dice to model the behavior<br />
of the same fictitious individuals that they did in Activity 1. Display<br />
a transparency of Master 4.4, Modeling Genetic Influence, <strong>and</strong><br />
give each student 1 die <strong>and</strong> 1 copy of Master 4.5, Factors Influencing<br />
<strong>Alcohol</strong> Use <strong>and</strong> Abuse.<br />
5. Explain to students that if the individual or individuals whose<br />
behavior they modeled in Activity 1 belonged to the group of nondrinkers<br />
(those individuals with scores of 15 or less), they will not<br />
124
oll the die for that individual. Ask students to roll the die according<br />
to the directions on Master 4.4, Modeling Genetic Influence, to<br />
obtain a score for the genetic influence for each of their modeled<br />
individuals.<br />
6. Instruct students to record the genetic influence factor for each<br />
individual in the appropriate space on Master 4.5, Factors Influencing<br />
<strong>Alcohol</strong> Use <strong>and</strong> Abuse. Also instruct them to transfer their<br />
scores from Activity 1 (recorded on Master 4.1) to the appropriate<br />
spaces on Master 4.5 (environmental factors) <strong>and</strong> add them to the<br />
genetic influence factor to obtain a final score for this activity.<br />
Teacher note<br />
If each student has modeled the behavior of two fictitious individuals in<br />
Activity 1, each student likely will have at least one individual who<br />
belonged in the category of choosing to drink alcohol (individuals with<br />
scores over 15). If, by chance, neither of the two individuals that a student<br />
modeled falls <strong>into</strong> this category, ask the student to partner with another<br />
student <strong>and</strong> watch the activity.<br />
7. Display the overhead transparency of Master 4.6, Results for Modeling<br />
<strong>Alcohol</strong> Abuse. Use the students’ final scores to construct a histogram<br />
of the data for the entire class.<br />
As before, you may choose to have students add their own data to a<br />
graph. Again, you may wish to draw a graph template on the chalkboard<br />
<strong>and</strong> have students place an X above the range corresponding<br />
to their calculated alcohol score. As more students add their Xs to<br />
the same score, they place their X above the preceding one, building<br />
up a histogram.<br />
Because only individuals who chose to drink alcohol in Activity 1 are<br />
included in this modeling exercise, students will have different<br />
Figure 4.4. Sample<br />
histogram of<br />
class data for<br />
modeling alcohol<br />
use <strong>and</strong> abuse.<br />
125<br />
Student Lesson 4
<strong>Underst<strong>and</strong>ing</strong> <strong>Alcohol</strong>: <strong>Investigations</strong> <strong>into</strong> <strong>Biology</strong> <strong>and</strong> <strong>Behavior</strong><br />
Content St<strong>and</strong>ard A:<br />
Use mathematics in<br />
all aspects of scientific<br />
inquiry.<br />
amounts of data to contribute to this graph. Some students will have<br />
data for one fictitious individual, other students will have data for<br />
two fictitious individuals, <strong>and</strong> some students may not be collecting<br />
data during this activity.<br />
8. Ask the students to interpret the completed graph on the<br />
transparency. You may use the following questions to lead the<br />
discussion.<br />
• How are the scores distributed on the graph?<br />
Scores will range from a low of 20 to a high of 180. Since low scores<br />
from Activity 1 have been eliminated, we expect scores for this activity<br />
to cluster closer to the low of 20 than to the high of 180.<br />
• If lower scores represent alcohol use <strong>and</strong> higher scores represent<br />
alcohol abuse, what factors contribute to alcohol abuse?<br />
Students should mention the environmental factors associated with<br />
alcohol use from Activity 1, as well as the genetic factors modeled<br />
here.<br />
The term “environmental factors,” as used in this model, refers to<br />
factors that are not physiological; they are cultural or social influences.<br />
As indicated in Activity 1, environmental factors that contribute<br />
to alcohol abuse include<br />
• alcohol easily available,<br />
• alcohol use or abuse by most or all of the individual’s peers,<br />
• family’s view of alcohol use was positive or not discouraged,<br />
• failure to obey legal restrictions against use by minors, <strong>and</strong><br />
• effective media advertisements portraying alcohol use in a<br />
positive light.<br />
Genetic factors could include having combinations of genes that<br />
influence your susceptibility or reaction to alcohol.<br />
• Explain that each roll of the die in this activity corresponds to having<br />
a version (allele) of a gene that either has no effect on alcohol<br />
use or promotes its use. In this simple model, we used two rolls of<br />
the die, simulating the contributions of just two genes.<br />
In this model:<br />
a. genetic influence factor of 1 = having both alleles of no effect<br />
b. genetic influence factor of 2 = having one allele of no effect <strong>and</strong><br />
one allele that promotes alcohol use<br />
c. genetic influence factor of 4 = having both alleles that promote<br />
alcohol use<br />
126
<strong>Alcohol</strong> abuse <strong>and</strong> alcoholism certainly involve the contributions<br />
from more than one gene. The exact number of genes that influence<br />
alcoholism is not known.<br />
• In this activity, individuals who have scores of 120 or higher are<br />
considered to be alcohol abusers. By this measure, how many of<br />
the modeled individuals did abuse alcohol?<br />
Results for your class will vary, but the graph should show approximately<br />
10–15 percent of the original population with scores above<br />
120.<br />
• If, in the population, 10–15 percent of alcohol users go on to abuse<br />
alcohol, how many modeled individuals would you expect to be<br />
alcohol abusers?<br />
The answer depends on how many individuals were modeled. For<br />
example, if the class modeled 50 individuals, then you would expect<br />
between 5 <strong>and</strong> 8 scores to be above 120 <strong>and</strong> therefore represent alcohol<br />
abusers.<br />
• Do the results of the modeling activity accurately reflect the statistics<br />
for the population?<br />
The scoring in this activity should yield results that are similar to the<br />
population statistics. However, results from individual classes will<br />
vary. This usually can be attributed to a small sample size. As before,<br />
if you do this activity in several classes, you might wish to pool the<br />
data.<br />
• How does this model accurately reflect the behavior of alcohol use<br />
<strong>and</strong> abuse? How is it inaccurate?<br />
The model is accurate in that it leads to about one-third of the population<br />
abstaining from alcohol use <strong>and</strong> 10 percent of users abusing<br />
alcohol. It also accurately reflects most of the important factors that<br />
influence alcohol use. The model is inaccurate in that it does not<br />
take <strong>into</strong> account interactions among the various factors. For<br />
example, it is not the case that environmental factors play a role only<br />
in the decision to use alcohol <strong>and</strong> not in the decision to abuse it.<br />
The genetic influence on alcohol use is also oversimplified. The<br />
model fails to stress the role that personal choice plays in an individual’s<br />
alcohol consumption.<br />
127<br />
Student Lesson 4
<strong>Underst<strong>and</strong>ing</strong> <strong>Alcohol</strong>: <strong>Investigations</strong> <strong>into</strong> <strong>Biology</strong> <strong>and</strong> <strong>Behavior</strong><br />
Activity 3: Modeling <strong>Alcohol</strong> Abuse <strong>and</strong> <strong>Alcohol</strong>ism<br />
1. Remind students that the die-rolling activity they just completed<br />
models a person’s use or abuse of alcohol. Explain that they will<br />
now complete an activity that models whether a person who<br />
abuses alcohol will go on to become an alcoholic individual.<br />
<strong>Alcohol</strong>ism is a disease characterized by physical dependence on<br />
alcohol. When alcohol use is discontinued, withdrawal symptoms<br />
occur. People who are alcoholic exhibit tolerance, meaning they<br />
need increasing amounts of alcohol to feel <strong>into</strong>xicated. They feel a<br />
strong need or compulsion to drink <strong>and</strong> continue despite adverse<br />
consequences.<br />
Content St<strong>and</strong>ard F:<br />
Students should<br />
develop an underst<strong>and</strong>ing<br />
of personal<br />
health.<br />
2. Invite students to consider factors they think might influence<br />
whether a person continues to abuse alcohol or goes on to suffer<br />
from alcoholism. List their responses on the board.<br />
Students will likely name a variety of things. Try to focus their<br />
responses on the<br />
• presence or absence of a support system,<br />
• ability to control their drinking,<br />
• relative craving for alcohol,<br />
• sensitivity of the brain to alcohol, <strong>and</strong><br />
• genetic risk.<br />
The genetic risk factor refers to genes that place an individual at<br />
increased risk for becoming addicted to alcohol.<br />
3. Remind the class that only individuals who were designated as<br />
alcohol abusers with a score of 120 or higher in Activity 2 will be<br />
used in this activity. Display the transparency of the completed<br />
graph from Master 4.6, Results for Modeling <strong>Alcohol</strong> Abuse, <strong>and</strong> ask<br />
students to recall how many modeled individuals abused alcohol.<br />
4. Draw one stick figure on the board to represent each fictitious individual<br />
who was an alcohol abuser (a score of 120 or higher) from<br />
Activity 2. Assign a number to each fictitious individual. Explain to<br />
students that these drawings represent the alcohol abusers from<br />
Activity 2.<br />
5. Explain that the procedure for this activity will be a little different<br />
from that of the previous activities because of the small number of<br />
fictitious individuals whose behavior is being modeled. Assign students<br />
numbers that correspond to each of the numbered stick figures.<br />
Each student should be assigned two numbers. For example,<br />
one student may be assigned numbers 1 <strong>and</strong> 2, another student<br />
128
assigned numbers 3 <strong>and</strong> 4, <strong>and</strong> so forth. Have students write the<br />
numbers for their assigned fictitious individuals on their copy of<br />
Master 4.7.<br />
This strategy will allow all students to be involved in the activity<br />
even though the number of fictitious individuals is low. Several students<br />
will record data for the same fictitious individuals.<br />
6. Give each student one copy of Master 4.7, Factors Influencing <strong>Alcohol</strong><br />
Abuse <strong>and</strong> <strong>Alcohol</strong>ism.<br />
7. Complete the die rolling as a class. For each fictitious individual,<br />
the die needs to be rolled 5 times. After the first roll, students<br />
record the number in the space provided under “Support system”<br />
on their h<strong>and</strong>out. Likewise, they record the results of rolls 2<br />
through 5 under “Loss of control,” “Craving for alcohol,” “Brain<br />
sensitivity to alcohol,” <strong>and</strong> “Genetic addictive factors.” Have students<br />
take turns performing a single die roll.<br />
8. Display a transparency of Master 4.8, Score Sheet for Modeling<br />
<strong>Alcohol</strong>ism. Instruct students to assign a score for each of the five<br />
categories (for each individual) based on the die roll <strong>and</strong> the values<br />
listed on Master 4.7, Factors Influencing <strong>Alcohol</strong> Abuse <strong>and</strong> <strong>Alcohol</strong>ism.<br />
Instruct students to add the five scores for each individual<br />
to obtain a total score.<br />
Scores will range from 0 to 90 in this activity.<br />
9. Display a transparency of Master 4.9, Results for Modeling <strong>Alcohol</strong>ism.<br />
As before, construct a histogram of the results.<br />
Because the number of individuals being modeled in this activity is<br />
low, the histogram bars will not be very high.<br />
Figure 4.5. Sample<br />
histogram of class<br />
data for modeling<br />
alcohol abuse <strong>and</strong><br />
alcoholism.<br />
129<br />
Student Lesson 4
<strong>Underst<strong>and</strong>ing</strong> <strong>Alcohol</strong>: <strong>Investigations</strong> <strong>into</strong> <strong>Biology</strong> <strong>and</strong> <strong>Behavior</strong><br />
10. Hold a class discussion to analyze the graph <strong>and</strong> interpret the<br />
results of the activity. Lead the discussion with the following questions.<br />
Content St<strong>and</strong>ard A:<br />
Use mathematics in all<br />
aspects of scientific<br />
inquiry.<br />
• If in our society, one-half of alcohol abusers go on to become alcoholic,<br />
how many of the fictitious individuals would you expect to<br />
become alcoholic?<br />
If one-half of alcohol abusers go on to become alcoholic, you can<br />
calculate the predicted number by multiplying the number of individuals<br />
modeled in Activity 3 by 50 percent (0.50).<br />
• If a score of 45 or higher indicates the individual has progressed<br />
from an alcohol abuser to an alcoholic, how many of the fictitious<br />
individuals have progressed to being alcoholic?<br />
Answers will vary. The possible scores for Activity 3 range from 0 to<br />
90. Approximately half of the fictitious individuals modeled will fall<br />
<strong>into</strong> this category.<br />
• Do the data from this activity accurately reflect the statistics from<br />
the population?<br />
The data will vary considerably from class to class. The data collected<br />
in some classes may show no individuals who are alcoholic.<br />
Other classes may have data in which more than the predicted number<br />
of fictitious individuals are alcoholic.<br />
If the data vary greatly from the predicted, you may find this to be an<br />
opportunity to discuss sample size <strong>and</strong> the limitations of a model<br />
such as this. If you are collecting <strong>and</strong> pooling data from several<br />
classes, you can discuss how larger sample sizes are more likely to<br />
match results from a large population of individuals.<br />
• How does the number of individuals classified as alcoholic in this<br />
activity compare with the number of alcohol abusers? to alcohol<br />
users? to the general population?<br />
Students should respond that the number of individuals classified as<br />
alcoholic is smaller than the number of individuals classified as alcohol<br />
abusers <strong>and</strong> is much smaller than the number of individuals in<br />
the initial population modeled in Activity 1.<br />
This is a good opportunity to remind the class that not everyone<br />
who chooses to consume alcohol will develop a drinking problem,<br />
<strong>and</strong> not everyone who abuses alcohol will necessarily become an<br />
alcoholic.<br />
130
• What factors are responsible for the individuals with the highest<br />
risk for alcoholism? (Display the transparency of Master 4.8, Score<br />
Sheet for Modeling <strong>Alcohol</strong>ism, to help students respond to this<br />
question.)<br />
In addition to those factors discussed in Activity 2, students may add<br />
the following:<br />
• a lack of a support system, or the unwillingness of the individual<br />
to use such a system;<br />
• loss of control that leads to heavy drinking;<br />
• a craving for alcohol;<br />
• a brain with a low sensitivity to alcohol that doesn’t set up<br />
blocks to alcohol consumption; <strong>and</strong><br />
• a genetic predisposition toward alcohol addiction.<br />
• How does personal choice influence alcohol use, alcohol abuse,<br />
<strong>and</strong> alcoholism?<br />
Students will list a number of factors <strong>and</strong> ways in which personal<br />
choice is important. Some of these responses may include the<br />
following:<br />
Availability—Even if alcohol is readily available, an individual can<br />
still choose not to use it.<br />
Peer pressure—An individual chooses his/her friends, <strong>and</strong> even<br />
when peers consume alcohol, the individual can still choose to be<br />
different.<br />
Media pressure—Despite the tendency of TV, movies, advertisements,<br />
<strong>and</strong> music to portray alcohol use in a favorable light, an individual<br />
can choose to place these influences in perspective <strong>and</strong> resist<br />
their messages.<br />
Family environment—Families may have positive or negative beliefs<br />
about alcohol use. Likewise, religious views may prohibit alcohol use<br />
or tolerate it in moderation. These views can be followed or resisted.<br />
Legal restrictions—Minors considering alcohol use can choose to<br />
obey or disobey laws that restrict their access to alcohol.<br />
Support system—If individuals realize that they are abusing alcohol,<br />
then they can turn to family or friends for support. If a personal support<br />
system is absent, then individuals can seek professional guidance<br />
<strong>and</strong> counseling. Such a decision can help prevent alcohol abuse<br />
from progressing to alcoholism.<br />
Teacher note<br />
It is important to discuss the issue of personal choice so that students will<br />
not think that the influences modeled in this lesson constitute any individual’s<br />
predetermined fate.<br />
131<br />
Student Lesson 4
<strong>Underst<strong>and</strong>ing</strong> <strong>Alcohol</strong>: <strong>Investigations</strong> <strong>into</strong> <strong>Biology</strong> <strong>and</strong> <strong>Behavior</strong><br />
• What factors might influence alcohol use, alcohol abuse, <strong>and</strong> alcoholism<br />
but do not involve personal choice?<br />
Genetic factors that influence alcohol metabolism, brain sensitivity to<br />
alcohol, <strong>and</strong> risk for alcohol addiction are not under personal control.<br />
Activity 4: Applying the Model<br />
1. Inform students that since they have completed the modeling activities<br />
to examine the range of alcohol use, alcohol abuse, <strong>and</strong> alcoholism<br />
in a small group of fictitious individuals, they will now<br />
explore how this range applies to the U.S. population. Tell students<br />
that there are approximately 200 million people between the<br />
ages of 13 <strong>and</strong> 65 in the United States.<br />
These calculations can be done either by students individually or as<br />
a class.<br />
Content St<strong>and</strong>ard A:<br />
Use mathematics in all<br />
aspects of scientific<br />
inquiry.<br />
• If 33 percent of the population does not use alcohol, how many<br />
individuals do not use alcohol?<br />
200 million x 0.33 = 66 million people do not use alcohol<br />
• If 67 percent of the population uses alcohol, how many individuals<br />
use alcohol?<br />
200 million x 0.67 = 134 million people use alcohol<br />
• If 10 percent of alcohol users will become alcohol abusers, how<br />
many individuals are alcohol abusers?<br />
134 million x 0.10 = 13.4 million people abuse alcohol<br />
• If 50 percent of alcohol abusers will become alcoholic, how many<br />
individuals are alcoholics?<br />
13.4 million x 0.50 = 6.7 million alcoholics<br />
2. Display the transparency of Master 4.10, When Is <strong>Alcohol</strong> Use a Problem?<br />
Read over the transparency with the students. Explain that<br />
these simple questions screen for possible alcohol abuse or alcoholism.<br />
If a potential problem is identified, such an individual should<br />
see a doctor who has the training to more accurately diagnose the<br />
individual for alcoholism. Remind students that individuals diagnosed<br />
with alcoholism have options for achieving <strong>and</strong> maintaining a<br />
full recovery. Furthermore, all individuals, even those susceptible to<br />
alcoholism, have the option of choosing not to start drinking alcohol.<br />
132
Figure 4.6. Distribution<br />
of alcohol<br />
nonusers, users,<br />
abusers, <strong>and</strong> alcoholics<br />
among Americans aged<br />
13 to 65.<br />
There is no simple test to identify someone with a drinking problem.<br />
However, honest answers to the four questions shown on Master<br />
4.10 can help an individual decide whether a problem is likely to<br />
exist. To make the questions easier to remember, they have been<br />
written in such a way that the first letter of a key word in each question<br />
spells “CAGE.”<br />
1. Have you ever felt that you should Cut down on your drinking?<br />
2. Have people Annoyed you by criticizing your drinking?<br />
3. Have you ever felt bad or Guilty about your drinking?<br />
4. Have you ever had a drink first thing in the morning to steady your<br />
nerves or to get rid of a hangover (Eye opener)?<br />
Source: National Institute on <strong>Alcohol</strong> Abuse <strong>and</strong> <strong>Alcohol</strong>ism 1996. <strong>Alcohol</strong>ism: getting<br />
the facts. Bethesda, MD: NIAAA.<br />
A “yes” answer to one of these questions may suggest that a drinking<br />
problem exists, while more than one “yes” response is highly indicative<br />
of a problem. Even if a person answers “no” to these four questions,<br />
an alcohol problem can still exist.<br />
If not brought up by the class, mention that molecular modeling also<br />
has many uses.<br />
Assessment:<br />
To evaluate students’<br />
underst<strong>and</strong>ing of modeling,<br />
ask them to provide<br />
other examples of<br />
scientific models <strong>and</strong><br />
to explain what types<br />
of information scientists<br />
can get from<br />
these examples. Students<br />
will likely mention<br />
models of the<br />
weather <strong>and</strong> of<br />
ecosystems. Students<br />
may also mention that<br />
scientists use animals<br />
as models to learn<br />
about humans. They<br />
may refer to the studies<br />
they analyzed in<br />
Lesson 3.<br />
133<br />
Student Lesson 4
<strong>Underst<strong>and</strong>ing</strong> <strong>Alcohol</strong>: <strong>Investigations</strong> <strong>into</strong> <strong>Biology</strong> <strong>and</strong> <strong>Behavior</strong><br />
Lesson 4 Organizer<br />
Activity 1: To Drink or Not to Drink<br />
What the Teacher Does<br />
Have students reflect on the simulations of mice behavior in<br />
response to alcohol.<br />
Ask the class what factors influence an individual’s decision<br />
whether to drink alcohol. Sort their answers <strong>into</strong> the following<br />
categories:<br />
• Availability<br />
• Family environment<br />
• Peer pressure<br />
• Media pressure<br />
• Legal restrictions<br />
Explain that students will roll dice to model whether fictitious<br />
individuals will drink alcohol.<br />
Pass out to each student one die <strong>and</strong> a copy of Master<br />
4.1, Environmental Factors Influencing <strong>Alcohol</strong> Use <strong>and</strong><br />
Nonuse.<br />
Have students complete their rolls <strong>and</strong> record data for each<br />
of their modeled individuals.<br />
• Have students assign scores using Master 4.2, Score<br />
Sheet for Modeling <strong>Alcohol</strong> Use.<br />
Summarize the results by constructing a histogram using<br />
data from the entire class on Master 4.3, Results for<br />
Modeling <strong>Alcohol</strong> Use.<br />
Procedure Reference<br />
Page 119<br />
Step 1<br />
Pages 119–120<br />
Steps 2 <strong>and</strong> 3<br />
Page 120<br />
Step 4<br />
Page 120<br />
Step 5<br />
Page 121<br />
Steps 6 <strong>and</strong> 7<br />
Pages 121–122<br />
Step 8<br />
= Involves copying a master. = Involves using a transparency.<br />
134
Have students interpret the graph. Ask,<br />
• How are the scores distributed?<br />
• What do low scores represent?<br />
• What factors contribute to low scores?<br />
• Does this distribution accurately model alcohol use in a<br />
population?<br />
• How many individuals have scores of 15 or less?<br />
• According to the Surgeon General, about 33 percent of<br />
the population report that they do not drink alcohol.<br />
Predict how many individuals in this activity would not<br />
drink alcohol.<br />
• Is this number higher or lower than expected?<br />
Pages 122–123<br />
Steps 9 <strong>and</strong> 10<br />
Activity 2: Modeling <strong>Alcohol</strong> Use <strong>and</strong> Abuse<br />
What the Teacher Does<br />
Ask the class to recall their conclusions from Lesson 3 about<br />
how different mice respond to alcohol.<br />
Explain that students now will roll dice to model alcohol use<br />
<strong>and</strong> abuse in their fictitious individuals. Display a transparency<br />
of Master 4.4, Modeling Genetic Influence, <strong>and</strong> give<br />
each student a copy of Master 4.5, Factors Influencing <strong>Alcohol</strong><br />
Use <strong>and</strong> Abuse.<br />
Have students complete their rolls, record data on Master<br />
4.5, <strong>and</strong> compute scores for each modeled individual.<br />
Summarize results of the activity by constructing a histogram<br />
using data from the entire class on Master 4.6, Results for<br />
Modeling <strong>Alcohol</strong> Abuse.<br />
Procedure Reference<br />
Page 124<br />
Steps 1–3<br />
Page 124<br />
Step 4<br />
Pages 124–125<br />
Steps 5 <strong>and</strong> 6<br />
Pages 125–126<br />
Step 7<br />
135<br />
Student Lesson 4
<strong>Underst<strong>and</strong>ing</strong> <strong>Alcohol</strong>: <strong>Investigations</strong> <strong>into</strong> <strong>Biology</strong> <strong>and</strong> <strong>Behavior</strong><br />
Have students interpret the graph. Ask,<br />
• How are the scores distributed?<br />
• What factors contribute to alcohol abuse? (Explain that<br />
this activity assumes that only two genes contribute to<br />
alcohol use.)<br />
• If individuals with scores of 120 or higher are considered<br />
to abuse alcohol, then how many modeled individuals<br />
are abusers?<br />
• If in the population, 10–15 percent of alcohol users go<br />
on to abuse alcohol, then how many modeled individuals<br />
would you expect to be alcohol abusers?<br />
• Is the number of modeled alcohol abusers higher or<br />
lower than expected?<br />
• How does the model accurately reflect the behavior of<br />
alcohol use <strong>and</strong> abuse? How is it inaccurate?<br />
Pages 126–127<br />
Step 8<br />
Activity 3: Modeling <strong>Alcohol</strong> Abuse <strong>and</strong> <strong>Alcohol</strong>ism<br />
What the Teacher Does<br />
Explain that the class will now model whether an alcohol<br />
abuser will go on to become an alcoholic individual.<br />
Challenge the class to list reasons that might influence<br />
whether an alcohol abuser will develop alcoholism.<br />
Explain that individuals with scores of 120 or higher in the<br />
previous activity are alcohol abusers <strong>and</strong> will be modeled in<br />
this activity. Display the transparency of the completed<br />
graph from Master 4.6.<br />
Assign each student two of the alcohol abusers to model,<br />
<strong>and</strong> explain the procedure.<br />
Pass out to each student a copy of Master 4.7, Factors<br />
Influencing <strong>Alcohol</strong> Abuse <strong>and</strong> <strong>Alcohol</strong>ism.<br />
Procedure Reference<br />
Page 128<br />
Step 1<br />
Page 128<br />
Step 2<br />
Page 128<br />
Step 3<br />
Pages 128–129<br />
Steps 4 <strong>and</strong> 5<br />
Page 129<br />
Step 6<br />
136
Have students complete their rolls, record data, <strong>and</strong> compute<br />
scores for each modeled individual based on Master<br />
4.8, Score Sheet for Modeling <strong>Alcohol</strong>ism.<br />
Summarize results of the activity by constructing a histogram<br />
using data from the entire class on Master 4.9,<br />
Results for Modeling <strong>Alcohol</strong>ism.<br />
Have students interpret the graph. Ask,<br />
• If one-half of alcohol abusers go on to become alcoholic,<br />
then how many of the modeled individuals<br />
would be expected to become alcoholic?<br />
• If a score of 45 or higher indicates that an individual<br />
becomes alcoholic, then how many of the modeled<br />
individuals became alcoholic?<br />
• Do the data from this activity reflect the statistics from<br />
the population?<br />
• How does the number of individuals classified as alcoholic<br />
in this activity compare to the number of alcohol<br />
abusers? To alcohol users? To the general population?<br />
• What factors contribute to high risk for alcoholism?<br />
• How does personal choice influence alcohol use, alcohol<br />
abuse, <strong>and</strong> alcoholism?<br />
• What factors might influence alcohol use, alcohol abuse,<br />
<strong>and</strong> alcoholism but do not involve personal choice?<br />
Page 129<br />
Steps 7 <strong>and</strong> 8<br />
Page 129<br />
Step 9<br />
Pages 130–132<br />
Step 10<br />
Activity 4: Applying the Model<br />
What the Teacher Does<br />
Have the class apply the statistics for alcohol use, alcohol<br />
abuse, <strong>and</strong> alcoholism from the model to the U.S. population.<br />
Have the class read Master 4.10, When Is <strong>Alcohol</strong> Use a<br />
Problem?<br />
• Discuss choice as it applies to drinking alcohol <strong>and</strong> the<br />
options available to those with drinking problems.<br />
Procedure Reference<br />
Page 132<br />
Step 1<br />
Pages 132–133<br />
Step 2<br />
137<br />
Student Lesson 4
Environmental Factors<br />
Influencing <strong>Alcohol</strong> Use <strong>and</strong> Nonuse<br />
Name ________________________<br />
Date _____________________<br />
FICTITIOUS INDIVIDUAL #1<br />
Availability factor Die roll _____ Score _____<br />
Family environment factor Die roll _____ Score _____<br />
Peer pressure factor Die roll _____ Score _____<br />
Media pressure factor Die roll _____ Score _____<br />
Legal restriction factor Die roll _____ Score _____<br />
Add scores together for total score _____<br />
FICTITIOUS INDIVIDUAL #2<br />
Availability factor Die roll _____ Score _____<br />
Family environment factor Die roll _____ Score _____<br />
Peer pressure factor Die roll _____ Score _____<br />
Media pressure factor Die roll _____ Score _____<br />
Legal restriction factor Die roll _____ Score _____<br />
Add scores together for total score _____<br />
Master 4.1
Score Sheet for<br />
Modeling <strong>Alcohol</strong> Use<br />
AVAILABILITY FACTOR<br />
Number on die Score Effect<br />
Even 0 <strong>Alcohol</strong> not available<br />
Odd 5 <strong>Alcohol</strong> available<br />
FAMILY ENVIRONMENT FACTOR<br />
Number on die Score Effect<br />
Even 0 <strong>Alcohol</strong> use discouraged<br />
Odd 10 <strong>Alcohol</strong> use not discouraged<br />
PEER PRESSURE FACTOR<br />
Number on die Score Effect<br />
1 or 2 0 Peers don’t use alcohol<br />
3 or 4 5 Some peers use alcohol<br />
5 or 6 10 Most peers use alcohol<br />
MEDIA PRESSURE FACTOR<br />
Number on die Score Effect<br />
1 or 2 0 Little influence to use alcohol<br />
3 or 4 5 Moderate influence to use alcohol<br />
5 or 6 10 Strong influence to use alcohol<br />
LEGAL RESTRICTION FACTOR<br />
Number on die Score Effect<br />
Even 0 Choose to obey laws<br />
Odd 10 Choose to disobey laws<br />
Master 4.2
Results for Modeling <strong>Alcohol</strong> Use<br />
Master 4.3
Modeling Genetic Influence<br />
To model the genetic influence for an individual, follow the instructions below.<br />
This information is summarized in the accompanying table.<br />
1. Roll the die. If an odd number turns up, then the genetic influence factor<br />
is 1. Do not roll again. If an even number turns up, then assign a value of<br />
2 <strong>and</strong> roll again.<br />
2. Roll the die a second time. If an odd number turns up, then assign a<br />
value of 1 <strong>and</strong> multiply the values of the two rolls to obtain the genetic<br />
influence factor:<br />
2 (first roll) x 1 (second roll) = 2 = genetic influence factor<br />
If an even number turns up, then assign a value of 2 <strong>and</strong> multiply the<br />
values of the two rolls to obtain the genetic influence factor:<br />
2 (first roll) x 2 (second roll) = 4 = genetic influence factor<br />
Roll of die Number on die Outcome<br />
First roll Odd Genetic influence factor = 1<br />
First roll Even Roll again<br />
Second roll Odd Genetic influence factor = 2<br />
Second roll Even Genetic influence factor = 4<br />
3. Record genetic influence factor on Master 4.5, Factors Influencing <strong>Alcohol</strong><br />
Use <strong>and</strong> Abuse.<br />
Master 4.4
Factors Influencing<br />
<strong>Alcohol</strong> Use <strong>and</strong> Abuse<br />
Name ________________________<br />
Date _____________________<br />
FICTITIOUS INDIVIDUAL #1<br />
Environmental factors (total score from Master 4.1):<br />
Genetic influence factor<br />
_____<br />
_____<br />
Multiply environmental factors times genetic influence factor to get total score:<br />
Environmental factors x genetic influence factor =<br />
______ total score<br />
FICTITIOUS INDIVIDUAL #2<br />
Environmental factors (total score from Master 4.1):<br />
Genetic influence factor<br />
_____<br />
_____<br />
Multiply environmental factors times genetic influence factor to get total score:<br />
Environmental factors x genetic influence factor =<br />
______ total score<br />
Master 4.5
Results for Modeling <strong>Alcohol</strong> Abuse<br />
Master 4.6
Factors Influencing<br />
<strong>Alcohol</strong> Abuse <strong>and</strong> <strong>Alcohol</strong>ism<br />
Name ________________________<br />
Date _____________________<br />
FICTITIOUS INDIVIDUAL # ___<br />
Support system Die roll _____ Score _____<br />
Loss of control Die roll _____ Score _____<br />
Craving for alcohol Die roll_____ Score _____<br />
Brain sensitivity to alcohol Die roll _____ Score _____<br />
Genetic addictive factors Die roll _____ Score _____<br />
Add together for total score _____<br />
Master 4.7
Score Sheet for<br />
Modeling <strong>Alcohol</strong>ism<br />
SUPPORT SYSTEM<br />
Number on die Score Effect<br />
1 or 2 0 Has been counseled for abuse<br />
3 or 4 20 No abusers among family <strong>and</strong> peers<br />
5 or 6 40 Associates with abusers<br />
LOSS OF CONTROL<br />
Number on die Score Effect<br />
Even 0 Can control drinking<br />
Odd 10 Cannot control drinking<br />
CRAVING FOR ALCOHOL<br />
Number on die Score Effect<br />
Even 0 No craving for alcohol<br />
Odd 10 Craving for alcohol<br />
BRAIN SENSITIVITY TO ALCOHOL<br />
Number on die Score Effect<br />
Even 0 High sensitivity to alcohol<br />
Odd 10 Low sensitivity to alcohol<br />
GENETIC ADDICTIVE FACTORS<br />
Number on die Score Effect<br />
Even 0 No genetic addictive factors present<br />
Odd 20 Genetic addictive factors present<br />
Master 4.8
Results for Modeling <strong>Alcohol</strong>ism<br />
Master 4.9
When Is <strong>Alcohol</strong> Use a Problem?<br />
Honest answers to the following four questions can help identify a<br />
potential drinking problem. A “yes” answer to one of the questions<br />
may suggest that a drinking problem exists, while more than one “yes”<br />
answer suggests that a drinking problem likely exists. The questions<br />
are written in such a way that the first letter of a key word in each<br />
question spells “CAGE.”<br />
1. Have you ever felt that you should Cut down on your drinking?<br />
2. Have people Annoyed you by criticizing your drinking?<br />
3. Have you ever felt bad or Guilty about your drinking?<br />
4. Have you ever had a drink first thing in the morning to steady your<br />
nerves or to get rid of a hangover (Eye opener)?<br />
Source: National Institute on <strong>Alcohol</strong> Abuse <strong>and</strong> <strong>Alcohol</strong>ism. 1996. <strong>Alcohol</strong>ism: getting<br />
the facts. Bethesda, MD: NIAAA.<br />
Master 4.10
<strong>Alcohol</strong> <strong>and</strong> Driving:<br />
When to Say y No<br />
Lesson 5<br />
Elaborate<br />
Figure 5.1. Police administer sobriety<br />
tests to help keep drivers under<br />
the influence of alcohol off the road.<br />
Overview<br />
Students investigate how drinking alcoholic beverages affects the blood<br />
alcohol concentration (BAC). They then explore how gender, body weight,<br />
metabolism, <strong>and</strong> drinking patterns change BAC. Finally, students watch<br />
driving simulations in a Web-based activity <strong>and</strong> consider how mental <strong>and</strong><br />
physical functions are impaired by drinking alcohol.<br />
At a Glance<br />
Major Concepts<br />
<strong>Alcohol</strong> impairs the functions of the mind <strong>and</strong> body. These impairments<br />
depend on the amount of alcohol in the blood, as measured by the blood<br />
alcohol concentration. Factors that influence the BAC include the number<br />
of drinks <strong>and</strong> the time period over which they are consumed, as well as<br />
the drinker’s gender <strong>and</strong> body weight. The body breaks down, or metabolizes,<br />
alcohol at a relatively constant rate, regardless of the rate at which it<br />
is consumed.<br />
149
<strong>Underst<strong>and</strong>ing</strong> <strong>Alcohol</strong>: <strong>Investigations</strong> <strong>into</strong> <strong>Biology</strong> <strong>and</strong> <strong>Behavior</strong><br />
Objectives<br />
After completing this lesson, students will<br />
• be able to explain how the number of drinks, the pattern of drinking,<br />
the individual’s gender, <strong>and</strong> the individual’s body weight influence<br />
the BAC;<br />
• underst<strong>and</strong> that metabolism breaks down alcohol at a constant rate,<br />
regardless of the rate at which it is consumed; <strong>and</strong><br />
• be able to correlate different blood alcohol concentrations with<br />
impairments in body function.<br />
Teacher Background<br />
Consult the following sections in Information about <strong>Alcohol</strong>:<br />
5 <strong>Alcohol</strong>: Pharmacokinetics (page 28)<br />
5.1 Absorption <strong>and</strong> distribution of alcohol in the body (page 29)<br />
5.2 Measurement of blood alcohol concentration (BAC) (page 29)<br />
5.3 Factors affecting alcohol absorption <strong>and</strong> elimination (pages 29–30)<br />
5.4 <strong>Alcohol</strong> metabolism (pages 30–31)<br />
6 <strong>Alcohol</strong>: Biological Effects (page 31)<br />
6.1 <strong>Alcohol</strong> <strong>and</strong> the brain (pages 31–35)<br />
6.2 <strong>Alcohol</strong> <strong>and</strong> body systems (pages 35–37)<br />
10.2 Drinking <strong>and</strong> driving (pages 42–43)<br />
In Advance<br />
Web-Based Activities<br />
Activity<br />
1<br />
2<br />
Web Version?<br />
No<br />
Yes<br />
Photocopies<br />
Activity 1<br />
Activity 2<br />
Master 5.1, Blood <strong>Alcohol</strong> Concentration Tables (Make 1<br />
copy per student <strong>and</strong> prepare an overhead transparency.)<br />
Master 5.2, Drinking Patterns for Party Guests (Make 1<br />
copy per student team.)<br />
Master 5.3, Blood <strong>Alcohol</strong> Concentration Graph Template<br />
(Make 1 copy per student team <strong>and</strong> prepare an overhead<br />
transparency.)<br />
Master 5.4, Progressive Effects of <strong>Alcohol</strong> (Make 1 copy per<br />
student team <strong>and</strong> prepare an overhead transparency.)<br />
150
Materials<br />
Activity 1<br />
Activity 2<br />
colored pencils<br />
computers with Internet access <strong>and</strong> sound card<br />
Preparation<br />
Gather supplies needed for the activities.<br />
Arrange for access to computers.<br />
Test the Internet connection <strong>and</strong> set up the appropriate bookmark to<br />
http://science.education.nih.gov/supplements/alcohol/student.<br />
Students will need copies of Master 5.1, Blood <strong>Alcohol</strong> Concentration Tables,<br />
<strong>and</strong> Master 5.4, Progressive Effects of <strong>Alcohol</strong>, during Lesson 6.<br />
Activity 1: Patterns of Drinking<br />
Procedure<br />
1. Introduce the activity by creating a scenario for students. If two<br />
individuals attend a party <strong>and</strong> drink the same amount of alcohol,<br />
will they be affected in the same way? Ask students to share the<br />
reasons for their responses.<br />
Students will respond that not all people react the same way to<br />
drinking the same amount of alcohol. Continue the discussion by<br />
asking the class to name factors that influence the extent to which a<br />
person is affected by drinking an alcoholic beverage. Accept all reasonable<br />
responses <strong>and</strong> list them on the board. Make sure that drinking<br />
pattern (whether the alcohol is consumed all at once or spread<br />
out over a long period of time) is mentioned.<br />
2. Inform students that they will investigate how drinking affects<br />
people differently. First, they need to recall some information from<br />
previous lessons. Review with the students what happens to alcohol<br />
after it has been consumed <strong>and</strong> what factors help determine an<br />
individual’s response to alcohol.<br />
As they learned in Lesson 2, students should mention that the alcohol<br />
is carried throughout the body <strong>and</strong> is quickly absorbed from the<br />
stomach <strong>and</strong> small intestine <strong>into</strong> the bloodstream. If necessary,<br />
remind the class that alcohol distributes throughout the water-containing<br />
parts of the body <strong>and</strong> that the brain is especially sensitive to<br />
its effects. Students should recall from Lesson 3 that the amount of<br />
alcohol consumed, the time after consumption, <strong>and</strong> the genetic<br />
background of the individual are important factors in determining an<br />
individual’s response to drinking alcohol.<br />
151<br />
Student Lesson 5
<strong>Underst<strong>and</strong>ing</strong> <strong>Alcohol</strong>: <strong>Investigations</strong> <strong>into</strong> <strong>Biology</strong> <strong>and</strong> <strong>Behavior</strong><br />
Assessment:<br />
The discussion in Steps<br />
1 <strong>and</strong> 2 provides an<br />
opportunity to evaluate<br />
what students recall<br />
from earlier lessons in<br />
the module. For<br />
example, do they recall<br />
that a 12-ounce beer<br />
contains the same<br />
amount of alcohol as<br />
5 ounces of wine <strong>and</strong><br />
1.5 ounces of hard<br />
liquor? Do they underst<strong>and</strong><br />
that alcohol is<br />
absorbed <strong>into</strong> the<br />
bloodstream <strong>and</strong> is distributed<br />
throughout the<br />
body? Can students<br />
explain that an individual’s<br />
response to alcohol<br />
depends on factors<br />
such as the amount of<br />
alcohol consumed, the<br />
time after consumption,<br />
<strong>and</strong> individual genetic<br />
variation?<br />
Figure 5.2. Once consumed,<br />
alcohol is absorbed through<br />
the stomach (1) <strong>and</strong> small<br />
intestine <strong>and</strong> enters the<br />
bloodstream (2), which distributes<br />
the alcohol to other<br />
parts of the body, including<br />
the brain (3).<br />
3. Give each student a copy of Master 5.1, Blood <strong>Alcohol</strong> Concentration<br />
Tables. Explain that the concentration of alcohol in the blood<br />
is expressed as weight of alcohol in a specific volume of blood. In<br />
the United States, the measure is grams of alcohol per 100 milliliters<br />
of blood, <strong>and</strong> it is reported as a percent. For example, 0.05 grams of<br />
alcohol in 100 milliliters of blood corresponds to a blood alcohol<br />
concentration (BAC) of 0.05 percent. Help students underst<strong>and</strong><br />
how to read the BAC tables by providing an example using the<br />
transparency of Master 5.1, such as what would the BAC be for a<br />
120-pound female who consumes two alcoholic drinks in an hour?<br />
If students look at the column for 120 pounds (third column from<br />
the left in the table for women at the top of Master 5.1) <strong>and</strong> read<br />
down to the row for 2 drinks, the BAC would be 0.08 percent.<br />
Blood <strong>Alcohol</strong> Concentration Table: For Women<br />
Body weight in pounds<br />
Drinks 100 120 140 160 180 200 220 240<br />
per hour<br />
1 0.05 0.04 0.03 0.03 0.03 0.02 0.02 0.02<br />
2 0.09 0.08 0.07 0.06 0.05 0.05 0.04 0.04<br />
3 0.14 0.11 0.10 0.09 0.08 0.07 0.06 0.06<br />
152
4. Ask the class what happens to a person’s BAC after it reaches the<br />
value listed in the table. After you establish that the BAC gradually<br />
declines, ask the class why this occurs.<br />
Make sure the discussion brings out the fact that the BAC declines<br />
slowly as the body breaks down the alcohol.<br />
5. After you are sure that the students underst<strong>and</strong> how to read the<br />
tables in Master 5.1, divide the class <strong>into</strong> teams of three students.<br />
Continue to set the stage for the activity by explaining that students<br />
will be analyzing BACs for fictitious individuals who attend<br />
a party where alcoholic beverages are being served. The task for<br />
the students is to determine each individual’s BAC <strong>and</strong> decide<br />
whether the individual can legally drive home.<br />
6. Ask the class how they will determine whether the individuals are<br />
sober enough to drive a car legally.<br />
Students may respond that the BAC measurement is used to determine<br />
whether a person is driving while <strong>into</strong>xicated. Students also<br />
may respond that certain behavioral changes, such as stumbling, loss<br />
of coordination, <strong>and</strong> so forth, would indicate when a person should<br />
not drive.<br />
7. Pass out to each student team a copy of Master 5.2, Drinking Patterns<br />
for Party Guests. Explain that the master consists of three<br />
pages with data for two different party guests on each page. Each<br />
team member should take one page <strong>and</strong> analyze the data for those<br />
two individuals. Explain that they are to use the Blood <strong>Alcohol</strong><br />
Concentration Tables (Master 5.1) to determine the BAC for each<br />
hour that the guest attends the party.<br />
It is a good idea to work through the following example to acquaint<br />
the students with the process.<br />
A. During the first hour of the party, a 120-pound female drinks 2<br />
drinks. She has not had any alcohol to drink before the party<br />
started, so her BAC at the start of the hour is 0.00.<br />
B. From the table on Master 5.1, 2 drinks would give her a BAC of<br />
0.08.<br />
C. Adding 0.08 to 0.00 equals 0.08, which would be recorded in the<br />
fifth row of the chart [BAC (start + table)].<br />
153<br />
Student Lesson 5
<strong>Underst<strong>and</strong>ing</strong> <strong>Alcohol</strong>: <strong>Investigations</strong> <strong>into</strong> <strong>Biology</strong> <strong>and</strong> <strong>Behavior</strong><br />
D. Next, subtract 0.02 from 0.08 to account for the body breaking<br />
down some of the alcohol.<br />
E. This means that at the end of the hour the BAC is 0.06. Record<br />
this value both as the BAC at the end of hour 1 <strong>and</strong> also as the<br />
BAC at the start of hour 2.<br />
F. The female drinks 1 drink during the second hour. Again referring<br />
to the BAC table, this means that 0.04 is added to her existing<br />
0.06 BAC, yielding 0.10.<br />
Content St<strong>and</strong>ard A:<br />
Mathematics is important<br />
in all aspects of<br />
scientific inquiry.<br />
G. Subtracting 0.02 for breakdown during the second hour leaves<br />
her with a BAC of 0.08. This process is repeated to obtain the<br />
BACs for the next two hours.<br />
This guest is a 120-pound female:<br />
Hour 1 2<br />
Number of drinks 2 1<br />
BAC at start of hour A. 0.00 E. 0.06<br />
BAC from table B. 0.08 0.04<br />
BAC (start + table) C. 0.08 F. 0.10<br />
<strong>Alcohol</strong> processed D. –0.02 –0.02<br />
BAC at end of hour E. 0.06 G. 0.08<br />
8. While the students are calculating their party guest’s BACs, pass<br />
out to each team a copy of Master 5.3, Blood <strong>Alcohol</strong> Concentration<br />
Graph Template. Ask students to graph their results for each individual<br />
for the four-hour duration of the party on the same graph.<br />
Students can use a different colored pencil for each individual’s<br />
data. Each team member should graph the data that he or she analyzed.<br />
Teacher note<br />
For this activity, students should assume that the legal BAC limit is<br />
0.08 percent. We selected this value because many states have set this as<br />
the legal st<strong>and</strong>ard. However, if the legal BAC limit in your state is different<br />
(0.10 percent, for example), you may use this value instead. This may<br />
change the conclusions made for the different individuals portrayed in the<br />
activity.<br />
154
9. After the teams have finished analyzing <strong>and</strong> graphing their data,<br />
ask them to share their results with the class. Display a transparency<br />
of Master 5.3, Blood <strong>Alcohol</strong> Concentration Graph Template,<br />
<strong>and</strong> have different students plot the data for the six different party<br />
guests.<br />
The completed charts <strong>and</strong> graphs for the six party guests are shown<br />
below.<br />
Guest 1 is a 120-pound female:<br />
Content St<strong>and</strong>ard A:<br />
Communicate scientific<br />
procedures <strong>and</strong><br />
explanations.<br />
Hour 1 2 3 4<br />
Number of drinks 2 1 1 0<br />
BAC at start of hour 0.00 0.06 0.08 0.10<br />
BAC from table 0.08 0.04 0.04 0.00<br />
BAC (start + table) 0.08 0.10 0.12 0.10<br />
<strong>Alcohol</strong> broken down –0.02 –0.02 –0.02 –0.02<br />
BAC at end of hour 0.06 0.08 0.10 0.08<br />
Figure 5.3. BAC over time for Guest 1.<br />
155<br />
Student Lesson 5
<strong>Underst<strong>and</strong>ing</strong> <strong>Alcohol</strong>: <strong>Investigations</strong> <strong>into</strong> <strong>Biology</strong> <strong>and</strong> <strong>Behavior</strong><br />
Guest 2 is a 180-pound male:<br />
Hour 1 2 3 4<br />
Number of drinks 2 2 1 0<br />
BAC at start of hour 0.00 0.02 0.04 0.04<br />
BAC from table 0.04 0.04 0.02 0.00<br />
BAC (start + table) 0.04 0.06 0.06 0.04<br />
<strong>Alcohol</strong> broken down –0.02 –0.02 –0.02 –0.02<br />
BAC at end of hour 0.02 0.04 0.04 0.02<br />
Figure 5.4. BAC over time for Guest 2.<br />
156
Guest 3 is a 160-pound female:<br />
Hour 1 2 3 4<br />
Number of drinks 3 2 0 0<br />
BAC at start of hour 0.00 0.07 0.11 0.09<br />
BAC from table 0.09 0.06 0.00 0.00<br />
BAC (start + table) 0.09 0.13 0.11 0.09<br />
<strong>Alcohol</strong> broken down –0.02 –0.02 –0.02 –0.02<br />
BAC at end of hour 0.07 0.11 0.09 0.07<br />
Figure 5.5. BAC over time for Guest 3.<br />
157<br />
Student Lesson 5
<strong>Underst<strong>and</strong>ing</strong> <strong>Alcohol</strong>: <strong>Investigations</strong> <strong>into</strong> <strong>Biology</strong> <strong>and</strong> <strong>Behavior</strong><br />
Guest 4 is a 160-pound male:<br />
Hour 1 2 3 4<br />
Number of drinks 0 0 3 2<br />
BAC at start of hour 0.00 0.00 0.00 0.05<br />
BAC from table 0.00 0.00 0.07 0.05<br />
BAC (start + table) 0.00 0.00 0.07 0.10<br />
<strong>Alcohol</strong> broken down 0.00 0.00 –0.02 –0.02<br />
BAC at end of hour 0.00 0.00 0.05 0.08<br />
Figure 5.6. BAC over time for Guest 4.<br />
158
Guest 5 is a 140-pound male:<br />
Hour 1 2 3 4<br />
Number of drinks 3 2 1 0<br />
BAC at start of hour 0.00 0.06 0.09 0.10<br />
BAC from table 0.08 0.05 0.03 0.00<br />
BAC (start + table) 0.08 0.11 0.12 0.10<br />
<strong>Alcohol</strong> broken down –0.02 –0.02 –0.02 –0.02<br />
BAC at end of hour 0.06 0.09 0.10 0.08<br />
Figure 5.7. BAC over time for Guest 5.<br />
159<br />
Student Lesson 5
<strong>Underst<strong>and</strong>ing</strong> <strong>Alcohol</strong>: <strong>Investigations</strong> <strong>into</strong> <strong>Biology</strong> <strong>and</strong> <strong>Behavior</strong><br />
Guest 6 is a 220-pound male:<br />
Hour 1 2 3 4<br />
Number of drinks 3 2 1 0<br />
BAC at start of hour 0.00 0.03 0.04 0.04<br />
BAC from table 0.05 0.03 0.02 0.00<br />
BAC (start + table) 0.05 0.06 0.06 0.04<br />
<strong>Alcohol</strong> broken down –0.02 –0.02 –0.02 –0.02<br />
BAC at end of hour 0.03 0.04 0.04 0.02<br />
Figure 5.8. BAC over time for Guest 6.<br />
160
10. Conclude the activity by asking students to respond to the following<br />
questions.<br />
• Which individuals could drive home legally?<br />
If the legal BAC limit in the state is 0.08 percent, Guests 2, 3, <strong>and</strong> 6<br />
would be below the legal limit for <strong>into</strong>xication <strong>and</strong> able to drive<br />
home legally. Note that if an individual’s BAC is right at the legal<br />
limit (BAC = 0.08 in this case), it is not legal for that individual to<br />
drive a car.<br />
Although these individuals could legally drive, they might not be<br />
safe drivers. In the following activity, students will learn more about<br />
how even low BACs can impair judgment, coordination, <strong>and</strong><br />
reflexes.<br />
• What factors described in this activity affected the party guests’<br />
BAC levels?<br />
Students should recognize that number of drinks, pattern of drinking,<br />
gender, <strong>and</strong> body weight all influence a person’s BAC.<br />
• Why, on average, is a larger person affected less by a given amount<br />
of alcohol than a smaller person?<br />
A larger person has more body water for the alcohol to be distributed<br />
in. This means that a given amount of alcohol will reach a lower<br />
BAC in a large person than a smaller person.<br />
• Why, on average, are females more affected by drinking the same<br />
amount of alcohol as males?<br />
Females tend to be affected more by a given amount of alcohol than<br />
males for two reasons. First, they tend to be smaller than their male<br />
counterparts <strong>and</strong> second, they tend to have more body fat than males<br />
do, which has the effect of reducing the amount of body water in<br />
which to distribute the alcohol.<br />
• How does the pattern of drinking relate to an individual’s BAC?<br />
A person’s BAC is affected mainly by how much alcohol he or she<br />
drinks <strong>and</strong> over what period of time the drinking occurs. <strong>Alcohol</strong><br />
metabolism occurs at a constant rate. If the rate of alcohol consumption<br />
is faster than the body’s metabolism rate, then the BAC will<br />
increase.<br />
161<br />
Student Lesson 5
<strong>Underst<strong>and</strong>ing</strong> <strong>Alcohol</strong>: <strong>Investigations</strong> <strong>into</strong> <strong>Biology</strong> <strong>and</strong> <strong>Behavior</strong><br />
• Are there differences in how fast alcohol breaks down in the body<br />
among different individuals?<br />
Students should notice that in this activity, the BAC always decreases<br />
by approximately 0.02 percent per hour for all individuals. In reality,<br />
metabolism rates can vary somewhat among individuals. The important<br />
point here is that when a person drinks alcohol, it is broken<br />
down at a constant rate, regardless of how quickly or slowly the person<br />
drinks.<br />
• Do you think that each of the individuals whose behavior was<br />
modeled in this activity would have reached the same conclusions<br />
as you did about who should drive from the party?<br />
The guests attending the party in this activity would not have access<br />
to information about their BACs. Therefore, it is likely that some of<br />
them would have judged themselves fit to drive, even though their<br />
BAC exceeded the legal limit.<br />
• Are there any factors not taken <strong>into</strong> account during this activity<br />
that could influence an individual’s BAC?<br />
Student responses will vary. Accept all reasonable responses <strong>and</strong> list<br />
them on the board. Direct their attention to factors such as the<br />
amount <strong>and</strong> type of food in the stomach, body type (amount of body<br />
fat), <strong>and</strong> genetic factors.<br />
11. Ask students to keep their copies of Masters 5.1 <strong>and</strong> 5.2 for use in<br />
the next activity.<br />
Content St<strong>and</strong>ard A:<br />
Identify questions that<br />
can be answered<br />
through scientific<br />
investigation.<br />
Content St<strong>and</strong>ard A:<br />
Design <strong>and</strong> conduct a<br />
scientific investigation.<br />
Optional Activity<br />
1. Give students an opportunity to ask their own questions about<br />
how an individual’s BAC is affected by drinking alcohol. For convenience,<br />
students can work in their same teams to decide on a<br />
question they want to investigate. Remind students to ask a question<br />
that can be answered given the information found in Masters<br />
5.1 <strong>and</strong> 5.2. Some questions that students may investigate include<br />
the following:<br />
• Can a person who weighs 200 pounds drink twice as much as a<br />
person who weighs 100 pounds <strong>and</strong> have the same BAC?<br />
• If a person has a BAC of 0.08 <strong>and</strong> stops drinking, how long will<br />
that person have to wait before their BAC drops to zero?<br />
162
• Consider someone attending a party that lasts for 4 hours. The<br />
person consumes 4 drinks during the party. How will their BAC at<br />
the end of the party vary if they drink all 4 four drinks during the<br />
first hour, drink 1 drink each hour, or drink all 4 drinks during the<br />
last hour?<br />
Asking an appropriate question might be difficult for some students.<br />
Explain that they should try to keep all variables constant, except for<br />
the one that they are investigating. Circulate around the room <strong>and</strong><br />
ask them to explain how they are answering their question. If they<br />
have difficulty making proper comparisons, guide them with questions<br />
that will help them refine their question or the way they are<br />
conducting their analysis.<br />
2. After teams finish analyzing their question, ask them to present<br />
their results to the class. Encourage each member of the class to<br />
participate in the presentation by discussing a specific aspect of<br />
the work, such as framing the question, performing the calculations,<br />
or stating the conclusions. Ask other members of the class if<br />
they agree or disagree with the conclusions.<br />
Assessment:<br />
This part of the activity<br />
enables you to assess<br />
students’ abilities to<br />
identify questions that<br />
can be answered<br />
through scientific<br />
investigation. It also<br />
provides assessment<br />
opportunities relating<br />
to methods of analysis<br />
<strong>and</strong> drawing of conclusions.<br />
Activity 2: <strong>Alcohol</strong> <strong>and</strong> Driving <strong>Behavior</strong><br />
This activity requires the use of computers with access to the<br />
Internet <strong>and</strong> a sound card. If this is not possible, give each<br />
student team a copy of Master 5.4, Progressive Effects of <strong>Alcohol</strong>,<br />
<strong>and</strong> proceed with this activity starting with Step 8.<br />
1. Introduce the activity by explaining to the class that they will<br />
watch two brief driving simulations. The simulations show the<br />
view as the driver would see things.<br />
2. Divide the class <strong>into</strong> teams of two to three students who will work<br />
at one computer. Log onto the Web site<br />
http://science.education.nih.gov/supplements/alcohol/student <strong>and</strong> click<br />
on “Lesson 5—<strong>Alcohol</strong> <strong>and</strong> Driving: When to Say No.”<br />
Teacher note<br />
This activity is designed for students to work at a computer in small teams.<br />
This approach stimulates interaction <strong>and</strong> discussion among students. You<br />
may, however, need to modify the size of the groups depending on the<br />
number of computers available. For alternate strategies, see Using the Web<br />
Site, on page 19.<br />
163<br />
Student Lesson 5
<strong>Underst<strong>and</strong>ing</strong> <strong>Alcohol</strong>: <strong>Investigations</strong> <strong>into</strong> <strong>Biology</strong> <strong>and</strong> <strong>Behavior</strong><br />
3. Instruct students to watch Simulation A <strong>and</strong> Simulation B <strong>and</strong> to<br />
record the differences they observe between the two drivers.<br />
Students will not know at the beginning which simulation represents<br />
which driver. However, they should record their observations about<br />
each simulation. Students may need to watch each simulation a few<br />
times.<br />
4. After students have viewed the simulations <strong>and</strong> recorded their<br />
observations, discuss their findings <strong>and</strong> record their observations<br />
on the board. The major differences are listed below:<br />
Content St<strong>and</strong>ard A:<br />
Think critically <strong>and</strong> logically<br />
to make the relationships<br />
between<br />
evidence <strong>and</strong> explanations.<br />
Simulation A (<strong>into</strong>xicated)<br />
Staggers while walking to car<br />
Has blurred vision<br />
Does not look both ways<br />
before crossing the street<br />
Does not fasten seat belt<br />
Has trouble putting key in<br />
ignition<br />
Exceeds speed limit<br />
Does not always stay in<br />
correct lane<br />
Drives using one h<strong>and</strong><br />
Runs through stop signs<br />
Does not stop for pedestrian<br />
Does not use turn signals<br />
Hits the trash can in driveway<br />
Simulation B (sober)<br />
Walks in a straight line to car<br />
Has clear vision<br />
Looks both ways before crossing<br />
the street<br />
Does fasten seat belt<br />
Puts key in ignition easily<br />
Does not exceed speed limit<br />
Stays in correct lane<br />
Drives using both h<strong>and</strong>s<br />
Stops smoothly at stop signs<br />
Stops to allow pedestrian to<br />
cross street<br />
Does use turn signals<br />
Parks car without hitting trash<br />
can<br />
Students may notice other minor differences, but the ones listed<br />
above are the primary ones.<br />
5. One simulation portrays a sober driver <strong>and</strong> the other portrays an<br />
<strong>into</strong>xicated driver. Ask students which simulation shows the <strong>into</strong>xicated<br />
individual.<br />
Students will respond correctly that Simulation A shows the <strong>into</strong>xicated<br />
driver.<br />
6. Ask students what they think the BAC of the driver in Simulation<br />
A was. Display a transparency of Master 5.4, Progressive Effects of<br />
<strong>Alcohol</strong>. This chart depicts the escalating impairments that happen<br />
as increasing amounts of alcohol are consumed. Explain that<br />
impairments associated with low BACs still apply at higher BACs.<br />
164
7. Ask students to provide reasons for their BAC estimates.<br />
Students should estimate a BAC for the <strong>into</strong>xicated driver based on<br />
information in Master 5.4 <strong>and</strong> on what they observed in the simulation.<br />
Because students know that the driver is <strong>into</strong>xicated, they will<br />
estimate BACs of 0.08 <strong>and</strong> higher. Students might say that the BAC<br />
could be as high as 0.21 to 0.30 because the person staggered when<br />
walking. If the BAC is in this range, in addition to the more severe<br />
impairments of reaction time <strong>and</strong> lack of balance, the driver would<br />
also display impaired alertness, judgment, depth perception, reasoning<br />
skills, <strong>and</strong> coordination. Each of these impairments would make<br />
this person a hazardous driver.<br />
8. Ask students to get out their copies of Master 5.2, Drinking Patterns<br />
for Party Guests, from Activity 1 in this lesson. Ask them to<br />
examine the data for each of the party guests they evaluated. Using<br />
Master 5.4, Progressive Effects of <strong>Alcohol</strong>, instruct the class to estimate<br />
how each individual’s BAC would affect his or her ability to<br />
drive a car. Revisit the question of whether or not each individual<br />
should drive home. Students can write their responses on the back<br />
of Master 5.2.<br />
Students should compare the BAC of each individual with the table.<br />
They should list activities that are impaired in individuals who have<br />
a BAC in that range.<br />
You will notice that the chart on Master 5.4 is depicted as a continuum<br />
<strong>and</strong> that there are no distinct cut-off points between impairments<br />
at adjacent BAC ranges. This is intended to convey the idea<br />
that impairments exist in varying degrees as opposed to simply being<br />
present or absent. This depiction is also consistent with human variation;<br />
that is, two people may be affected slightly differently from<br />
each other at a given BAC.<br />
9. Give students the opportunity to share with the class their conclusions<br />
about each of the party guests <strong>and</strong> the impairments that<br />
would affect their driving.<br />
Guest 1 has a BAC of 0.08 at the end of the party. Students may<br />
respond that she should exhibit impairments in alertness, judgment,<br />
depth perception, <strong>and</strong> visual tracking. Most will agree that she<br />
should not be behind the wheel.<br />
165<br />
Student Lesson 5
<strong>Underst<strong>and</strong>ing</strong> <strong>Alcohol</strong>: <strong>Investigations</strong> <strong>into</strong> <strong>Biology</strong> <strong>and</strong> <strong>Behavior</strong><br />
Assessment:<br />
If you wish to use this<br />
question as a more<br />
formal opportunity to<br />
evaluate students’<br />
underst<strong>and</strong>ing, ask<br />
them to write their<br />
answers to this question.<br />
You may then<br />
review the responses<br />
from each student.<br />
Asking students to<br />
write their answers<br />
before sharing them<br />
with the class allows<br />
them to organize their<br />
thoughts <strong>and</strong> reflect<br />
on what they have<br />
learned.<br />
Guest 2 has a BAC of 0.04 at the end of the party. Students may<br />
respond that even though he has a BAC below the legal limit for<br />
driving, he is still affected by the alcohol. He may be less alert <strong>and</strong><br />
less coordinated <strong>and</strong> make poorer judgments than if he hadn’t drunk<br />
any alcohol.<br />
Similar types of observations can be made for the other four party<br />
guests. Some students may conclude that it may not be a good idea<br />
for any of the party guests to drive a car.<br />
10. Ask students to consider the question, Does a BAC below the legal<br />
limit mean that it is safe for an individual to drive a car?<br />
Even though some individuals have BACs that are below the legal<br />
limit for driving, it may not be safe for them to operate a car. This is<br />
an important point for students to underst<strong>and</strong>. A BAC below the<br />
legal limit does not mean that a person’s mental <strong>and</strong> physical skills<br />
are not impaired. In fact, there is no one particular BAC where hazardous<br />
driving begins. Even one drink can cause impairment. This<br />
helps explain why different states <strong>and</strong> different countries set different<br />
legal limits for drinking <strong>and</strong> driving.<br />
166
Lesson 5 Organizer<br />
Activity 1: Patterns of Drinking<br />
What the Teacher Does<br />
Ask the class if two people attend a party <strong>and</strong> drink the same<br />
amount of alcohol, will they be affected in the same way?<br />
Ask students to recall information they learned in previous<br />
lessons.<br />
• What factors influence how different people respond<br />
to alcohol?<br />
• Where does alcohol go in the body?<br />
• Where is alcohol broken down?<br />
Help the class underst<strong>and</strong> how to use Master 5.1, Blood<br />
<strong>Alcohol</strong> Concentration Tables.<br />
• Make sure that the students underst<strong>and</strong> how metabolism<br />
reduces BACs.<br />
Divide the class <strong>into</strong> teams <strong>and</strong> make sure they know how to<br />
• determine BAC levels for fictitious individuals attending<br />
a party.<br />
• determine if those individuals can legally drive a car.<br />
Pass out to each team a copy of Master 5.2, Drinking Patterns<br />
for Party Guests.<br />
Have students graph the BACs over time for each guest<br />
using Master 5.3, Blood <strong>Alcohol</strong> Concentration Graph<br />
Template.<br />
Procedure Reference<br />
Page 151<br />
Step 1<br />
Pages 151–152<br />
Step 2<br />
Pages 152–153<br />
Steps 3 <strong>and</strong> 4<br />
Page 153<br />
Steps 5 <strong>and</strong> 6<br />
Pages 153–154<br />
Step 7<br />
Page 154<br />
Step 8<br />
= Involves copying<br />
a master.<br />
= Involves using<br />
a transparency.<br />
167<br />
= Involves using<br />
the Internet.<br />
Student Lesson 5
<strong>Underst<strong>and</strong>ing</strong> <strong>Alcohol</strong>: <strong>Investigations</strong> <strong>into</strong> <strong>Biology</strong> <strong>and</strong> <strong>Behavior</strong><br />
Have student teams share their results with the class using a<br />
transparency of Master 5.3, Blood <strong>Alcohol</strong> Concentration<br />
Graph Template.<br />
Summarize results from the activity. Ask the class,<br />
• Which individuals could drive home legally?<br />
• What factors affected the party guests’ BAC levels?<br />
• Why is a larger person affected less by a given amount<br />
of alcohol than a smaller person?<br />
• Why are females more affected by drinking the same<br />
amount of alcohol as males?<br />
• How does the pattern of drinking relate to an individual’s<br />
BAC?<br />
• Are there differences in how fast alcohol breaks down<br />
in the body among different individuals?<br />
• Do you think that the individuals whose behavior was<br />
modeled in this activity would have reached the same<br />
conclusions as you did about who should drive from<br />
the party?<br />
• Are there factors not taken <strong>into</strong> account during this<br />
activity that could influence an individual’s BAC?<br />
Instruct students to keep their copies of Masters 5.1 <strong>and</strong><br />
5.2 for use in the next activity.<br />
Pages<br />
155–160<br />
Step 9<br />
Pages 161–162<br />
Step 10<br />
Page 162<br />
Step 11<br />
Activity 2: <strong>Alcohol</strong> <strong>and</strong> Driving <strong>Behavior</strong><br />
What the Teacher Does<br />
Explain to the class that they will watch two short driving<br />
simulations.<br />
Divide the class <strong>into</strong> student teams <strong>and</strong> have them log onto<br />
the Web site. Have the students click on “Lesson 5—<strong>Alcohol</strong><br />
<strong>and</strong> Driving: When to Say No.”<br />
Procedure Reference<br />
Page 163<br />
Step 1<br />
Page 163<br />
Step 2<br />
168
Instruct students to watch each simulation <strong>and</strong> record their<br />
observations.<br />
Reconvene the class, discuss the students’ findings, <strong>and</strong><br />
record their observations on the board.<br />
Ask the students which simulation portrayed the <strong>into</strong>xicated<br />
driver.<br />
Display a transparency of Master 5.4, Progressive Effects of<br />
<strong>Alcohol</strong>, give each team a copy, <strong>and</strong> ask the class to estimate<br />
the BAC of the <strong>into</strong>xicated driver.<br />
Page 164<br />
Step 3<br />
Page 164<br />
Step 4<br />
Page 164<br />
Step 5<br />
Pages 164–165<br />
Steps 6 <strong>and</strong> 7<br />
Have students retrieve their results from Activity 1 <strong>and</strong> ask<br />
them to consider how alcohol impaired each of the party<br />
guests.<br />
Have students share their conclusions with the class.<br />
Discuss whether a BAC below the legal limit means that it<br />
is safe for an individual to drive a car.<br />
Page 165<br />
Step 8<br />
Pages 165–166<br />
Step 9<br />
Page 166<br />
Step 10<br />
169<br />
Student Lesson 5
Blood <strong>Alcohol</strong> Concentration Tables*<br />
For Women<br />
Body weight in pounds<br />
Drinks 100 120 140 160 180 200 220 240<br />
per hour<br />
1 0.05 0.04 0.03 0.03 0.03 0.02 0.02 0.02<br />
2 0.09 0.08 0.07 0.06 0.05 0.05 0.04 0.04<br />
3 0.14 0.11 0.10 0.09 0.08 0.07 0.06 0.06<br />
4 0.18 0.15 0.13 0.11 0.10 0.09 0.08 0.08<br />
5 0.23 0.19 0.16 0.14 0.13 0.11 0.10 0.09<br />
6 0.27 0.23 0.19 0.17 0.15 0.14 0.12 0.11<br />
7 0.32 0.27 0.23 0.20 0.18 0.16 0.14 0.13<br />
8 0.36 0.30 0.26 0.23 0.20 0.18 0.17 0.15<br />
9 0.41 0.34 0.29 0.26 0.23 0.20 0.19 0.17<br />
10 0.45 0.38 0.32 0.28 0.25 0.23 0.21 0.19<br />
For Men<br />
Body weight in pounds<br />
Drinks 100 120 140 160 180 200 220 240<br />
per hour<br />
1 0.04 0.03 0.03 0.02 0.02 0.02 0.02 0.02<br />
2 0.08 0.06 0.05 0.05 0.04 0.04 0.03 0.03<br />
3 0.11 0.09 0.08 0.07 0.06 0.06 0.05 0.05<br />
4 0.15 0.12 0.11 0.09 0.08 0.08 0.07 0.06<br />
5 0.19 0.16 0.13 0.12 0.11 0.09 0.09 0.08<br />
6 0.23 0.19 0.16 0.14 0.13 0.11 0.10 0.09<br />
7 0.26 0.22 0.19 0.16 0.15 0.13 0.12 0.11<br />
8 0.30 0.25 0.21 0.19 0.17 0.15 0.14 0.13<br />
9 0.34 0.28 0.24 0.21 0.19 0.17 0.15 0.14<br />
10 0.38 0.31 0.27 0.23 0.21 0.19 0.17 0.16<br />
*Blood alcohol concentrations are expressed as percent, meaning grams of alcohol per 100 milliliters (per deciliter) of blood.<br />
Tables are adapted from those of the Pennsylvania Liquor Control Board, Harrisburg.<br />
Master 5.1
Drinking Patterns for Party Guests<br />
Name(s)________________________________________________<br />
Date _____________________<br />
Guest 1 is a 120-pound female:<br />
Hour 1 2 3 4<br />
Number of drinks 2 1 1 0<br />
BAC at start of hour 0.00<br />
BAC from table<br />
BAC (start + table)<br />
<strong>Alcohol</strong> broken down –0.02 –0.02 –0.02 –0.02<br />
BAC at end of hour<br />
Should Guest 1 drive home? ________<br />
Guest 2 is a 180-pound male:<br />
Hour 1 2 3 4<br />
Number of drinks 2 2 1 0<br />
BAC at start of hour 0.00<br />
BAC from table<br />
BAC (start + table)<br />
<strong>Alcohol</strong> broken down –0.02 –0.02 –0.02 –0.02<br />
BAC at end of hour<br />
Should Guest 2 drive home? ________<br />
Master 5.2a
Drinking Patterns for Party Guests<br />
Name(s)________________________________________________<br />
Date _____________________<br />
Guest 3 is a 160-pound female:<br />
Hour 1 2 3 4<br />
Number of drinks 3 2 0 0<br />
BAC at start of hour 0.00<br />
BAC from table<br />
BAC (start + table)<br />
<strong>Alcohol</strong> broken down –0.02 –0.02 –0.02 –0.02<br />
BAC at end of hour<br />
Should Guest 3 drive home? ________<br />
Guest 4 is a 160-pound male:<br />
Hour 1 2 3 4<br />
Number of drinks 0 0 3 2<br />
BAC at start of hour 0.00<br />
BAC from table<br />
BAC (start + table)<br />
<strong>Alcohol</strong> broken down 0.00 0.00 –0.02 –0.02<br />
BAC at end of hour<br />
Should Guest 4 drive home? ________<br />
Master 5.2b
Drinking Patterns for Party Guests<br />
Name(s)________________________________________________<br />
Date _____________________<br />
Guest 5 is a 140-pound male:<br />
Hour 1 2 3 4<br />
Number of drinks 3 2 1 0<br />
BAC at start of hour 0.00<br />
BAC from table<br />
BAC (start + table)<br />
<strong>Alcohol</strong> broken down –0.02 –0.02 –0.02 –0.02<br />
BAC at end of hour<br />
Should Guest 5 drive home? ________<br />
Guest 6 is a 220-pound male:<br />
Hour 1 2 3 4<br />
Number of drinks 3 2 1 0<br />
BAC at start of hour 0.00<br />
BAC from table<br />
BAC (start + table)<br />
<strong>Alcohol</strong> broken down –0.02 –0.02 –0.02 –0.02<br />
BAC at end of hour<br />
Should Guest 6 drive home? ________<br />
Master 5.2c
Blood <strong>Alcohol</strong> Concentration<br />
Graph Template<br />
Name(s)________________________________________________<br />
Date _____________________<br />
Note: The shaded portion of the graph corresponds to BACs of 0.08 <strong>and</strong> above, which is the legal limit<br />
for driving in this activity.<br />
Master 5.3
Progressive Effects of <strong>Alcohol</strong><br />
Master 5.4
Using <strong>Alcohol</strong>:<br />
Setting Limits<br />
Lesson 6<br />
Elaborate/<br />
Evaluate<br />
Figure 6.1. Users of alcoholic beverages have the responsibility to drink<br />
wisely.<br />
Overview<br />
Students consider whether a legal limit for alcohol use should be imposed<br />
for all public activities, not just driving. Students use the knowledge from<br />
previous lessons <strong>and</strong> evaluate new information to decide whether such a<br />
limit should be established <strong>and</strong>, if so, what BAC limit to impose. Students<br />
then revisit the Statements about <strong>Alcohol</strong> from Lesson 1 to assess how<br />
their underst<strong>and</strong>ing of alcohol <strong>and</strong> its effects has changed over the course<br />
of this module.<br />
At a Glance<br />
Major Concept<br />
Low concentrations of alcohol in the body may cause impairment of physical<br />
<strong>and</strong> cognitive skills. The consequences of low BACs include increased<br />
tendencies to participate in a variety of risky behaviors.<br />
Objectives<br />
After completing this lesson, students will<br />
• be able to identify how different BACs, including low ones, affect a<br />
person’s functioning;<br />
177
<strong>Underst<strong>and</strong>ing</strong> <strong>Alcohol</strong>: <strong>Investigations</strong> <strong>into</strong> <strong>Biology</strong> <strong>and</strong> <strong>Behavior</strong><br />
• be able to differentiate between alcohol-related risks to the individual<br />
<strong>and</strong> risks to the public; <strong>and</strong><br />
• apply the knowledge they have gained about the effects of alcohol by<br />
establishing a policy for alcohol use <strong>and</strong> defending their position.<br />
Teacher Background<br />
Consult the following sections in Information about <strong>Alcohol</strong>:<br />
7 <strong>Alcohol</strong>: <strong>Behavior</strong>al Effects (pages 37–39)<br />
10 Consequences of <strong>Alcohol</strong> Abuse <strong>and</strong> <strong>Alcohol</strong>ism (pages 42–46)<br />
10.1 The costs to society (page 42)<br />
10.2 Drinking <strong>and</strong> driving (pages 42–43)<br />
10.3 Drinking <strong>and</strong> risky behavior (pages 43–44)<br />
10.4 Drinking <strong>and</strong> pregnancy (pages 44–45)<br />
10.5 Drinking <strong>and</strong> violence (pages 45–46)<br />
In Advance<br />
Web-Based Activities<br />
Activity<br />
1<br />
2<br />
Web Version?<br />
No<br />
No<br />
Photocopies<br />
Activity 1<br />
Activity 2<br />
Master 6.1, Issues to Think About (Prepare an overhead<br />
transparency.)<br />
Master 6.2, <strong>Alcohol</strong> Information Sheets (Make 1 copy per<br />
student team.)<br />
Master 6.3, <strong>Alcohol</strong>: Is This Right? What Do I Think Now?<br />
(Make 1 copy per student <strong>and</strong> prepare an overhead<br />
transparency.)<br />
Master 6.4, <strong>Alcohol</strong>: Is This Right? Class Responses (Prepare<br />
an overhead transparency.)<br />
Have students refer to their copies of Master 5.1, Blood<br />
<strong>Alcohol</strong> Concentration Tables, <strong>and</strong> Master 5.4, Progressive<br />
Effects of <strong>Alcohol</strong> (saved from Lesson 5).<br />
178
Materials<br />
Activity 1<br />
Activity 2<br />
no materials needed for this lesson, except for photocopies<br />
no materials needed for this lesson, except for photocopies<br />
Preparation<br />
Have the copies of Master 1.1, <strong>Alcohol</strong>: Is This Right? that students completed<br />
in Lesson 1 available.<br />
Activity 1: <strong>Alcohol</strong>—Risks <strong>and</strong> Consequences<br />
Procedure<br />
1. Remind students that the legal BAC for driving is 0.08 (or 0.10,<br />
depending on your state). Ask students to speculate why the BAC<br />
was set at that particular level. Is it true that alcohol consumption<br />
is safe as long as the BAC is below that level? Is it true that activities<br />
other than driving are safe, regardless of a person’s BAC?<br />
Students will give a variety of responses. Some students will say that<br />
the BAC was set at a particular level because a person’s skills are<br />
more severely affected at that point. Others may respond that it was<br />
a rather arbitrary cut-off point. This discussion may remind students<br />
of what they learned in Lesson 5.<br />
2. Ask students to consider whether there should be a legal BAC for<br />
all activities (not just driving) when a person is in public. Allow<br />
students to share their thoughts with the class.<br />
Some students will say that no such limit should exist, while others<br />
will suggest a specific BAC limit. For the purposes of this activity,<br />
insist that each student support a particular BAC level. Give students<br />
the opportunity to express the reasons for their opinions.<br />
Assessment:<br />
Ask students to recall<br />
what BAC means. Do<br />
students remember<br />
what BAC st<strong>and</strong>s for<br />
<strong>and</strong> the factors that<br />
influence it?<br />
3. Write the following BAC numbers on the board: 0.00, 0.02, 0.04,<br />
0.06, 0.08, <strong>and</strong> 0.10. Be sure to space them out so that students<br />
can st<strong>and</strong> in front of each category. Instruct students to st<strong>and</strong> in<br />
front of the number that they think should be the legal BAC for all<br />
public activities. Students will form a “human histogram.”<br />
4. Explain that students who support a particular BAC limit will form<br />
a team. They are to use information they have learned from the<br />
earlier lessons <strong>and</strong> information provided in this lesson to justify<br />
their position. They are to write a brief summary of their position<br />
<strong>and</strong> its justification to share with the class.<br />
179<br />
Student Lesson 6
<strong>Underst<strong>and</strong>ing</strong> <strong>Alcohol</strong>: <strong>Investigations</strong> <strong>into</strong> <strong>Biology</strong> <strong>and</strong> <strong>Behavior</strong><br />
Teacher note<br />
Ideally, students will work in teams of three to four. If a particular BAC category<br />
has more students than that, ask them to form <strong>into</strong> multiple teams.<br />
Also, if you have a BAC category that is supported by just one student,<br />
then you may wish to combine that BAC with the next higher or lower one<br />
to create a team of three to four students. Finally, if you have a small class,<br />
consider reducing the number of BAC categories (0.0, 0.03, 0.06, <strong>and</strong> 0.09,<br />
for example).<br />
5. Display a transparency of Master 6.1, Issues to Think About, <strong>and</strong><br />
explain that these issues can guide students as they work to justify<br />
their positions.<br />
Encourage students to use these questions as a way to get started,<br />
but not to be limited by them.<br />
Content St<strong>and</strong>ard C:<br />
<strong>Behavior</strong> is one kind of<br />
response that an<br />
organism can make to<br />
an internal or environmental<br />
stimulus.<br />
6. Pass out to each student team a copy of Master 6.2, <strong>Alcohol</strong> Information<br />
Sheets.<br />
• Explain that Master 6.2 provides additional information about<br />
the effects of alcohol use.<br />
• Encourage students to provide information not only about<br />
potential consequences of alcohol use, but also about how<br />
alcohol may be involved in causing a particular outcome.<br />
• Ask students to include information they have learned from<br />
the previous lessons in this module to support their positions.<br />
For example, Master 5.1, Blood <strong>Alcohol</strong> Concentration Tables,<br />
<strong>and</strong> Master 5.4, Progressive Effects of <strong>Alcohol</strong>, are especially<br />
helpful here.<br />
Master 6.2 provides supplemental information about alcohol’s effects<br />
that students can use in justifying their positions. It also includes<br />
information not directly relevant to their task. Part of the challenge<br />
is for students to sift through the information provided <strong>and</strong> to use<br />
only what supports their position (or contradicts a different position).<br />
Students should not simply copy complete sections from the<br />
information sheets. Ideally, students should construct a justification<br />
statement that presents all sides of the issues involved.<br />
If student teams need additional guidance to prepare their justifications,<br />
you can suggest that one or two team members focus on<br />
explaining why the BAC limit should be set at the chosen level while<br />
the rest of the team focuses on the potential problems of using that<br />
BAC limit. The team should then discuss both sides of the issues <strong>and</strong><br />
work together to write their team’s justification.<br />
180
Teacher note<br />
Students will find that information about alcohol’s effects is not always broken<br />
down by BAC range. Often terms like “heavy or chronic drinking” are<br />
encountered. For the purposes of this activity, students can consider heavy<br />
or chronic drinking to imply that the affected individuals reach BAC levels<br />
that render them <strong>into</strong>xicated (BAC of 0.08 to 0.10).<br />
7. After student teams have prepared their justifications, ask them to<br />
share their statements with the class. Encourage the rest of the students<br />
to ask the presenting team questions.<br />
Encourage all team members to participate actively in their presentation.<br />
Note that this activity does not have a single “correct” answer.<br />
The important aspect of this activity is that students present relevant<br />
facts on which to base their conclusions. During the course of writing<br />
their justification, some students may want to change their<br />
minds <strong>and</strong> support a different BAC limit. In such cases, ask them to<br />
explain the BAC limit they would select <strong>and</strong> why.<br />
If students feel that they cannot justify one BAC level as opposed to<br />
the next one, this is acceptable. A goal of the activity is to help students<br />
appreciate the nature of science. They may not be able to reach<br />
a firm conclusion. This is an opportunity to discuss what additional<br />
information they would like to have <strong>and</strong> how they could obtain it.<br />
This activity may raise additional questions about alcohol use.<br />
Encourage students to continue their investigation through Internet<br />
searches. Several helpful Web sites, including that for the National<br />
Institute on <strong>Alcohol</strong> Abuse <strong>and</strong> <strong>Alcohol</strong>ism (NIAAA), are listed in<br />
the section Additional Web Resources for Teachers (see page 199). This<br />
activity also raises an important issue about the nature of science.<br />
When students raise additional questions, they are learning how science<br />
is done.<br />
8. Following the student presentations, ask students to consider the<br />
implications of setting BAC limits. Use questions like the following<br />
to guide the discussion.<br />
• Do people know their BAC after they consume alcohol?<br />
• Is there a significant difference in a person’s mental or physical<br />
impairment between a BAC of 0.06 <strong>and</strong> 0.08? Between<br />
0.04 <strong>and</strong> 0.06?<br />
• Will a person with a BAC of 0.08 always be more affected<br />
than a person whose BAC is 0.06? Why or why not?<br />
Of course, people do not know their BACs while they are drinking<br />
alcohol. Usually, BACs are only measured after there is an accident or<br />
some other problem. Help students recognize that there is variation<br />
Content St<strong>and</strong>ard A:<br />
Develop descriptions,<br />
explanations, predictions,<br />
<strong>and</strong> models,<br />
using evidence.<br />
Assessment:<br />
The process of having<br />
student teams first<br />
write their justification<br />
<strong>and</strong> then present it<br />
orally helps you evaluate<br />
their underst<strong>and</strong>ing<br />
in two ways. First, you<br />
can collect the students’<br />
written statements<br />
<strong>and</strong> evaluate<br />
their reasoning. Second,<br />
listening to their presentations<br />
<strong>and</strong> their<br />
answers to questions<br />
by classmates gives you<br />
further insight <strong>into</strong> their<br />
underst<strong>and</strong>ing. Make<br />
sure that each student<br />
participates in the oral<br />
presentation so that<br />
you have an opportunity<br />
to evaluate his or<br />
her underst<strong>and</strong>ing.<br />
181<br />
Student Lesson 6
<strong>Underst<strong>and</strong>ing</strong> <strong>Alcohol</strong>: <strong>Investigations</strong> <strong>into</strong> <strong>Biology</strong> <strong>and</strong> <strong>Behavior</strong><br />
Content St<strong>and</strong>ard F:<br />
<strong>Alcohol</strong> <strong>and</strong> other<br />
drugs are often<br />
abused substances.<br />
Such drugs change<br />
how the body functions<br />
<strong>and</strong> can lead to<br />
addiction.<br />
in people’s response to drinking alcohol. Students should recall from<br />
previous lessons that alcohol response depends on many factors<br />
including the amount consumed, the pattern of drinking, body<br />
weight, gender, <strong>and</strong> even genetics (Lessons 2, 3, <strong>and</strong> 5). This means<br />
that the same amount of alcohol can affect different individuals differently.<br />
Activity 2: How Much Have You Learned<br />
about <strong>Alcohol</strong>?<br />
1. Give each student a copy of Master 6.3, <strong>Alcohol</strong>: Is This Right?<br />
What Do I Think Now? Ask students to agree or disagree with each<br />
statement as they did earlier.<br />
2. After students have completed Master 6.3, give each student the<br />
copy of Master 1.1, <strong>Alcohol</strong>: Is This Right?, that he or she completed<br />
during Lesson 1.<br />
3. Display an overhead transparency of Master 6.4, <strong>Alcohol</strong>: Is<br />
This Right? Class Responses. For each statement, write on the<br />
transparency how many students agreed with it at the start of<br />
the module.<br />
4. For each statement, ask how many agree with it now. Write these<br />
numbers on the transparency in the spaces provided.<br />
5. Ask the class whether they changed their minds about any of the<br />
statements about alcohol. If so, which ones?<br />
Answers will vary, though most students will change their minds<br />
about some of the statements.<br />
6. If students changed their minds about some of the statements, why<br />
did they do so?<br />
Allow students to share their thoughts with the class or ask questions<br />
about the statements. Encourage students to provide specific<br />
examples from the activities in this module to explain their thinking.<br />
If students cannot reach a consensus about a statement, refer them to<br />
the outcomes of specific activities.<br />
Use the following information about the statements to guide the<br />
discussion:<br />
182
1. <strong>Alcohol</strong> is a stimulant.<br />
<strong>Alcohol</strong> is actually a depressant. It can appear to be a stimulant<br />
because it initially depresses the part of the brain that controls<br />
inhibitions.<br />
2. Caffeine will sober you up.<br />
Caffeine will not help an individual become sober more quickly. The<br />
factors that influence a person’s BAC include the amount of alcohol<br />
consumed, the pattern of drinking, body weight, <strong>and</strong> gender. Only<br />
time will reduce the BAC as the body breaks down the alcohol.<br />
3. Food will keep you from becoming <strong>into</strong>xicated.<br />
Food in the stomach causes alcohol to be absorbed more slowly than<br />
when the stomach is empty. Food can delay the effects of alcohol,<br />
but it cannot eliminate them.<br />
4. Drinking beer is safer than drinking wine or hard liquor, such as<br />
vodka or whiskey.<br />
The type of drink is not an important factor when considering the<br />
effects of drinking alcohol. As students learned in Lesson 2, 12<br />
ounces of beer contain the same amount of alcohol as 5 ounces of<br />
wine, or 1.5 ounces of hard liquor.<br />
5. <strong>Alcohol</strong>-related car crashes are all caused by drunk drivers.<br />
Most alcohol-related car crashes are caused by drivers with BACs<br />
over the legal limit. However, as seen in Master 6.2, <strong>Alcohol</strong> Information<br />
Sheets, drivers with BACs less than the legal limit also have<br />
crash rates higher than nondrinkers. Also, as presented on Master<br />
5.4, Progressive Effects of <strong>Alcohol</strong>, BACs below the legal limit produce<br />
impairments.<br />
6. <strong>Alcohol</strong>ism is a disease.<br />
<strong>Alcohol</strong>ism is a chronic disease involving a strong craving for alcohol,<br />
a constant or periodic reliance on use of alcohol despite adverse<br />
consequences, the inability to limit drinking, physical illness when<br />
drinking is stopped, <strong>and</strong> the need for increasing amounts of alcohol<br />
in order to feel its effects.<br />
183<br />
Student Lesson 6
<strong>Underst<strong>and</strong>ing</strong> <strong>Alcohol</strong>: <strong>Investigations</strong> <strong>into</strong> <strong>Biology</strong> <strong>and</strong> <strong>Behavior</strong><br />
7. <strong>Alcohol</strong> abuse <strong>and</strong> alcoholism affect only the abuser.<br />
Unfortunately, alcohol abuse <strong>and</strong> alcoholism affect other individuals<br />
in addition to the abuser. For example, the abuser’s family <strong>and</strong><br />
friends are affected. <strong>Alcohol</strong> abuse leads to missed work, thereby<br />
affecting coworkers. Abusers are also more likely to engage in risky<br />
behaviors that can lead to accidents <strong>and</strong> even criminal behaviors that<br />
produce victims.<br />
8. <strong>Alcohol</strong> abuse or alcoholism will never be my problem.<br />
As students learned in Lesson 4, many factors influence whether a<br />
person uses alcohol, abuses alcohol, or becomes an alcoholic. Some<br />
factors are genetic, many others are environmental, but the primary<br />
factor is personal choice.<br />
9. Nothing can be done about alcohol abuse or alcoholism.<br />
<strong>Alcohol</strong> abuse <strong>and</strong> alcoholism can be treated effectively using medications<br />
<strong>and</strong> psychosocial (behavioral) therapies. Currently, there is<br />
no cure for alcoholism.<br />
10. It is a good idea to drink alcohol to prevent heart disease.<br />
Studies have shown that alcohol in moderate amounts (about one<br />
drink per day) can reduce the risk for heart disease. However, in<br />
larger amounts, alcohol makes heart disease worse <strong>and</strong> can actually<br />
interfere with the rhythm of the heart. Doctors do not recommend<br />
that nondrinkers start drinking alcohol in an effort to prevent heart<br />
disease. There are many people who should not drink even one<br />
drink per day, including pregnant women, recovering alcoholics, <strong>and</strong><br />
people taking certain medications.<br />
11. Drinking a large amount of alcohol occasionally is less harmful than<br />
drinking a smaller amount every day.<br />
Binge drinking can cause severe problems. Drinking a large amount<br />
of alcohol at one time can raise the BAC to such a dangerous level<br />
that the individual can lose consciousness <strong>and</strong> even die. However,<br />
even at lower levels, alcohol makes it more likely that a person will<br />
engage in risky behaviors with potentially serious consequences.<br />
Lessons 5 <strong>and</strong> 6 should help students underst<strong>and</strong> the consequences<br />
of consuming alcohol.<br />
184
12. Drinking alcohol makes you feel more confident.<br />
The effects of alcohol at a BAC between 0.01 <strong>and</strong> 0.05 include the<br />
loss of inhibitions <strong>and</strong> a sense of well being. When the BAC<br />
increases to between 0.06 <strong>and</strong> 0.20, some individuals become more<br />
boisterous <strong>and</strong> extroverted. These behaviors can be interpreted as<br />
confidence. However, the behavioral changes caused by alcohol consumption<br />
can vary greatly depending on the amount consumed <strong>and</strong><br />
the individual’s response. At high BAC levels, some individuals experience<br />
severe emotional swings.<br />
185<br />
Student Lesson 6
<strong>Underst<strong>and</strong>ing</strong> <strong>Alcohol</strong>: <strong>Investigations</strong> <strong>into</strong> <strong>Biology</strong> <strong>and</strong> <strong>Behavior</strong><br />
Lesson 6 Organizer<br />
Activity 1: <strong>Alcohol</strong> Risks <strong>and</strong> Consequences<br />
What the Teacher Does<br />
Ask the class why the legal BAC for driving is set where it is.<br />
• Is it true that alcohol consumption is safe as long as the<br />
BAC stays below the legal limit?<br />
• Is it true that activities other than driving are safe,<br />
regardless of a person’s BAC?<br />
Ask the class whether there should be a legal BAC for all<br />
activities (not just driving) when a person is in public.<br />
Write the following series of BAC numbers on the board:<br />
0.00, 0.02, 0.04, 0.06, 0.08, <strong>and</strong> 0.10.<br />
• Have students st<strong>and</strong> in front of the BAC that they feel<br />
should be the legal BAC for all public activities.<br />
Divide the class <strong>into</strong> student teams <strong>and</strong> instruct them to<br />
write a brief justification of their position.<br />
• Discuss Master 6.1, Issues to Think About.<br />
• Pass out Master 6.2, <strong>Alcohol</strong> Information Sheets.<br />
Procedure Reference<br />
Page 179<br />
Step 1<br />
Page 179<br />
Step 2<br />
Page 179<br />
Step 3<br />
Pages 179–180<br />
Steps 4–6<br />
Allow student teams to share their justifications with their<br />
classmates <strong>and</strong> encourage questions of the presenters.<br />
Page 181<br />
Step 7<br />
= Involves using a transparency.<br />
= Involves copying a master.<br />
186
Ask the class to consider the implications of setting such<br />
BAC limits.<br />
• Does a person know their BAC after they consume<br />
alcohol?<br />
• Is there a significant difference in a person’s mental or<br />
physical impairment between a BAC of 0.06 <strong>and</strong> 0.08?<br />
Between 0.04 <strong>and</strong> 0.06?<br />
• Will a person with a BAC of 0.08 always be more<br />
affected than a person whose BAC is 0.06?<br />
Pages 181–182<br />
Step 8<br />
Activity 2: How Much Have You Learned about <strong>Alcohol</strong>?<br />
What the Teacher Does<br />
Pass out to each student a copy of Master 6.3, <strong>Alcohol</strong>: Is<br />
This Right? What Do I Think Now? Ask students to agree or<br />
disagree with the statements.<br />
Procedure Reference<br />
Page 182<br />
Step 1<br />
Return Master 1.1 to the students so they can review their<br />
responses made during Lesson 1.<br />
Display a transparency of Master 6.4, <strong>Alcohol</strong>: Is This Right?<br />
Class Responses.<br />
• Record the number of students who agreed with each<br />
statement at the beginning of the module.<br />
• Record the number of students who agree with each<br />
statement now.<br />
Ask students if they changed their minds about any of the<br />
statements. If they have, ask them to explain their reasons.<br />
Page 182<br />
Step 2<br />
Page 182<br />
Steps 3 <strong>and</strong> 4<br />
Pages 182–185<br />
Steps 5 <strong>and</strong> 6<br />
187<br />
Student Lesson 6
Issues to Think About<br />
• The effect of alcohol on a person’s physical abilities<br />
• The effect of alcohol on a person’s mental abilities<br />
• The effect of alcohol on a person’s risk of injury<br />
• The effect of alcohol on the risk of injury to other people<br />
• Positive effects of alcohol on a person or on society<br />
• Economic costs or benefits of alcohol to an individual or<br />
to society<br />
Master 6.1
<strong>Alcohol</strong> Information Sheets<br />
TYPES OF ALCOHOLS<br />
<strong>Alcohol</strong>s are a useful class of chemical compounds. The most common alcohols that we encounter in<br />
daily life are methanol (also called wood alcohol), isopropanol (rubbing alcohol), <strong>and</strong> ethanol (or<br />
ethyl alcohol). Of these three, only ethanol is safe to drink. Other alcohols are poisons. When the<br />
word alcohol is used in association with beverages, it always refers to ethanol.<br />
<strong>Alcohol</strong>s, including ethanol, are used by the chemical industry in many ways. Methanol is used as<br />
antifreeze, <strong>and</strong> isopropanol is the main ingredient of rubbing alcohol. Ethanol has many uses in addition<br />
to being a beverage ingredient. It is used as an alternative fuel source <strong>and</strong> as a solvent for other<br />
chemicals, including some medicines. For example, some types of cough syrup have ethanol concentrations<br />
similar to those found in hard liquor.<br />
Master 6.2a
<strong>Alcohol</strong> Information Sheets<br />
ALCOHOL AND SOCIETY<br />
Adults drink alcoholic beverages for many reasons—to celebrate holidays, to celebrate good times, as an<br />
emotional release, <strong>and</strong> for cultural <strong>and</strong> religious reasons. The movies, television, <strong>and</strong> advertisements<br />
often promote alcohol as an almost required part of a happy <strong>and</strong> successful lifestyle.<br />
Most adults who drink alcohol do so responsibly. However, the time <strong>and</strong> place where alcoholic beverages<br />
are consumed are important in determining how appropriate the drinking is. In the United States,<br />
it is common for people to drink at parties. For many people, BACs in the range of 0.01–0.05 help them<br />
feel more relaxed <strong>and</strong> friendly. At parties, drinking alcohol is acceptable, as long as guests don’t drink<br />
too much. In other settings, drinking alcohol is a serious problem. For example, drinking <strong>and</strong> then<br />
driving a car can lead to crashes, <strong>and</strong> drinking at work can lead to serious accidents. Drinking alcohol<br />
while taking certain medications can produce serious health problems <strong>and</strong> even death.<br />
Different cultures view drinking alcohol differently. Some cultures prohibit drinking altogether, while others<br />
include it as part of everyday living. In some countries, many people who drink do so with the intention<br />
of becoming <strong>into</strong>xicated. Not surprisingly, different countries have different laws about the use of<br />
alcohol. The chart below lists the legal drinking age <strong>and</strong> legal BAC limit for driving in various countries.<br />
Country Minimum drinking age Legal BAC limit for driving<br />
Australia 18 0.05<br />
Austria 16 for beer <strong>and</strong> wine, 0.05<br />
18 for all types 0.01 for new drivers<br />
Belgium 15 0.05<br />
Canada 18–19 (depending on province) 0.08<br />
Denmark 18 0.05<br />
Engl<strong>and</strong> 18 0.05<br />
France 16 0.05<br />
Germany 16 for beer <strong>and</strong> wine, 0.05<br />
18 for all types<br />
Italy 16 0.08<br />
Japan 20 0.03<br />
Russia 18 0.02<br />
Spain 16 0.03–0.05<br />
(depending on type of vehicle)<br />
Sweden 18 for certain beers, 0.02–0.05<br />
20 for all types (depending on type of vehicle)<br />
Master 6.2b
<strong>Alcohol</strong> Information Sheets<br />
ALCOHOL’S EFFECTS ON THE BRAIN<br />
The brain, with its high water content, is very sensitive to the effects of alcohol. Low BAC levels affect a<br />
part of the brain called the cerebral cortex, producing a sense of relaxation <strong>and</strong> well being. People who<br />
drink moderate amounts of alcohol may have problems with certain mental activities, such as those<br />
involved with getting, storing, <strong>and</strong> using information. These effects can cause problems in school for<br />
young people <strong>and</strong> at work for adults.<br />
At higher BACs, additional parts of the brain become affected, resulting in changes in feelings <strong>and</strong> personality<br />
as well as impaired activities. People who drink heavily <strong>and</strong> for a long time often show evidence<br />
of brain damage. If an alcoholic stops using alcohol, some brain damage can be reversed. Master<br />
5.4, Progressive Effects of <strong>Alcohol</strong>, lists how increasing BACs affect the brain <strong>and</strong> describes the effects.<br />
The effects of alcohol are not limited to the brains of those who drink but also extend to the developing<br />
brains of fetuses. Pregnant women who drink expose their unborn children to alcohol when it passes<br />
through the placenta. This exposure can lead to a birth defect known as fetal alcohol syndrome (FAS).<br />
Children born with FAS have a number of symptoms including mental retardation, developmental<br />
delays, <strong>and</strong> behavioral problems.<br />
Animal studies have been used to underst<strong>and</strong> how alcohol exposure causes FAS. If drinking occurs<br />
during the time when the developing brain is growing the fastest, then FAS is more likely to occur. A<br />
recent study suggested that a single exposure to high alcohol concentrations is enough to cause FAS in<br />
rats. Healthcare providers should warn pregnant women not to drink any alcohol during their pregnancy<br />
or if they are planning to become pregnant.<br />
Master 6.2c
<strong>Alcohol</strong> Information Sheets<br />
ALCOHOL’S EFFECTS ON THE BODY<br />
<strong>Alcohol</strong> <strong>and</strong> the Heart<br />
Drinking alcohol affects the functioning of the heart <strong>and</strong> circulatory system. Studies have shown that<br />
small amounts of alcohol (about one drink per day for a woman <strong>and</strong> two drinks per day for a man) can<br />
reduce the risk of heart disease. The reason for this protective effect is not understood. Doctors do not<br />
recommend that nondrinkers start drinking to reduce their risk for heart disease, however; even moderate<br />
drinking increases the risk for other alcohol-related problems, including other medical problems,<br />
accidents, violence, <strong>and</strong> other risky behaviors. There is no question that heavy drinking is bad for the<br />
heart. It can damage heart tissue, produce an irregular heartbeat, <strong>and</strong> increase the risk of stroke.<br />
<strong>Alcohol</strong> <strong>and</strong> the Liver<br />
The liver is critical to our health. It helps break down food during digestion <strong>and</strong> processes waste so it<br />
can be excreted from the body. It also helps make needed substances such as cholesterol. Heavy drinking<br />
is often associated with liver damage. The liver is the main organ where alcohol is metabolized, or<br />
broken down, <strong>into</strong> different chemicals that can be passed out of the body. Some of these breakdown<br />
products are toxic to the liver. If these toxic substances build up in the liver, alcohol-induced liver damage<br />
can result. Women develop liver disease after a shorter time <strong>and</strong> with less alcohol exposure than<br />
men do.<br />
<strong>Alcohol</strong> <strong>and</strong> the Digestive System<br />
Heavy drinking can stop the esophagus from contracting <strong>and</strong> helping move food to the stomach. This<br />
allows stomach acids to back up <strong>into</strong> the esophagus. Stomach acid in the esophagus causes an inflammation<br />
of the cells, which can progress to esophageal cancer. Heavy alcohol use also is associated with<br />
inflammation of the pancreas <strong>and</strong> cancers in other body parts, including the mouth, throat, breast,<br />
colon, <strong>and</strong> rectum. <strong>Alcohol</strong> consumption apparently does not cause stomach cancer, but it may be<br />
involved in gastritis (inflammation of the stomach).<br />
<strong>Alcohol</strong>ics often have poor diets, so they don’t get enough essential nutrients. <strong>Alcohol</strong> also interferes<br />
with the body’s ability to break down food <strong>and</strong> absorb nutrients such as vitamins. Vitamin deficiencies<br />
can lead to other medical problems including softening of the bones <strong>and</strong> poor blood clotting.<br />
<strong>Alcohol</strong> <strong>and</strong> Hormones<br />
Hormones are chemical messengers in the body that coordinate the functions of tissues <strong>and</strong> organs.<br />
<strong>Alcohol</strong> can impair the functions of both the gl<strong>and</strong>s that release hormones <strong>and</strong> the tissues that respond<br />
to them. These effects can lead to problems regulating blood sugar, infertility, <strong>and</strong> osteoporosis (softening<br />
of bones).<br />
<strong>Alcohol</strong> <strong>and</strong> Sleep<br />
Sleep is important for good health. Many people think that alcohol will help them sleep better. In fact,<br />
alcohol can cause problems with sleeping. It interferes with the normal sleep pattern <strong>and</strong> may leave the<br />
person feeling tired <strong>and</strong> unrefreshed upon awakening.<br />
Master 6.2d
<strong>Alcohol</strong> Information Sheets<br />
DRINKING AND DRIVING<br />
Driving a car requires the driver to take in information from the environment <strong>and</strong> make many decisions<br />
about how to respond to all this information. Road conditions may be especially difficult to determine<br />
if it is dark, raining, or snowing. Roads that are narrow, have many curves, or have heavy traffic also<br />
challenge drivers.<br />
In the United States, the legal BAC for driving is set at 0.08 or 0.10, depending on the state. The skills<br />
involved in driving are not all impaired at the same BAC. A driver’s ability to divide attention between<br />
two or more sources of visual information can be impaired at a BAC of 0.02 or lower. When the BAC<br />
reaches 0.05 or higher, a person’s reaction time slows, visual perception decreases, some steering tasks<br />
are impaired, eye movements slow, <strong>and</strong> glare on the windshield becomes more difficult to deal with.<br />
The risk of a motor vehicle crash<br />
increases as the BAC increases. In addition<br />
to the amount of alcohol in the<br />
blood, the age of the driver is an important<br />
factor in determining the risk of a<br />
crash. The following graph illustrates<br />
how the risk of being in a crash<br />
increases as the BAC increases.<br />
<strong>Alcohol</strong> is involved in about 30 percent<br />
of all traffic fatalities. In 1998, 12,663<br />
people died in alcohol-related crashes in<br />
the United States. Of those killed, 35<br />
percent were driving the car, 31 percent<br />
were passengers, <strong>and</strong> 11 percent were<br />
not in the vehicle.<br />
If a person is arrested for driving under<br />
the influence of alcohol, several consequences<br />
may occur. The driver’s license<br />
can be suspended or revoked. The vehicle<br />
can be impounded. If the driver has<br />
previous drunk-driving convictions, the<br />
driver may go to jail.<br />
In addition to contributing to motor<br />
vehicle crashes on roads <strong>and</strong> highways,<br />
alcohol can impair the abilities of pilots<br />
<strong>and</strong> boaters. A pilot’s abilities can be<br />
impaired for up to 14 hours after having<br />
a BAC between 0.10 <strong>and</strong> 0.12.<br />
Master 6.2e
<strong>Alcohol</strong> Information Sheets<br />
ALCOHOL, AGGRESSION, AND VIOLENCE<br />
Violence concerns all of us, whether it is violence against one’s self, such as suicide; violence against<br />
another person, such as rape, homicide, domestic abuse (marital violence or child abuse); or violence<br />
against a group, such as riotous acts at a sporting event. Consuming alcohol can make a person more<br />
aggressive, to the point of violence. A violent behavior is defined as one that intentionally harms, or<br />
attempts to harm, another person physically. Aggressive behaviors, in addition to attempting to cause<br />
physical harm, are threatening, hostile, or harmful in a nonphysical way.<br />
One study reported that 42 percent of violent crimes reported to the police involved alcohol. The following<br />
chart summarizes the extent to which alcohol is involved in various crimes.<br />
Crime<br />
Proportion involving alcohol<br />
Murders 86%<br />
Sexual crimes 60%<br />
Assault 37%<br />
Marital violence<br />
committed by men, 57%<br />
by women 27%<br />
Child abuse 13%<br />
A BAC between 0.01 <strong>and</strong> 0.05 can cause a lack of inhibitions <strong>and</strong> cause a person to make poor judgments.<br />
As the BAC rises to 0.06–0.10, a person may become more emotional. When the BAC increases<br />
to 0.11–0.20, the person may experience anger <strong>and</strong> act inappropriately in a social setting. For example,<br />
he or she may become loud <strong>and</strong> obnoxious in a crowd.<br />
<strong>Alcohol</strong> by itself may not cause a person to commit a violent act; however, if a person who has consumed<br />
alcohol feels threatened or provoked, he or she may respond in a more severe way than if sober.<br />
Research suggests that alcohol may encourage aggression or violence by changing the way the brain<br />
works. <strong>Alcohol</strong> may make a person act more impulsively. People who have been drinking are more<br />
likely to engage in risky behaviors, including sexual behaviors. For example, surveys indicate that<br />
drinking is often associated with date rape. Drinking alcohol can also cause a person to misjudge other<br />
people’s actions <strong>and</strong> overreact to a real or imagined threat. People who have been drinking alcohol can<br />
make poor decisions about how their aggressive actions can affect themselves or others.<br />
Aggression <strong>and</strong> violence can also lead the victims to increase their consumption of alcohol, perhaps as a<br />
way to cope with the physical or emotional problems brought on by the violence.<br />
Master 6.2f
<strong>Alcohol</strong> Information Sheets<br />
ALCOHOL AND RISKY BEHAVIORS<br />
People under the influence of alcohol are more likely to engage in risky behaviors compared with<br />
people who are sober. Even BACs well below the legal limit for driving can reduce alertness <strong>and</strong> affect<br />
judgment. These same BACs also impair people’s coordination. So, while alcohol makes people feel<br />
more confident <strong>and</strong> willing to participate in risky behaviors, it lessens their ability to control their body<br />
movements.<br />
When we think about alcohol <strong>and</strong> risky behaviors, drinking-<strong>and</strong>-driving usually comes to mind. There<br />
are, however, a number of other risky behaviors that should be considered. For example, the same poor<br />
judgment <strong>and</strong> loss of coordination that can lead to car crashes also can lead to other types of accidents,<br />
such as falls. Workers who drink on the job put themselves <strong>and</strong> others at risk for injury.<br />
Sexual activity is another example of risky behavior. Surveys of young people show that they are more<br />
likely to engage in sex if they have been drinking. Additionally, 22 percent of surveyed young men <strong>and</strong><br />
15 percent of young women said they were less likely to use protection if they had been drinking. Such<br />
unprotected sex not only can result in pregnancy, but it also leaves the participants at risk to sexually<br />
transmitted diseases, including AIDS.<br />
Reasoning <strong>and</strong> coordination are affected more severely at higher BACs. In addition, BACs in the range<br />
of 0.20–0.30 may lead to a loss of body-temperature regulation. Every year, some people drink to the<br />
point of <strong>into</strong>xication <strong>and</strong> climb <strong>into</strong> a hot tub to relax. The alcohol prevents their bodies from maintaining<br />
a healthy temperature. The body temperature continues to rise to the point where it can cause<br />
brain damage <strong>and</strong> even death.<br />
Master 6.2g
<strong>Alcohol</strong> Information Sheets<br />
ALCOHOL AND THE ECONOMY<br />
The production, sale, <strong>and</strong> consumption of alcoholic beverages have many effects on the economy.<br />
On the positive side, the alcoholic-beverage industry creates thous<strong>and</strong>s of jobs for farmers, factory<br />
workers, advertisers, truck drivers, <strong>and</strong> store clerks. Federal taxes on alcoholic beverages amounted<br />
to $7.5 billion in 1995. State <strong>and</strong> local governments brought in even more tax revenue than the federal<br />
government.<br />
Of course, alcohol abuse creates costs to society. About two-thirds of American adults drink an alcoholic<br />
beverage during the year. Most drink responsibly, but an estimated 13.8 million Americans have<br />
problems related to alcohol. In 1998, it was estimated that alcohol-abuse costs totaled over<br />
$184 billion. These costs come from illness, premature death, car crashes, loss of productivity at work,<br />
higher insurance rates, <strong>and</strong> costs to the criminal justice system.<br />
Many of the costs of alcohol abuse are paid for by the majority of people who do not abuse alcohol.<br />
Some of the costs of alcohol abuse, such as human suffering, cannot be expressed in dollars <strong>and</strong> are<br />
left out of this type of analysis. The following chart illustrates who in our society bears the costs of<br />
alcohol abuse.<br />
Master 6.2h
<strong>Alcohol</strong>: Is This Right?<br />
What Do I Think Now?<br />
Name ___________________________________<br />
Date _____________________<br />
Please circle whether you agree or disagree with each statement.<br />
1. <strong>Alcohol</strong> is a stimulant. Agree Disagree<br />
2. Caffeine will sober you up. Agree Disagree<br />
3. Food will keep you from becoming <strong>into</strong>xicated. Agree Disagree<br />
4. Drinking beer is safer than drinking wine or hard liquor<br />
such as vodka or whiskey. Agree Disagree<br />
5. <strong>Alcohol</strong>-related car crashes are all caused by drunk drivers. Agree Disagree<br />
6. <strong>Alcohol</strong>ism is a disease. Agree Disagree<br />
7. <strong>Alcohol</strong> abuse <strong>and</strong> alcoholism affect only the abuser. Agree Disagree<br />
8. <strong>Alcohol</strong> abuse or alcoholism will never be my problem. Agree Disagree<br />
9. Nothing can be done about alcohol abuse or alcoholism. Agree Disagree<br />
10. It is a good idea to drink alcohol to prevent heart disease. Agree Disagree<br />
11. Drinking a large amount of alcohol occasionally is less<br />
harmful than drinking a smaller amount every day. Agree Disagree<br />
12. Drinking alcohol makes you feel more confident. Agree Disagree<br />
Master 6.3
<strong>Alcohol</strong>: Is This Right?<br />
Class Responses<br />
Agreed at<br />
beginning<br />
Agreed at<br />
end<br />
1. <strong>Alcohol</strong> is a stimulant. ______ ______<br />
2. Caffeine will sober you up. ______ ______<br />
3. Food will keep you from becoming <strong>into</strong>xicated. ______ ______<br />
4. Drinking beer is safer than drinking wine or<br />
hard liquor such as vodka or whiskey. ______ ______<br />
5. <strong>Alcohol</strong>-related car crashes are all caused by drunk drivers. ______ ______<br />
6. <strong>Alcohol</strong>ism is a disease. ______ ______<br />
7. <strong>Alcohol</strong> abuse <strong>and</strong> alcoholism affect only the abuser. ______ ______<br />
8. <strong>Alcohol</strong> abuse or alcoholism will never be my problem. ______ ______<br />
9. Nothing can be done about alcohol abuse or alcoholism. ______ ______<br />
10. It is a good idea to drink alcohol to prevent heart disease. ______ ______<br />
11. Drinking a large amount of alcohol occasionally is less<br />
harmful than drinking a smaller amount every day. ______ ______<br />
12. Drinking alcohol makes you feel more confident. ______ ______<br />
Master 6.4
Additional WebW<br />
Resources for<br />
Teachers<br />
1. National Institute on <strong>Alcohol</strong> Abuse <strong>and</strong><br />
<strong>Alcohol</strong>ism<br />
http://www.niaaa.nih.gov/<br />
This site is a resource for alcohol researchers<br />
as well as the general public. You can access<br />
• About NIAAA<br />
• Conferences/Events<br />
• Databases<br />
• Frequently Asked Questions<br />
• Other Resources<br />
• Press Releases<br />
• Publications<br />
• Research Programs<br />
2. National Clearinghouse for <strong>Alcohol</strong> <strong>and</strong> Drug<br />
Information<br />
http://www.health.org/pubs/catalog/series.htm<br />
This site features the Publications in Series. It<br />
includes the NIAAA <strong>Alcohol</strong> Alert Series.<br />
3. The Indiana Prevention Resource Center at<br />
Indiana University<br />
http://www.drugs.indiana.edu/druginfo/<br />
alcohol.html<br />
This site connects a large number of resources<br />
including<br />
• <strong>Alcohol</strong>-Related Topics<br />
• Impaired Driving Links<br />
• <strong>Alcohol</strong>ism <strong>and</strong> Recovery Links<br />
• <strong>Alcohol</strong>, Other Drugs, Sexual <strong>Behavior</strong> <strong>and</strong><br />
AIDS<br />
4. The American Medical Association<br />
http://www.ama-assn.org/special/aos/alcohol1/<br />
facts01.htm<br />
This site contains research/facts about youth<br />
<strong>and</strong> alcohol. You can click on<br />
• The Minimum Legal Drinking Age:<br />
Facts <strong>and</strong> Fallacies<br />
• Youth, Young Adults, <strong>and</strong> <strong>Alcohol</strong><br />
• <strong>Alcohol</strong> <strong>and</strong> Driving: Key Facts<br />
5. National Association for Children of <strong>Alcohol</strong>ics<br />
http://www.nacoa.org<br />
The site offers a number of publications<br />
including a kit for educators.<br />
199
Appendix I<br />
More About the National<br />
Institutes of Health<br />
Begun as a one-room Laboratory of Hygiene in<br />
1887, the National Institutes of Health today is<br />
one of the world’s foremost medical research centers<br />
<strong>and</strong> the federal focal point for medical<br />
research in the United States.<br />
What Is the NIH Mission<br />
<strong>and</strong> Organization?<br />
The NIH mission is to uncover new knowledge<br />
that will lead to better health for everyone. NIH<br />
works toward that mission by<br />
• conducting research in its own laboratories;<br />
• supporting the research of nonfederal scientists<br />
in universities, medical schools, hospitals, <strong>and</strong><br />
research institutions throughout the country<br />
<strong>and</strong> abroad;<br />
• helping in the training of research investigators;<br />
<strong>and</strong><br />
• fostering communication of medical information.<br />
NIH is one of eight health agencies of the Public<br />
Health Service, which, in turn, is part of the U.S.<br />
Department of Health <strong>and</strong> Human Services. NIH’s<br />
institutes <strong>and</strong> centers encompass 75 buildings on<br />
more than 300 acres in Bethesda, Md. The NIH<br />
budget has frown from about $300 in 1887 to<br />
more than $23.5 billion in 2002.<br />
What Is the Goal of NIH Research?<br />
Simply described, the goal of NIH research is to<br />
acquire new knowledge to help prevent, detect,<br />
diagnose, <strong>and</strong> treat disease <strong>and</strong> disability, from the<br />
rarest genetic disorder to the common cold.<br />
How Does NIH Help<br />
Scientists Reach This Goal?<br />
Approximately 82 percent of the investment is<br />
made through grants <strong>and</strong> contracts supporting<br />
research <strong>and</strong> training in more than 2,000<br />
research institutions throughout the United<br />
States <strong>and</strong> abroad. In fact, NIH grantees are<br />
located in every state in the country. These<br />
grants <strong>and</strong> contracts make up the NIH Extramural<br />
Research Program.<br />
Approximately 10 percent of the budget goes to<br />
NIH’s Intramural Research Programs, the more<br />
than 2,000 projects conducted mainly in its own<br />
laboratories.<br />
The Intramural Research Programs are central to<br />
the NIH scientific effort. First-rate intramural scientists<br />
collaborate with one another regardless of<br />
institute affiliation or scientific discipline <strong>and</strong><br />
have the intellectual freedom to pursue their<br />
research leads in NIH’s own laboratories. These<br />
explorations range from basic biology, to behavioral<br />
research, to studies on treatment of major<br />
diseases. NIH scientists conduct their research in<br />
laboratories located on the NIH campus in<br />
Bethesda <strong>and</strong> in several field units across the<br />
country <strong>and</strong> abroad.<br />
NIH Research Grants<br />
Final decisions about funding extramural research<br />
are made at NIH headquarters. But long before<br />
this happens, the process begins with an idea that<br />
an individual scientist describes in a written application<br />
for a research grant.<br />
The project might be small, or it might involve<br />
millions of dollars. The project might become useful<br />
immediately as a diagnostic test or new treatment,<br />
or it might involve studies of basic<br />
biological processes whose practical value may<br />
not be apparent for many years.<br />
201
<strong>Underst<strong>and</strong>ing</strong> <strong>Alcohol</strong>: <strong>Investigations</strong> <strong>into</strong> <strong>Biology</strong> <strong>and</strong> <strong>Behavior</strong><br />
Peer Review<br />
Each research grant application undergoes a peerreview<br />
process.<br />
A panel of scientific experts, primarily from outside<br />
the government, who are active <strong>and</strong> productive<br />
researchers in the biomedical sciences, first<br />
evaluates the scientific merit of the application.<br />
Then, a national advisory council or board, composed<br />
of eminent scientists as well as public members<br />
who are interested in health issues or the<br />
biomedical sciences, determines the project’s<br />
overall merit <strong>and</strong> priority in advancing the<br />
research agenda of the particular NIH funding<br />
institute.<br />
Altogether, about 38,500 research <strong>and</strong> training<br />
applications are reviewed annually through the<br />
NIH peer-review system. At any given time, NIH<br />
supports 35,000 grants in universities, medical<br />
schools, <strong>and</strong> other research <strong>and</strong> research training<br />
institutions both nationally <strong>and</strong> internationally.<br />
Who Are the Scientists NIH Supports?<br />
Scientific progress depends mainly on the scientist.<br />
About 50,000 principal investigators—working<br />
in every state <strong>and</strong> in several foreign countries,<br />
from every specialty in medicine, every medical<br />
discipline, <strong>and</strong> at every major university <strong>and</strong><br />
medical school—receive NIH extramural funding<br />
to explore unknown areas of medical science.<br />
Supporting <strong>and</strong> conducting NIH’s extramural <strong>and</strong><br />
intramural programs are about 15,600 employees,<br />
more than 4,000 of whom hold professional or<br />
research doctorate degrees. The NIH staff includes<br />
intramural scientists, physicians, dentists, veterinarians,<br />
nurses, <strong>and</strong> laboratory, administrative,<br />
<strong>and</strong> support personnel, plus an ever-changing<br />
array of research scientists in training.<br />
The NIH Nobelists<br />
The roster of those who have conducted NIH<br />
research or who have received NIH support over<br />
the years includes the world’s most illustrious scientists<br />
<strong>and</strong> physicians. Among them are 97 scientists<br />
who have won Nobel Prizes for achievements<br />
as diverse as deciphering the genetic code <strong>and</strong><br />
identifying the causes of hepatitis.<br />
Five Nobelists made their prize-winning discoveries<br />
in NIH laboratories. You can learn more about<br />
Nobelists who have received NIH support at<br />
http://www.nih.gov/about/almanac/nobel/index.htm.<br />
What Impact Has NIH Had<br />
in the Health of the Nation?<br />
NIH research has played a major role in making<br />
possible the following achievements of the last<br />
few decades:<br />
• Mortality from heart disease, the number one<br />
killer in the United States, dropped by 36 percent<br />
between 1977 <strong>and</strong> 1999.<br />
• Death rates from stroke decreased by 50 percent<br />
during the same period.<br />
• Improved treatments <strong>and</strong> detection methods<br />
increased the relative five-year survival rate for<br />
people with cancer to 60 percent.<br />
• Paralysis from spinal cord injury is significantly<br />
reduced by rapid treatment with high doses of a<br />
steroid. Treatment given within the first eight<br />
hours after injury increases the likelihood of<br />
recovery in severely injured patients who have<br />
lost sensation or mobility below the point of<br />
injury.<br />
• Long-term treatment with anticlotting medicines<br />
cuts stroke risk by 80 percent from a common<br />
heart condition known as atrial fibrillation.<br />
• In schizophrenia, where patients suffer frightening<br />
delusions <strong>and</strong> hallucinations, new medications<br />
can reduce or eliminate these<br />
symptoms in 80 percent of patients.<br />
• Chances for survival increased for infants with<br />
respiratory distress syndrome, an immaturity<br />
of the lungs, due to development of a substance<br />
to prevent the lungs from collapsing. In general,<br />
life expectancy for a baby born today is almost<br />
three decades longer than one born at the beginning<br />
of the century.<br />
• With effective medications <strong>and</strong> psychotherapy,<br />
the 19 million Americans who suffer from<br />
depression can now look forward to a better,<br />
more productive future.<br />
• Vaccines protect against infectious diseases that<br />
once killed <strong>and</strong> disabled millions of children<br />
<strong>and</strong> adults.<br />
• Dental sealants have proved 100 percent effective<br />
in protecting the chewing surfaces of chil-<br />
202
dren’s molars <strong>and</strong> premolars, where most cavities<br />
occur.<br />
• In 1990, NIH researchers performed the first<br />
trial of gene therapy in humans. Scientists are<br />
increasingly able to locate, identify, <strong>and</strong> describe<br />
the functions of many of the genes in the human<br />
genome. The ultimate goal is to develop screening<br />
tools <strong>and</strong> gene therapies for cancer <strong>and</strong><br />
many other diseases.<br />
NIH Research in the 21st Century<br />
NIH has enabled scientists to learn much since its<br />
humble beginnings. But many discoveries remain<br />
to be made:<br />
• Better ways to prevent <strong>and</strong> treat cancer, heart<br />
disease, stroke, blindness, arthritis, diabetes,<br />
kidney diseases, Alzheimer’s disease, communication<br />
disorders, mental illness, drug abuse <strong>and</strong><br />
alcoholism, <strong>and</strong> AIDS, <strong>and</strong> other unconquered<br />
diseases.<br />
• Ways to continue improving the health of<br />
infants <strong>and</strong> children, women, <strong>and</strong> minorities.<br />
• Better ways to underst<strong>and</strong> the aging process <strong>and</strong><br />
behavior <strong>and</strong> lifestyle practices that affect<br />
health.<br />
These are some of the areas where NIH’s investment<br />
in health research promises to yield the<br />
greatest good for the greatest number of people.<br />
For more about NIH, visit its Web site at http://<br />
www.nih.gov.<br />
203<br />
Appendix I
Appendix III<br />
More About the National Institute<br />
on <strong>Alcohol</strong> Abuse <strong>and</strong> <strong>Alcohol</strong>ism<br />
<strong>and</strong> Its Science Education Program<br />
The Public Health Problem of <strong>Alcohol</strong><br />
In 1970, the U.S. Congress recognized that alcohol<br />
is the number one drug of abuse in our nation<br />
<strong>and</strong> created the National Institute on <strong>Alcohol</strong><br />
Abuse <strong>and</strong> <strong>Alcohol</strong>ism (NIAAA) as the principal<br />
federal focus for research to address this public<br />
health problem. Today, as one of the research institutes<br />
of the National Institutes of Health (NIH),<br />
NIAAA manages about 90 percent of the nation’s<br />
investment in research aimed at developing,<br />
through science, the knowledge of that problem,<br />
whom it affects, <strong>and</strong> how, as the basis for more<br />
effective treatment <strong>and</strong> prevention methodologies.<br />
What is the scope of the problem? Approximately<br />
1 million youth, ages 12–17, are consuming alcohol.<br />
Nearly 14 million American adults develop<br />
problems from drinking. Death can be, <strong>and</strong> too<br />
often is, the ultimate consequence. About 100,000<br />
deaths each year are due to alcohol abuse <strong>and</strong><br />
alcoholism. Short of death, specific problems<br />
include health deterioration such as damage to<br />
the brain, liver, gastrointestinal tract, <strong>and</strong> heart;<br />
injuries such as automobile crashes <strong>and</strong> household<br />
accidents; domestic <strong>and</strong> other forms of violence;<br />
neglect of work <strong>and</strong> family; <strong>and</strong> costs to<br />
society associated with police, courts, jails, <strong>and</strong><br />
unemployment.<br />
It has been estimated that every dollar invested in<br />
treatment yields seven dollars in savings in healthcare<br />
costs <strong>and</strong> lost-productivity costs from job<br />
absenteeism, injuries, <strong>and</strong> poor work performance.<br />
Specific benefits of adolescent treatment<br />
include better psychological adjustment <strong>and</strong><br />
improved school performance after treatment, less<br />
heavy drinking, less use of other drugs, <strong>and</strong> less<br />
criminal involvement.<br />
Thirty Years of Research Progress<br />
NIAAA’s 30 years of attention to the science of<br />
alcohol-use problems has produced results. For<br />
example, it is now clear that a portion of the risk<br />
for developing alcoholism is the result of genetics,<br />
<strong>and</strong> scientists are making progress in finding the<br />
genes that influence vulnerability to alcoholism.<br />
We also have learned many of the ways alcohol<br />
affects the brain. <strong>Alcohol</strong> neuroscience research<br />
has already provided the basis for new medications<br />
to treat alcoholism. We have begun to<br />
underst<strong>and</strong> more about the risks—<strong>and</strong> benefits—<br />
to health that result from alcohol use <strong>and</strong> how to<br />
treat alcohol-related health conditions, including<br />
the damage caused to major body organs by excessive<br />
alcohol use. <strong>Alcohol</strong> researchers have defined<br />
populations at risk <strong>and</strong> have developed <strong>and</strong> tested<br />
programs that have proved successful in reducing<br />
alcohol-related problems in schools <strong>and</strong> communities.<br />
In fact, research findings from NIAAA-supported<br />
investigators have provided the basis for<br />
changes in policy <strong>and</strong> legislation that have saved<br />
many lives. These include raising the minimum<br />
legal drinking age to 21 <strong>and</strong> establishing 0.08 percent<br />
as the legal blood alcohol limit for driving. A<br />
growing body of research on improving treatment<br />
effectiveness has resulted in, among other things,<br />
improved diagnostic systems <strong>and</strong> methods of<br />
screening <strong>and</strong> assessment.<br />
NIAAA Overview<br />
NIAAA supports research principally through<br />
extramural grants awarded to scientists at leading<br />
U.S. academic <strong>and</strong> research institutions <strong>and</strong><br />
through research conducted by NIAAA’s own<br />
intramural staff scientists. Findings from these<br />
research areas are made available <strong>and</strong> accessible<br />
205
<strong>Underst<strong>and</strong>ing</strong> <strong>Alcohol</strong>: <strong>Investigations</strong> <strong>into</strong> <strong>Biology</strong> <strong>and</strong> <strong>Behavior</strong><br />
through a variety of dissemination activities,<br />
including the Institute’s science education program.<br />
Research <strong>and</strong> dissemination activities are<br />
summarized below.<br />
Extramural Research<br />
Genetics: NIAAA supports research aimed at discovering<br />
the genes that predispose individuals to<br />
alcoholism <strong>and</strong> the environmental factors that<br />
influence the development of alcohol dependency<br />
in susceptible individuals. Areas of genetics<br />
research include<br />
• studies of twins to define precisely what is being<br />
inherited;<br />
• genetic linkage <strong>and</strong> association studies to identify<br />
the genes for alcoholism <strong>and</strong> their precise<br />
number, identity, <strong>and</strong> modes of action; <strong>and</strong><br />
• genetic analysis of alcohol-related behavior in<br />
animals, the genes that influence these behaviors,<br />
<strong>and</strong> studies to determine the respective contributions<br />
of the environment <strong>and</strong> genetics to alcoholrelated<br />
medical disorders such as liver cirrhosis,<br />
pancreatitis, <strong>and</strong> fetal alcohol syndrome.<br />
<strong>Alcohol</strong> <strong>and</strong> the Brain: Many of the behaviors<br />
associated with alcohol-use problems are the<br />
result of alcohol’s effects on the brain. NIAAAsupported<br />
research is designed to learn how these<br />
effects influence the development of alcohol abuse<br />
<strong>and</strong> alcoholism. Molecular biology <strong>and</strong> genetic<br />
techniques, including the use of transgenic animals,<br />
are becoming an integral part of this<br />
research. In addition, noninvasive imaging technologies<br />
are used in animal <strong>and</strong> human studies to<br />
identify neural circuits influenced by alcohol.<br />
Medications Development: NIAAA is strongly<br />
committed to developing medications to diminish<br />
alcoholics’ craving for alcohol, safely detoxify<br />
dependent individuals who are entering treatment,<br />
<strong>and</strong> reduce risk of relapse. Naltrexone—the<br />
first medication approved as a safe <strong>and</strong> effective<br />
adjunct to psychosocial treatment for alcoholism<br />
since 1949—was developed from neuroscience<br />
research. It is an opiod antagonist. Findings from<br />
neuroscience <strong>and</strong> from genetics point to promising<br />
targets for the future development of additional<br />
pharmacological interventions.<br />
Prevention: NIAAA-supported prevention research<br />
is aimed at developing effective measures<br />
to reduce alcohol-related problems, including<br />
studies of alcohol-related intentional <strong>and</strong> unintentional<br />
injury, alcohol-related violence, alcohol in<br />
the workplace, drinking <strong>and</strong> driving deterrence,<br />
<strong>and</strong> the relationship between simply the availability<br />
of alcohol <strong>and</strong> incidence of alcohol-related<br />
problems. New methodologies permit prevention<br />
researchers to target high-risk neighborhoods<br />
within larger cities.<br />
Treatment: NIAAA supports a range of treatment<br />
(clinical) studies, including trials of newly developed<br />
treatment therapies, treatment-matching<br />
studies that look at the relationship between<br />
patient characteristics <strong>and</strong> type of treatment, <strong>and</strong><br />
behavioral-pharmacological treatment approaches.<br />
Epidemiology: <strong>Alcohol</strong> epidemiology provides<br />
the foundation for monitoring the health of a<br />
population, as distinguished from an individual’s<br />
health; developing <strong>and</strong> evaluating alcohol prevention<br />
<strong>and</strong> treatment services; <strong>and</strong> establishing<br />
alcohol-related social policies. NIAAA-supported<br />
epidemiology research examines the context,<br />
volume, <strong>and</strong> specific drinking patterns that lead<br />
to particular alcohol-related problems. Epidemiology<br />
research also studies the impact of gender,<br />
race <strong>and</strong> ethnicity, <strong>and</strong> other sociodemographic<br />
factors on alcohol use <strong>and</strong> abuse. Genetic, environmental,<br />
<strong>and</strong> other factors that influence alcohol-related<br />
injury or disease occurrence in a<br />
defined population are also topics of epidemiology<br />
research.<br />
Intramural Research<br />
NIAAA intramural scientists focus on unique<br />
research opportunities that require intensive,<br />
long-term commitment, together with flexibility<br />
to adjust research priorities quickly in response to<br />
new findings. Because clinical <strong>and</strong> laboratory<br />
studies occur side-by-side in the intramural program,<br />
new findings from basic research may be<br />
transferred readily for appropriate testing <strong>and</strong><br />
application. Conversely, clinical hypotheses may,<br />
in turn, be posited to lab scientists. Areas of intramural<br />
study include<br />
206
• identification <strong>and</strong> assessment of genetic <strong>and</strong><br />
environmental risk factors for the development<br />
of alcoholism;<br />
• the effects of alcohol on an individual’s central<br />
nervous system, including how alcohol modifies<br />
brain activity <strong>and</strong> behavior;<br />
• metabolic <strong>and</strong> biochemical effects of alcohol on<br />
various organs <strong>and</strong> systems of the body; <strong>and</strong><br />
• noninvasive imaging of the brain structure <strong>and</strong><br />
activity related to alcohol-use development in<br />
animal models of alcoholism.<br />
An 11-bed inpatient alcohol ward <strong>and</strong> a large outpatient<br />
program are located at the National Institutes<br />
of Health Clinical Center in Bethesda, Md.,<br />
in close proximity to NIAAA laboratories where<br />
basic research is conducted. Coordinated interaction<br />
between these facilities is essential in pursuing<br />
the goals of the intramural research program.<br />
Research Dissemination<br />
NIAAA shares findings from alcohol research with<br />
healthcare practitioners, policymakers, social<br />
service program providers, <strong>and</strong> others, including<br />
the general public through publications. These<br />
include scientific <strong>and</strong> clinical journals <strong>and</strong> monographs<br />
<strong>and</strong> general <strong>and</strong> specialized manuals, clinical<br />
bulletins, brochures, <strong>and</strong> pamphlets. Research<br />
findings are also shared through three on-line<br />
database services sponsored by the Institute:<br />
Quick Facts, an epidemiological database; ETOH<br />
(chemical name for alcohol), an alcohol-related<br />
bibliographic reference database; <strong>and</strong> the NIAAA<br />
clinical trials database. Publications, reports, <strong>and</strong><br />
database services are accessible online at<br />
http://www.niaaa.nih.gov. This website can also be<br />
a valuable resource for teachers.<br />
The NIAAA Science Education Program<br />
Dissemination of research findings through science<br />
curricula in our nation’s schools is part of the<br />
continuing commitment of NIAAA to make the<br />
science of alcohol problems both accessible <strong>and</strong><br />
underst<strong>and</strong>able to the public. Although many<br />
youth receive information about alcohol use as<br />
part of a health education or physical education<br />
curriculum, NIAAA believes that underst<strong>and</strong>ing<br />
the science involved in developing this information<br />
is important to the choices that students will<br />
make about drinking. <strong>Alcohol</strong> use is part of the<br />
American culture, <strong>and</strong> most adults who drink do<br />
so with a minimum of risk. Thus, despite what<br />
young people are taught in health education or<br />
physical education about the potential for alcohol<br />
use to cause them problems, many nevertheless<br />
take drinking for granted—a common “rite of passage”<br />
for American youth, especially boys. However,<br />
being told in a health education class that<br />
alcohol use by underage drinkers can cause cognitive<br />
damage is very different from learning the<br />
science behind this finding. Moreover, “telling” is<br />
not always “teaching.” The critical-thinking skills<br />
involved in the methodology of doing science are<br />
learned in science education. Critical thinking is<br />
an invaluable asset in personal decision making.<br />
The NIAAA science education program, of which<br />
this curriculum is one product, is designed to support<br />
teachers in their efforts to help students<br />
enjoy the process of discovery <strong>and</strong> to appreciate<br />
how medical science generally, <strong>and</strong> alcohol science<br />
specifically, addresses public health issues<br />
<strong>and</strong>, in so doing, positively affects their lives <strong>and</strong><br />
that of their families.<br />
207<br />
Appendix II
This unit was developed<br />
collaboratively by BSCS <strong>and</strong><br />
the National Institutes of<br />
Health under NIH contract<br />
number 263-99-C-0031.<br />
Department of Health<br />
<strong>and</strong> Human Services<br />
200 Independence Avenue, S.W.<br />
Washington, DC 20201<br />
http://www.dhhs.gov<br />
National Institute on <strong>Alcohol</strong> Abuse<br />
<strong>and</strong> <strong>Alcohol</strong>ism<br />
Office of Collaborative Research<br />
6000 Executive Boulevard, Suite 302<br />
Bethesda, MD 20892<br />
http://www.niaaa.nih.gov<br />
Office of Science Education<br />
National Institutes of Health<br />
6705 Rockledge Drive, Suite 700<br />
Bethesda, MD 20892<br />
http://science.education.nih.gov<br />
Biological Sciences Curriculum Studies<br />
5415 Mark Dabling Boulevard<br />
Colorado Springs, CO 80918<br />
http://www.bscs.org<br />
December 2003<br />
NIH Publication No. 04-4991