Hotel Statistics - Singapore Tourism Board
Hotel Statistics - Singapore Tourism Board
Hotel Statistics - Singapore Tourism Board

You also want an ePaper? Increase the reach of your titles
YUMPU automatically turns print PDFs into web optimized ePapers that Google loves.
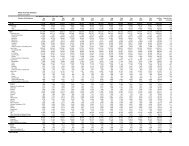
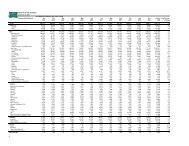
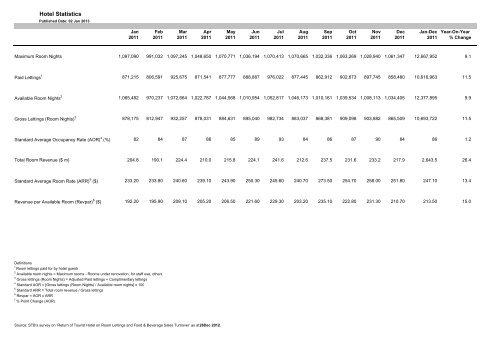
<strong>Hotel</strong> <strong>Statistics</strong><br />
Published Date: 02 Jan 2013<br />
Jan Feb Mar Apr May Jun Jul Aug Sep Oct Nov Dec Jan-Dec Year-On-Year<br />
2011 2011 2011 2011 2011 2011 2011 2011 2011 2011 2011 2011 2011 % Change<br />
Maximum Room Nights 1,097,090 991,032 1,097,245 1,048,650 1,070,771 1,036,194 1,070,413 1,070,665 1,032,336 1,063,269 1,028,940 1,061,347 12,667,952 9.1<br />
Paid Lettings 1 871,215 806,591 925,675 871,541 877,777 888,887 976,022 877,445 862,912 902,673 897,745 858,480 10,616,963 11.5<br />
Available Room Nights 2 1,065,482 970,237 1,072,664 1,022,787 1,044,568 1,010,954 1,052,817 1,046,173 1,010,161 1,039,534 1,008,113 1,034,405 12,377,895 9.9<br />
Gross Lettings (Room Nights) 3 878,175 812,947 932,257 878,031 884,631 895,040 982,734 883,037 868,381 909,098 903,882 865,509 10,693,722 11.5<br />
Standard Average Occupancy Rate (AOR) 4 (%) 82 84 87 86 85 89 93 84 86 87 90 84 86 1.2<br />
Total Room Revenue ($ m) 204.8 190.1 224.4 210.0 215.8 224.1 241.6 212.6 237.5 231.6 233.2 217.9 2,643.5 26.4<br />
Standard Average Room Rate (ARR) 5 ($) 233.20 233.80 240.60 239.10 243.90 250.30 245.60 240.70 273.50 254.70 258.00 251.80 247.10 13.4<br />
Revenue per Available Room (Revpar) 6 ($) 192.20 195.90 209.10 205.20 206.50 221.60 229.30 203.20 235.10 222.80 231.30 210.70 213.50 15.0<br />
Definitions<br />
1<br />
Room lettings paid for by hotel guests<br />
2 Available room nights = Maximum rooms - Rooms under renovation, for staff use, others<br />
3 Gross lettings (Room Nights) = Adjusted Paid lettings + Complimentary lettings<br />
4 Standard AOR = [Gross lettings (Room Nights) / Available room nights] x 100<br />
5 Standard ARR = Total room revenue / Gross lettings<br />
6 Revpar = AOR x ARR<br />
7<br />
% Point Change (AOR)<br />
Source: STB’s survey on ‘Return of Tourist <strong>Hotel</strong> on Room Lettings and Food & Beverage Sales Turnover’ as at 26Dec 2012.
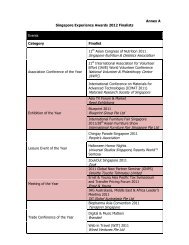
<strong>Hotel</strong> <strong>Statistics</strong> by Tier<br />
Published Date: 02 Jan 2013<br />
Year<br />
2011 (e)<br />
(Jan-Dec)<br />
Standard Average Occupancy Rate Standard Average Room Rate Revenue Per Available Room (RevPar)<br />
Luxury Upscale Mid-Tier Economy Luxury Upscale Mid-Tier Economy Luxury Upscale Mid-Tier Economy<br />
% % % % S$ % S$ % S$ % S$ % S$ % S$ % S$ % S$ %<br />
80 87 87 85 399.10 12.4 279.30 14.3 188.50 11.9 110.30 9.9 320.40 14.7 243.90 16.6 164.60 12.1 94.30 9.4<br />
Jan 74 83 84 82 400.70 21.1 264.90 24.2 174.90 22.9 106.20 23.8 295.10 19.4 220.60 27.7 147.20 21.8 87.30 33.3<br />
Feb 79 84 86 82 388.30 12.3 268.20 17.2 172.70 15.0 103.20 21.6 306.10 14.0 225.80 23.4 147.70 18.7 84.50 28.8<br />
Mar 84 86 89 88 380.70 14.7 274.40 18.4 186.10 17.9 108.10 21.6 319.40 12.2 236.90 15.4 164.90 16.4 94.80 21.2<br />
Apr 77 86 89 88 390.30 13.2 270.30 14.3 186.10 10.4 109.10 14.1 301.90 7.2 231.80 13.8 164.70 12.1 95.50 13.7<br />
May 76 84 88 86 400.10 14.5 274.70 14.9 188.50 13.5 111.10 13.7 305.20 9.3 231.80 10.5 165.50 13.3 96.10 11.0<br />
Jun 80 90 90 88 394.30 12.8 280.50 13.3 198.10 10.2 113.60 10.1 316.50 12.6 251.40 12.5 177.70 10.4 100.40 5.8<br />
Jul 86 95 94 93 386.20 14.6 275.50 17.6 193.00 11.9 111.20 11.0 330.80 23.0 260.80 21.9 181.10 14.9 103.80 9.5<br />
Aug 76 87 84 83 375.10 8.2 272.30 7.6 186.10 6.2 107.80 4.4 285.00 1.6 235.90 13.6 156.00 4.4 90.00 3.2<br />
Sep 84 87 86 81 449.90 10.5 306.10 13.2 202.80 10.5 118.20 -6.2 376.70 25.2 267.80 21.7 173.90 12.7 95.90 -7.3<br />
Oct 84 89 88 84 394.60 8.9 289.50 15.2 191.80 10.6 110.90 4.2 330.00 13.6 257.10 18.7 168.20 11.4 93.00 1.4<br />
Nov 87 91 90 85 417.20 10.0 289.70 13.7 195.20 10.6 112.00 6.0 361.90 20.7 262.90 16.1 176.50 11.0 95.40 2.0<br />
Dec 78 86 82 83 412.30 8.5 282.80 12.1 187.70 9.6 113.10 3.6 320.70 19.8 242.60 13.1 153.90 5.8 94.10 -1.8<br />
Note:<br />
The hotel tiering system is a reference system developed by the <strong>Singapore</strong> <strong>Tourism</strong> <strong>Board</strong> (STB) to categorise the different hotels in <strong>Singapore</strong> into tiers based on a combination of factors that include average room rates, location and product characteristics.<br />
The current hotel tiers published are based on the hotels’ performance in 2011. The response rate across the tiers may vary.<br />
Luxury - Includes hotels in the luxury segment and are predominantly in prime locations and/or in historical buildings<br />
Upscale - Includes hotels in the upscale segment and are generally in prime locations or hotels with boutique positioning in prime or distinctive location<br />
Mid-Tier - Includes hotels in the mid-tier segment and are primarily located in prime commercial zones or immediately outlying areas<br />
Economy - Includes hotels in the budget segment and are generally located in outlying areas