Development and validation of stability indicating method for ...
Development and validation of stability indicating method for ...
Development and validation of stability indicating method for ...
Create successful ePaper yourself
Turn your PDF publications into a flip-book with our unique Google optimized e-Paper software.
Walash et al. Chemistry Central Journal 2011, 5:61<br />
http://journal.chemistrycentral.com/content/5/1/61<br />
Page 6 <strong>of</strong> 11<br />
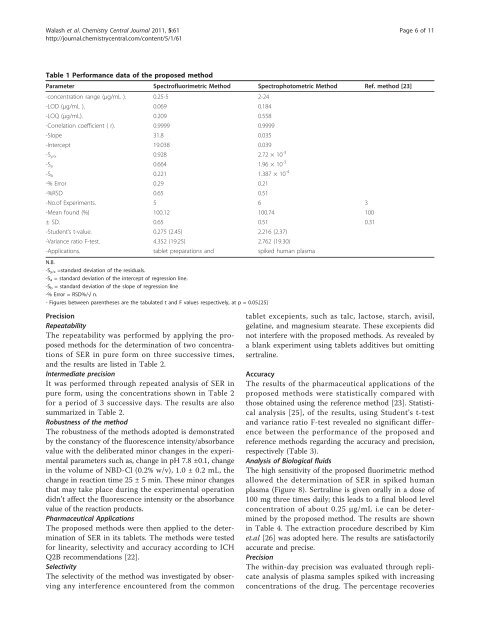
Table 1 Per<strong>for</strong>mance data <strong>of</strong> the proposed <strong>method</strong><br />
Parameter Spectr<strong>of</strong>luorimetric Method Spectrophotometric Method Ref. <strong>method</strong> [23]<br />
-concentration range (μg/mL ). 0.25-5 2-24<br />
-LOD (μg/mL ). 0.069 0.184<br />
-LOQ (μg/mL). 0.209 0.558<br />
-Correlation coefficient ( r). 0.9999 0.9999<br />
-Slope 31.8 0.035<br />
-Intercept 19.038 0.039<br />
-S y/x 0.928 2.72 × 10 -3<br />
-S a 0.664 1.96 × 10 -3<br />
-S b 0.221 1.387 × 10 -4<br />
-% Error 0.29 0.21<br />
-%RSD 0.65 0.51<br />
-No.<strong>of</strong> Experiments. 5 6 3<br />
-Mean found (%) 100.12 100.74 100<br />
± SD. 0.65 0.51 0.31<br />
-Student’s t-value. 0.275 (2.45) 2.216 (2.37)<br />
-Variance ratio F-test. 4.352 (19.25) 2.762 (19.30)<br />
-Applications. tablet preparations <strong>and</strong> spiked human plasma<br />
N.B.<br />
-S y/x =st<strong>and</strong>ard deviation <strong>of</strong> the residuals.<br />
-S a = st<strong>and</strong>ard deviation <strong>of</strong> the intercept <strong>of</strong> regression line.<br />
-S b = st<strong>and</strong>ard deviation <strong>of</strong> the slope <strong>of</strong> regression line<br />
-% Error = RSD%/√ n.<br />
- Figures between parentheses are the tabulated t <strong>and</strong> F values respectively, at p = 0.05.[25]<br />
Precision<br />
Repeatability<br />
The repeatability was per<strong>for</strong>med by applying the proposed<br />
<strong>method</strong>s <strong>for</strong> the determination <strong>of</strong> two concentrations<br />
<strong>of</strong> SER in pure <strong>for</strong>m on three successive times,<br />
<strong>and</strong> the results are listed in Table 2.<br />
Intermediate precision<br />
It was per<strong>for</strong>med through repeated analysis <strong>of</strong> SER in<br />
pure <strong>for</strong>m, using the concentrations shown in Table 2<br />
<strong>for</strong> a period <strong>of</strong> 3 successive days. The results are also<br />
summarized in Table 2.<br />
Robustness <strong>of</strong> the <strong>method</strong><br />
The robustness <strong>of</strong> the <strong>method</strong>s adopted is demonstrated<br />
by the constancy <strong>of</strong> the fluorescence intensity/absorbance<br />
value with the deliberated minor changes in the experimental<br />
parameters such as, change in pH 7.8 ±0.1, change<br />
in the volume <strong>of</strong> NBD-Cl (0.2% w/v), 1.0 ± 0.2 mL, the<br />
change in reaction time 25 ± 5 min. These minor changes<br />
that may take place during the experimental operation<br />
didn’t affect the fluorescence intensity or the absorbance<br />
value <strong>of</strong> the reaction products.<br />
Pharmaceutical Applications<br />
The proposed <strong>method</strong>s were then applied to the determination<br />
<strong>of</strong> SER in its tablets. The <strong>method</strong>s were tested<br />
<strong>for</strong> linearity, selectivity <strong>and</strong> accuracy according to ICH<br />
Q2B recommendations [22].<br />
Selectivity<br />
The selectivity <strong>of</strong> the <strong>method</strong> was investigated by observing<br />
any interference encountered from the common<br />
tablet excepients, such as talc, lactose, starch, avisil,<br />
gelatine, <strong>and</strong> magnesium stearate. These excepients did<br />
not interfere with the proposed <strong>method</strong>s. As revealed by<br />
a blank experiment using tablets additives but omitting<br />
sertraline.<br />
Accuracy<br />
The results <strong>of</strong> the pharmaceutical applications <strong>of</strong> the<br />
proposed <strong>method</strong>s were statistically compared with<br />
those obtained using the reference <strong>method</strong> [23]. Statistical<br />
analysis [25], <strong>of</strong> the results, using Student’s t-test<br />
<strong>and</strong> variance ratio F-test revealed no significant difference<br />
between the per<strong>for</strong>mance <strong>of</strong> the proposed <strong>and</strong><br />
reference <strong>method</strong>s regarding the accuracy <strong>and</strong> precision,<br />
respectively (Table 3).<br />
Analysis <strong>of</strong> Biological fluids<br />
The high sensitivity <strong>of</strong> the proposed fluorimetric <strong>method</strong><br />
allowed the determination <strong>of</strong> SER in spiked human<br />
plasma (Figure 8). Sertraline is given orally in a dose <strong>of</strong><br />
100 mg three times daily; this leads to a final blood level<br />
concentration <strong>of</strong> about 0.25 μg/mL i.e can be determined<br />
by the proposed <strong>method</strong>. The results are shown<br />
in Table 4. The extraction procedure described by Kim<br />
et.al [26] was adopted here. The results are satisfactorily<br />
accurate <strong>and</strong> precise.<br />
Precision<br />
The within-day precision was evaluated through replicate<br />
analysis <strong>of</strong> plasma samples spiked with increasing<br />
concentrations <strong>of</strong> the drug. The percentage recoveries


