Development and validation of stability indicating method for ...
Development and validation of stability indicating method for ...
Development and validation of stability indicating method for ...

Create successful ePaper yourself
Turn your PDF publications into a flip-book with our unique Google optimized e-Paper software.
Walash et al. Chemistry Central Journal 2011, 5:61<br />
http://journal.chemistrycentral.com/content/5/1/61<br />
Page 3 <strong>of</strong> 11<br />
Applications<br />
Procedure <strong>for</strong> commercial tablets<br />
Ten tablets were finely powdered <strong>and</strong> pulverized well. A<br />
weighed quantity <strong>of</strong> the powdered tablets equivalent to<br />
20 mg <strong>of</strong> SER was transferred into a 100 mL volumetric<br />
flask, about 80 mL <strong>of</strong> methanol was added <strong>and</strong> the flask<br />
was sonicated <strong>for</strong> 15 min. The volume was completed<br />
with methanol, mixed well <strong>and</strong> filtered. Aliquots containing<br />
suitable concentrations <strong>of</strong> SER were analyzed as<br />
described under Construction <strong>of</strong> the Calibration Graph.<br />
The nominal content <strong>of</strong> the tablets was determined<br />
either from the calibration curve or using the corresponding<br />
regression equation.<br />
Procedure <strong>for</strong> spiked human plasma<br />
Control samples <strong>of</strong> plasma (1 mL) were spiked with<br />
increasing quantities <strong>of</strong> SER to give a final drug concentration<br />
<strong>of</strong> 0.2-0.4 μg/mL. 2 mL <strong>of</strong> acetone was added to<br />
1.0 mL <strong>of</strong> the spiked plasma <strong>and</strong> was shaked gently. Then<br />
the mixture was centrifuged at 6000 rpm <strong>for</strong> 10 min. The<br />
clear supernatant was separated <strong>and</strong> then 1 mL phosphate<br />
buffer (pH 12) was added. After which 3 × 5 mL diethyl<br />
ether was used <strong>for</strong> extraction <strong>and</strong> the mixture was centrifuged.<br />
The ethereal layer was evaporated to dryness. The<br />
residue was reconstituted in 2.0 mL <strong>of</strong> methanol, <strong>and</strong> then<br />
<strong>method</strong> II was per<strong>for</strong>med as described under Construction<br />
<strong>of</strong> the Calibration Graph. The nominal content <strong>of</strong> the<br />
drug was determined using the corresponding regression<br />
equation.<br />
Stability Indication <strong>of</strong> the Method<br />
Forced Degradation Studies<br />
1- Alkaline Degradation Solutions <strong>for</strong> alkaline degradation<br />
were prepared by dissolving 100 mg <strong>of</strong> SER in the<br />
least amount <strong>of</strong> methanol, <strong>and</strong> the volume was completed<br />
to 100 mL in a volumetric flask with 5.0 M sodium hydroxide,<br />
then the solution was heated in a boiling water bath<br />
<strong>for</strong> three hours. Then aliquot volumes <strong>of</strong> these solutions<br />
were transferred to 10 mL volumetric flasks <strong>and</strong> treated as<br />
described under <strong>method</strong> I under Construction <strong>of</strong> the Calibration<br />
Graph.<br />
2- Acidic Degradation The same <strong>method</strong> <strong>for</strong> alkaline<br />
degradation was followed using 5.0 M hydrochloric acid<br />
instead <strong>of</strong> 5.0 M sodium hydroxide. Then aliquot volumes<br />
<strong>of</strong> these solutions were transferred to 10 mL volumetric<br />
flasks <strong>and</strong> treated also as described under <strong>method</strong> I under<br />
Construction <strong>of</strong> the Calibration Graph.<br />
3- Photolytic Degradation Solutions <strong>for</strong> photolytic<br />
degradations were prepared by dissolving 100 mg <strong>of</strong> SER<br />
in the least amount <strong>of</strong> methanol, <strong>and</strong> the volume was<br />
completed to 25 mL in a volumetric flask with the same<br />
solvent. The solution was exposed to UV-Lamp at a wavelength<br />
<strong>of</strong> 245 nm at a distance <strong>of</strong> 15 cm placed in a wooden<br />
cabinet <strong>for</strong> 24 <strong>and</strong> 48 hours. Then aliquot volumes <strong>of</strong><br />
these solutions were transferred to 10 mL volumetric<br />
flasks <strong>and</strong> treated as described <strong>for</strong> <strong>method</strong> I under Construction<br />
<strong>of</strong> the Calibration Graph.<br />
Oxidative Degradation Studies<br />
For the kinetic study <strong>of</strong> the oxidative degradation, aliquots<br />
<strong>of</strong> SER stock solution were quantitatively transferred to<br />
50 mL volumetric flasks so that the final concentration is<br />
100 μg/mL, then 5 mL <strong>of</strong> 1% (v/v) H 2 O 2 was added so<br />
that its final concentration is 0.1% (v/v) <strong>and</strong> the solution<br />
was heated at different temperature settings using a thermostatically<br />
controlled water bath then allowed to cool.<br />
Each flask was completed to volume with methanol <strong>and</strong><br />
aliquots <strong>of</strong> these solutions were transferred to 10 mL volumetric<br />
flasks so that the final concentration is 20 μg/mL.<br />
The procedure described <strong>for</strong> <strong>method</strong> I under Construction<br />
<strong>of</strong> the Calibration Graph was per<strong>for</strong>med.<br />
Results <strong>and</strong> Discussion<br />
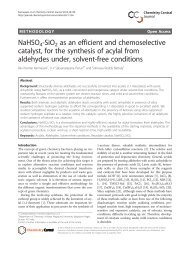
In the present study, SER was found to react with NBD-Cl<br />
in presence <strong>of</strong> borate buffer (pH 7.8) producing a yellow<br />
color peaking at 395 nm. (Figure 2) <strong>and</strong> resulting in a<br />
strong fluorescence at 530 nm after excitation at 480 nm<br />
(Figure 3).<br />
Optimization <strong>of</strong> Experimental parameters<br />
The spectr<strong>of</strong>luorimetric <strong>and</strong> spectrophotometric properties<br />
<strong>of</strong> the colored product as well as the different experimental<br />
parameters affecting the color development <strong>and</strong> its<br />
<strong>stability</strong> were carefully studied <strong>and</strong> optimized. Such factors<br />
were changed individually while others were kept constant.<br />
The factors include pH, type <strong>of</strong> buffer, temperature, time<br />
<strong>of</strong> heating, effect <strong>of</strong> surfactants <strong>and</strong> effect <strong>of</strong> diluting<br />
solvent.<br />
Effect <strong>of</strong> pH<br />
The influence <strong>of</strong> pH on the absorbance <strong>of</strong> the reaction<br />
product was evaluated. Maximum absorbance intensity<br />
Absorbance<br />
1<br />
0.8<br />
0.6<br />
0.4<br />
0.2<br />
a<br />
c<br />
0<br />
200 250 300 350 400 450 500 550<br />
b<br />
Wavelength (nm.)<br />
Figure 2 Absorption Spectra. (a) SER (20 μg/mL) in borate buffer<br />
<strong>of</strong> pH 7.8. (b) The reaction product <strong>of</strong> SER (20 μg/mL) with NBD-Cl<br />
in borate buffer <strong>of</strong> pH 7.8. (c) Blank solution with NBD-Cl in borate<br />
buffer <strong>of</strong> pH 7.8.