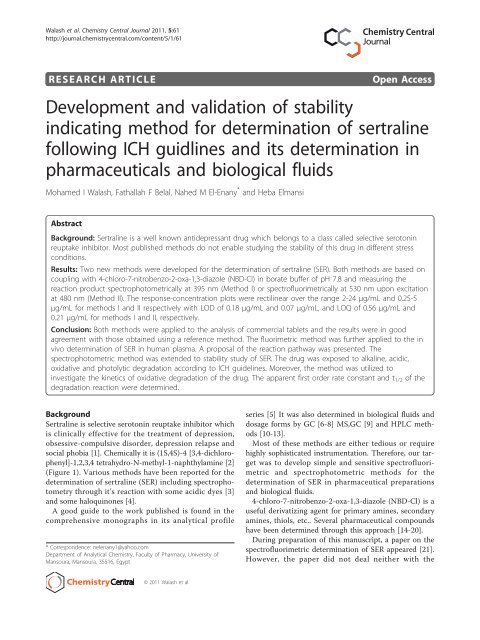
Development and validation of stability indicating method for ...
Development and validation of stability indicating method for ...
Development and validation of stability indicating method for ...

You also want an ePaper? Increase the reach of your titles
YUMPU automatically turns print PDFs into web optimized ePapers that Google loves.
Walash et al. Chemistry Central Journal 2011, 5:61<br />
http://journal.chemistrycentral.com/content/5/1/61<br />
RESEARCH ARTICLE<br />
Open Access<br />
<strong>Development</strong> <strong>and</strong> <strong>validation</strong> <strong>of</strong> <strong>stability</strong><br />
<strong>indicating</strong> <strong>method</strong> <strong>for</strong> determination <strong>of</strong> sertraline<br />
following ICH guidlines <strong>and</strong> its determination in<br />
pharmaceuticals <strong>and</strong> biological fluids<br />
Mohamed I Walash, Fathallah F Belal, Nahed M El-Enany * <strong>and</strong> Heba Elmansi<br />
Abstract<br />
Background: Sertraline is a well known antidepressant drug which belongs to a class called selective serotonin<br />
reuptake inhibitor. Most published <strong>method</strong>s do not enable studying the <strong>stability</strong> <strong>of</strong> this drug in different stress<br />
conditions.<br />
Results: Two new <strong>method</strong>s were developed <strong>for</strong> the determination <strong>of</strong> sertraline (SER). Both <strong>method</strong>s are based on<br />
coupling with 4-chloro-7-nitrobenzo-2-oxa-1,3-diazole (NBD-Cl) in borate buffer <strong>of</strong> pH 7.8 <strong>and</strong> measuring the<br />
reaction product spectrophotometrically at 395 nm (Method I) or spectr<strong>of</strong>luorimetrically at 530 nm upon excitation<br />
at 480 nm (Method II). The response-concentration plots were rectilinear over the range 2-24 μg/mL <strong>and</strong> 0.25-5<br />
μg/mL <strong>for</strong> <strong>method</strong>s I <strong>and</strong> II respectively with LOD <strong>of</strong> 0.18 μg/mL <strong>and</strong> 0.07 μg/mL, <strong>and</strong> LOQ <strong>of</strong> 0.56 μg/mL <strong>and</strong><br />
0.21 μg/mL <strong>for</strong> <strong>method</strong>s I <strong>and</strong> II, respectively.<br />
Conclusion: Both <strong>method</strong>s were applied to the analysis <strong>of</strong> commercial tablets <strong>and</strong> the results were in good<br />
agreement with those obtained using a reference <strong>method</strong>. The fluorimetric <strong>method</strong> was further applied to the in<br />
vivo determination <strong>of</strong> SER in human plasma. A proposal <strong>of</strong> the reaction pathway was presented. The<br />
spectrophotometric <strong>method</strong> was extended to <strong>stability</strong> study <strong>of</strong> SER. The drug was exposed to alkaline, acidic,<br />
oxidative <strong>and</strong> photolytic degradation according to ICH guidelines. Moreover, the <strong>method</strong> was utilized to<br />
investigate the kinetics <strong>of</strong> oxidative degradation <strong>of</strong> the drug. The apparent first order rate constant <strong>and</strong> t 1/2 <strong>of</strong> the<br />
degradation reaction were determined.<br />
Background<br />
Sertraline is selective serotonin reuptake inhibitor which<br />
is clinically effective <strong>for</strong> the treatment <strong>of</strong> depression,<br />
obsessive-compulsive disorder, depression relapse <strong>and</strong><br />
social phobia [1]. Chemically it is (1S,4S)-4 [3,4-dichlorophenyl]-1,2,3,4<br />
tetrahydro-N-methyl-1-naphthylamine [2]<br />
(Figure 1). Various <strong>method</strong>s have been reported <strong>for</strong> the<br />
determination <strong>of</strong> sertraline (SER) including spectrophotometry<br />
through it’s reaction with some acidic dyes [3]<br />
<strong>and</strong> some haloquinones [4].<br />
A good guide to the work published is found in the<br />
comprehensive monographs in its analytical pr<strong>of</strong>ile<br />
* Correspondence: nelenany1@yahoo.com<br />
Department <strong>of</strong> Analytical Chemistry, Faculty <strong>of</strong> Pharmacy, University <strong>of</strong><br />
Mansoura, Mansoura, 35516, Egypt<br />
series [5] It was also determined in biological fluids <strong>and</strong><br />
dosage <strong>for</strong>ms by GC [6-8] MS,GC [9] <strong>and</strong> HPLC <strong>method</strong>s<br />
[10-13].<br />
Most <strong>of</strong> these <strong>method</strong>s are either tedious or require<br />
highly sophisticated instrumentation. There<strong>for</strong>e, our target<br />
was to develop simple <strong>and</strong> sensitive spectr<strong>of</strong>luorimetric<br />
<strong>and</strong> spectrophotometric <strong>method</strong>s <strong>for</strong> the<br />
determination <strong>of</strong> SER in pharmaceutical preparations<br />
<strong>and</strong> biological fluids.<br />
4-chloro-7-nitrobenzo-2-oxa-1,3-diazole (NBD-Cl) is a<br />
useful derivatizing agent <strong>for</strong> primary amines, secondary<br />
amines, thiols, etc.. Several pharmaceutical compounds<br />
have been determined through this approach [14-20].<br />
During preparation <strong>of</strong> this manuscript, a paper on the<br />
spectr<strong>of</strong>luorimetric determination <strong>of</strong> SER appeared [21].<br />
However, the paper did not deal neither with the<br />
© 2011 Walash et al
Walash et al. Chemistry Central Journal 2011, 5:61<br />
http://journal.chemistrycentral.com/content/5/1/61<br />
Page 2 <strong>of</strong> 11<br />
product <strong>of</strong> Global Napi Pharmaceuticals <strong>for</strong> REXCEL<br />
EGYPT.<br />
▪ Lustral ® tablets, batch # 9201, labeled to contain<br />
50.0 mg <strong>of</strong> SER/tablet, product <strong>of</strong> Pfizer Egypt S.A.E.<br />
Cairo.<br />
Figure 1 Structural <strong>for</strong>mula <strong>of</strong> SER.<br />
determination <strong>of</strong> drug in plasma nor with the <strong>stability</strong><br />
study <strong>of</strong> the drug. Since the purpose <strong>of</strong> <strong>stability</strong> studies<br />
is to monitor possible changes to a product or a material<br />
over a time at different storage conditions, it is<br />
expected that, only those <strong>method</strong>s that are <strong>stability</strong><strong>indicating</strong><br />
should be used.<br />
The parent drug <strong>stability</strong> guidelines issued by the<br />
international conference <strong>of</strong> harmonization (ICH) [22]<br />
requires that analytical test procedure should indicate<br />
<strong>stability</strong>. There<strong>for</strong>e, the present study was extended to<br />
establish the inherent <strong>stability</strong> <strong>of</strong> SER under different<br />
stress conditions such as, alkaline, acidic, oxidative <strong>and</strong><br />
photolytic conditions.<br />
Experimental<br />
Apparatus<br />
Spectrophotometric analysis was carried out on a Shimadzu<br />
(Kyoto, Japan) UV-1601 PC, UV-Visible doublebeam<br />
spectrophotometer with matched 1 cm path-length<br />
quartz cells. Absorption spectra were recorded on a fast<br />
scan speed, setting slit width to be 1 nm <strong>and</strong> sampling<br />
interval to be auto.<br />
The spectr<strong>of</strong>luorimetric measurements were made<br />
using Perkin Elmer LS 45 Luminescence Spectrometer<br />
equippedwith150WattXenonarclamp<strong>and</strong>quartz<br />
cell (1 cm).<br />
Materials <strong>and</strong> Reagents<br />
All reagents <strong>and</strong> solvents were <strong>of</strong> Analytical Reagent<br />
grade.<br />
- The pure sample <strong>of</strong> sertraline (SER) was kindly supplied<br />
by the Egyptian Company <strong>for</strong> Chemicals <strong>and</strong> Pharmaceuticals<br />
(ADWIA) (10 th <strong>of</strong> Ramadan City, Egypt), with<br />
a purity <strong>of</strong> 99.78% as determined by the reference <strong>method</strong><br />
[23]. The following preparations containing the drug were<br />
purchased from local pharmacies:<br />
▪ Seserine ® tablets, batch # 080371, labeled to contain<br />
56.0 mg SER HCl equivalent to 50.0 mg SER/<br />
tablet, product <strong>of</strong> ADWIA Co. S.A.E, 10 th <strong>of</strong> Ramadan<br />
City, Egypt.<br />
▪ Serlift ® tablets, batch # 810102, labeled to contain<br />
SER HCl equivalent to 100.0 mg SER/tablet,<br />
- Plasma was kindly provided by Mansoura University<br />
Hospital, <strong>and</strong> kept frozen until use after gentle thawing.<br />
- 4-Chloro-7-nitrobenzo-2-oxa-1,3-diazole (NBD-Cl )<br />
purchased from Sigma ( St.Louis USA). A stock solution<br />
containing 0.2% (w/v) <strong>of</strong> the reagent was freshly prepared<br />
in methanol.<br />
-Methanol, hydrochloric acid <strong>and</strong> diethyl ether<br />
(Merck, Darmstadt, Germany).<br />
- Borate buffer (0.2 M, pH 7.8), phosphate buffer<br />
(0.2M, pH 12).<br />
- 1.0 M aqueous solution <strong>of</strong> sodium hydroxide (BDH,<br />
UK).Hydrogen peroxide (BDH, UK); 0.1% (v/v) aqueous<br />
solution<br />
St<strong>and</strong>ard solution<br />
A stock solution was prepared by dissolving 20.0 mg <strong>of</strong><br />
SER in 100 mL <strong>of</strong> methanol <strong>and</strong> was further diluted with<br />
the same solvent as appropriate. The st<strong>and</strong>ard solutions<br />
were stable <strong>for</strong> seven days when kept in the refrigerator.<br />
General Procedure<br />
Construction <strong>of</strong> the Calibration Curve<br />
a) Spectrophotometric <strong>method</strong> (Method I) To a set <strong>of</strong><br />
10 mL volumetric flasks, aliquot volumes containing the<br />
drug were quantitatively transferred to obtain final concentrations<br />
<strong>of</strong> 2-24 μg/mL <strong>of</strong> SER. 2.0 mL <strong>of</strong> borate buffer<br />
(pH 7.8) followed by 1 mL <strong>of</strong> NBD-Cl solution (0.2% w/v)<br />
<strong>and</strong> were mixed well. The solutions were heated in a thermostatically<br />
controlled water bath at 60°C <strong>for</strong> 25 min. The<br />
reaction was stopped by cooling under tap water, <strong>and</strong> then<br />
0.2 mL <strong>of</strong> concentrated HCl was added. The solutions<br />
were quantitatively transferred to 10 mL volumetric flasks<br />
<strong>and</strong>eachflaskwasmadeuptovolumewithmethanol.<br />
The absorbance was measured at 395 nm against a reagent<br />
blank. The calibration graph was constructed by plotting<br />
the absorbance versus the final concentration <strong>of</strong> the drug<br />
(μg/mL). Alternatively, the corresponding regression equation<br />
was derived.<br />
b) Spectr<strong>of</strong>luorimetric <strong>method</strong> (Method II) The procedure<br />
adopted <strong>for</strong> spectrophotometric <strong>method</strong> was per<strong>for</strong>med<br />
after dilution <strong>of</strong> the st<strong>and</strong>ard solution to obtain<br />
the working concentration range <strong>of</strong> 0.25-5 μg/mL. The<br />
fluorescence intensity <strong>of</strong> the resulting solutions was<br />
measured at 530 nm after excitation at 480 nm. The<br />
corrected fluorescence intensity (ΔF) was plotted vs the<br />
final concentrations <strong>of</strong> the drug (μg/mL) to get the calibration<br />
curve. Alternatively, the regression equation was<br />
derived.
Walash et al. Chemistry Central Journal 2011, 5:61<br />
http://journal.chemistrycentral.com/content/5/1/61<br />
Page 3 <strong>of</strong> 11<br />
Applications<br />
Procedure <strong>for</strong> commercial tablets<br />
Ten tablets were finely powdered <strong>and</strong> pulverized well. A<br />
weighed quantity <strong>of</strong> the powdered tablets equivalent to<br />
20 mg <strong>of</strong> SER was transferred into a 100 mL volumetric<br />
flask, about 80 mL <strong>of</strong> methanol was added <strong>and</strong> the flask<br />
was sonicated <strong>for</strong> 15 min. The volume was completed<br />
with methanol, mixed well <strong>and</strong> filtered. Aliquots containing<br />
suitable concentrations <strong>of</strong> SER were analyzed as<br />
described under Construction <strong>of</strong> the Calibration Graph.<br />
The nominal content <strong>of</strong> the tablets was determined<br />
either from the calibration curve or using the corresponding<br />
regression equation.<br />
Procedure <strong>for</strong> spiked human plasma<br />
Control samples <strong>of</strong> plasma (1 mL) were spiked with<br />
increasing quantities <strong>of</strong> SER to give a final drug concentration<br />
<strong>of</strong> 0.2-0.4 μg/mL. 2 mL <strong>of</strong> acetone was added to<br />
1.0 mL <strong>of</strong> the spiked plasma <strong>and</strong> was shaked gently. Then<br />
the mixture was centrifuged at 6000 rpm <strong>for</strong> 10 min. The<br />
clear supernatant was separated <strong>and</strong> then 1 mL phosphate<br />
buffer (pH 12) was added. After which 3 × 5 mL diethyl<br />
ether was used <strong>for</strong> extraction <strong>and</strong> the mixture was centrifuged.<br />
The ethereal layer was evaporated to dryness. The<br />
residue was reconstituted in 2.0 mL <strong>of</strong> methanol, <strong>and</strong> then<br />
<strong>method</strong> II was per<strong>for</strong>med as described under Construction<br />
<strong>of</strong> the Calibration Graph. The nominal content <strong>of</strong> the<br />
drug was determined using the corresponding regression<br />
equation.<br />
Stability Indication <strong>of</strong> the Method<br />
Forced Degradation Studies<br />
1- Alkaline Degradation Solutions <strong>for</strong> alkaline degradation<br />
were prepared by dissolving 100 mg <strong>of</strong> SER in the<br />
least amount <strong>of</strong> methanol, <strong>and</strong> the volume was completed<br />
to 100 mL in a volumetric flask with 5.0 M sodium hydroxide,<br />
then the solution was heated in a boiling water bath<br />
<strong>for</strong> three hours. Then aliquot volumes <strong>of</strong> these solutions<br />
were transferred to 10 mL volumetric flasks <strong>and</strong> treated as<br />
described under <strong>method</strong> I under Construction <strong>of</strong> the Calibration<br />
Graph.<br />
2- Acidic Degradation The same <strong>method</strong> <strong>for</strong> alkaline<br />
degradation was followed using 5.0 M hydrochloric acid<br />
instead <strong>of</strong> 5.0 M sodium hydroxide. Then aliquot volumes<br />
<strong>of</strong> these solutions were transferred to 10 mL volumetric<br />
flasks <strong>and</strong> treated also as described under <strong>method</strong> I under<br />
Construction <strong>of</strong> the Calibration Graph.<br />
3- Photolytic Degradation Solutions <strong>for</strong> photolytic<br />
degradations were prepared by dissolving 100 mg <strong>of</strong> SER<br />
in the least amount <strong>of</strong> methanol, <strong>and</strong> the volume was<br />
completed to 25 mL in a volumetric flask with the same<br />
solvent. The solution was exposed to UV-Lamp at a wavelength<br />
<strong>of</strong> 245 nm at a distance <strong>of</strong> 15 cm placed in a wooden<br />
cabinet <strong>for</strong> 24 <strong>and</strong> 48 hours. Then aliquot volumes <strong>of</strong><br />
these solutions were transferred to 10 mL volumetric<br />
flasks <strong>and</strong> treated as described <strong>for</strong> <strong>method</strong> I under Construction<br />
<strong>of</strong> the Calibration Graph.<br />
Oxidative Degradation Studies<br />
For the kinetic study <strong>of</strong> the oxidative degradation, aliquots<br />
<strong>of</strong> SER stock solution were quantitatively transferred to<br />
50 mL volumetric flasks so that the final concentration is<br />
100 μg/mL, then 5 mL <strong>of</strong> 1% (v/v) H 2 O 2 was added so<br />
that its final concentration is 0.1% (v/v) <strong>and</strong> the solution<br />
was heated at different temperature settings using a thermostatically<br />
controlled water bath then allowed to cool.<br />
Each flask was completed to volume with methanol <strong>and</strong><br />
aliquots <strong>of</strong> these solutions were transferred to 10 mL volumetric<br />
flasks so that the final concentration is 20 μg/mL.<br />
The procedure described <strong>for</strong> <strong>method</strong> I under Construction<br />
<strong>of</strong> the Calibration Graph was per<strong>for</strong>med.<br />
Results <strong>and</strong> Discussion<br />
In the present study, SER was found to react with NBD-Cl<br />
in presence <strong>of</strong> borate buffer (pH 7.8) producing a yellow<br />
color peaking at 395 nm. (Figure 2) <strong>and</strong> resulting in a<br />
strong fluorescence at 530 nm after excitation at 480 nm<br />
(Figure 3).<br />
Optimization <strong>of</strong> Experimental parameters<br />
The spectr<strong>of</strong>luorimetric <strong>and</strong> spectrophotometric properties<br />
<strong>of</strong> the colored product as well as the different experimental<br />
parameters affecting the color development <strong>and</strong> its<br />
<strong>stability</strong> were carefully studied <strong>and</strong> optimized. Such factors<br />
were changed individually while others were kept constant.<br />
The factors include pH, type <strong>of</strong> buffer, temperature, time<br />
<strong>of</strong> heating, effect <strong>of</strong> surfactants <strong>and</strong> effect <strong>of</strong> diluting<br />
solvent.<br />
Effect <strong>of</strong> pH<br />
The influence <strong>of</strong> pH on the absorbance <strong>of</strong> the reaction<br />
product was evaluated. Maximum absorbance intensity<br />
Absorbance<br />
1<br />
0.8<br />
0.6<br />
0.4<br />
0.2<br />
a<br />
c<br />
0<br />
200 250 300 350 400 450 500 550<br />
b<br />
Wavelength (nm.)<br />
Figure 2 Absorption Spectra. (a) SER (20 μg/mL) in borate buffer<br />
<strong>of</strong> pH 7.8. (b) The reaction product <strong>of</strong> SER (20 μg/mL) with NBD-Cl<br />
in borate buffer <strong>of</strong> pH 7.8. (c) Blank solution with NBD-Cl in borate<br />
buffer <strong>of</strong> pH 7.8.
Walash et al. Chemistry Central Journal 2011, 5:61<br />
http://journal.chemistrycentral.com/content/5/1/61<br />
Page 4 <strong>of</strong> 11<br />
Fluorescence Intensity<br />
160<br />
140<br />
120<br />
100<br />
80<br />
60<br />
40<br />
20<br />
a<br />
0<br />
250 300 350 400 450 500 550 600 650 700 750 800<br />
a) Excitation Spectrum <strong>of</strong> drug.<br />
b) Emission Spectrum <strong>of</strong> drug.<br />
a`) Excitation Spectrum <strong>of</strong> Blank.<br />
b`) Emission Spectrum <strong>of</strong> Blank.<br />
a`<br />
Wavelength (nm.)<br />
Figure 3 Fluorescence spectra <strong>of</strong> the reaction product. (A,B)<br />
SER ( 2.5 μg/mL) with 0.2% NBD-Cl at pH 7.8. (A’, B’) blank with<br />
0.2% NBD-Cl at pH 7.8.<br />
was obtained at pH 7.7 <strong>and</strong> remained constant up to 7.9<br />
after which the absorbance <strong>of</strong> the reaction product<br />
began to decrease gradually until pH 9. There<strong>for</strong>e, pH<br />
<strong>of</strong> 7.8 ± 0.1 was chosen as the optimum one (Figure 4).<br />
Other buffers having the same pH value such as phosphate<br />
<strong>and</strong> hexamine were tried <strong>and</strong> compared with<br />
0.2 M borate buffer. Borate buffer was found to be<br />
superior to other buffers having the same pH value since<br />
the net fluorescence intensity was highest in case <strong>of</strong><br />
borate buffer. This is probably, because the rate <strong>of</strong> hydrolysis<br />
<strong>of</strong> NBD-Cl to NBD-OH was much slower. This<br />
result is in agreement with that <strong>of</strong> Miyano et al [24].<br />
Effect <strong>of</strong> concentration <strong>of</strong> NBD-Cl<br />
The influence <strong>of</strong> the concentration <strong>of</strong> NBD-Cl was studied<br />
using different volumes <strong>of</strong> 0.2% w/v solution <strong>of</strong> the<br />
reagent. It was found that, the reaction <strong>of</strong> NBD-Cl with<br />
b<br />
b`<br />
SER started upon using 0.2 mL <strong>of</strong> the reagent in the<br />
presence <strong>of</strong> borate buffer (pH 7.8). Increasing the<br />
volume <strong>of</strong> the reagent, produces a proportional increase<br />
in the absorbance <strong>of</strong> the reaction product up to 0.8 mL<br />
<strong>and</strong> remains constant up to 1.2, after which further<br />
increase produces a gradual decrease in the absorbance<br />
value. There<strong>for</strong>e, 1 mL <strong>of</strong> 0.2% w/v <strong>of</strong> NBD-Cl solution was<br />
chosen as the optimal volume <strong>of</strong> the reagent (Figure 5).<br />
Effect <strong>of</strong> heating temperature<br />
Different temperature settings were used with constant<br />
heating time. Increasing the temperature <strong>of</strong> the water<br />
bath was found to produce a proportional increase in<br />
the absorbance <strong>of</strong> the reaction product up to 55°C <strong>and</strong><br />
remained constant until 65°C after which further<br />
increase in the temperature produces a gradual decrease<br />
in the absorbance value, so the optimum temperature<br />
<strong>for</strong> study was 60°C ± 5°C (Figure 6).<br />
Effect <strong>of</strong> time<br />
The time <strong>of</strong> heating is an essential part <strong>of</strong> the experiment.<br />
Different time intervals were tested to ascertain<br />
the time after which the solution attains its highest<br />
absorbance. It was found that after 25 min, the reaction<br />
product reaches the highest absorbance (Figure 7). It<br />
was observed that heating time <strong>for</strong> 25 min is adequate<br />
<strong>and</strong> the absorbance <strong>of</strong> the reaction product is stable <strong>for</strong><br />
about 40 min. at room temperature.<br />
The fluorescence intensity or absorbance value <strong>of</strong> the<br />
hydrolysis product <strong>of</strong> NBD-Cl, namely,4-hydroxy-7-<br />
nitrobenzo-2-oxa-1,3-diazole (NBD-OH) is quenched by<br />
decreasing the pH <strong>of</strong> the reaction medium to less than<br />
1. There<strong>for</strong>e, acidification <strong>of</strong> the reaction mixture prior<br />
to measurement <strong>of</strong> the fluorescence intensity or absorbance<br />
value remarkably decreased the background fluorescence<br />
or absorbance due to the <strong>for</strong>mation <strong>of</strong> NBD-<br />
OH without affecting the drug reagent adduct, hence<br />
the sensitivity was increased.<br />
Absorbane<br />
1.400<br />
1.200<br />
1.000<br />
0.800<br />
0.600<br />
0.400<br />
0.200<br />
0.000<br />
7.0 7.5 8.0 8.5 9.0 9.5<br />
pH<br />
Figure 4 Effect <strong>of</strong> pH <strong>of</strong> borate buffer 0.2 M on the<br />
absorbance <strong>of</strong> the reaction product <strong>of</strong> SER (20 μg/mL) with<br />
NBD-Cl.<br />
Absorbane<br />
1.400<br />
1.200<br />
1.000<br />
0.800<br />
0.600<br />
0.400<br />
0.200<br />
0.000<br />
0.0 0.5 1.0 1.5 2.0<br />
Volume <strong>of</strong> 0.2% NBD-Cl (ml)<br />
Figure 5 Effect <strong>of</strong> volume <strong>of</strong> NBD-Cl 0.2% (w/v) on the<br />
absorbance <strong>of</strong> the reaction product <strong>of</strong> SER (20 μg/mL) with<br />
NBD-Cl.
Walash et al. Chemistry Central Journal 2011, 5:61<br />
http://journal.chemistrycentral.com/content/5/1/61<br />
Page 5 <strong>of</strong> 11<br />
1.400<br />
1.200<br />
Analytical parameters <strong>for</strong> Sertraline<br />
Validation <strong>of</strong> the proposed <strong>method</strong>s<br />
The validity <strong>of</strong> the <strong>method</strong>s was tested regarding linearity,<br />
specificity, accuracy, repeatability <strong>and</strong> precision according<br />
to ICH Q2B recommendations [22].<br />
Linearity<br />
The absorbance-concentration plot was linear over the<br />
range <strong>of</strong> 2-24 μg/mL with minimum detection limit<br />
(LOD) <strong>of</strong> 0.18 μg/mL. While, the fluorescenceconcentration<br />
plot was found to be linear over the range<br />
<strong>of</strong> 0.25-5 μg/mL with LOD <strong>of</strong> 0.07 μg/mL. Linear regression<br />
analysis <strong>of</strong> the data gave the following equations:<br />
Absorbane<br />
1.000<br />
0.800<br />
0.600<br />
0.400<br />
A = 0.0389 + 0.0352 C (r = 0.9999)<br />
F = 19.038 + 31.814 C (r = 0.9999)<br />
0.200<br />
0.000<br />
45.0 55.0 65.0 75.0 85.0 95.0<br />
Temp. (°C)<br />
Figure 6 Effect <strong>of</strong> heating temperature on the absorbance <strong>of</strong><br />
the reaction product <strong>of</strong> SER (20 μg/mL) with NBD-Cl.<br />
Effect <strong>of</strong> diluting solvent<br />
Dilution with different solvents such as methanol, water,<br />
acetone, dimethylsulfoxide <strong>and</strong> dimethyl<strong>for</strong>mamide was<br />
studied. The highest absorbance value was achieved<br />
upon diluting with methanol.<br />
Effect <strong>of</strong> surfactant<br />
The influence <strong>of</strong> concentration <strong>of</strong> different surfactants on<br />
the absorbance <strong>of</strong> the reaction product was studied hopefully<br />
they may enhance the absorbance. It was found that<br />
by using different concentrations <strong>of</strong> sodium dodecyl sulphate<br />
or cetrimide, there was a negligible increase in the<br />
absorbance, while using gelatine decreases the absorbance;<br />
there<strong>for</strong>e the study was per<strong>for</strong>med omitting any surfactant.<br />
Absorbane<br />
1.400<br />
1.200<br />
1.000<br />
0.800<br />
0.600<br />
0.400<br />
0.200<br />
0.000<br />
0.0 10.0 20.0 30.0 40.0<br />
Time (min)<br />
Figure 7 Effect <strong>of</strong> heating time on the absorbance <strong>of</strong> the<br />
reaction product <strong>of</strong> SER (20 μg/mL) with NBD-Cl.<br />
Where A is the absorbance in 1-cm cell, F is the corrected<br />
fluorescence intensity, <strong>and</strong> C is the concentration<br />
<strong>of</strong> the drug in μg/mL.<br />
The limits <strong>of</strong> quantification (LOQ) <strong>and</strong> the limits <strong>of</strong><br />
detection (LOD) were calculated according to ICH Q2B<br />
[22] using the following equations:<br />
LOQ = 10Sa/b LOD = 3.3Sa/b<br />
Where Sa = The st<strong>and</strong>ard deviation <strong>of</strong> the intercept <strong>of</strong><br />
regression line<br />
b = Slope <strong>of</strong> the calibration curve.<br />
The results are shown in Table 1.<br />
LOQ were 0.56 <strong>and</strong> 0.21 μg/mL <strong>for</strong> <strong>method</strong>s I <strong>and</strong> II<br />
respectively, while LOD were 0.18 <strong>and</strong> 0.07 μg/mL <strong>for</strong><br />
<strong>method</strong>s I <strong>and</strong> II respectively.<br />
These small values allowed the determination <strong>of</strong> SER<br />
in spiked human plasma using <strong>method</strong> II.<br />
The proposed <strong>method</strong>s were evaluated by studying the<br />
accuracy as percent relative error (% Er) (table 1) <strong>and</strong><br />
precision as percent relative st<strong>and</strong>ard deviation (% RSD)<br />
<strong>and</strong> the results are shown in table 1. The small values <strong>of</strong><br />
% Er <strong>and</strong> % RSD indicates high accuracy <strong>and</strong> high precision<br />
<strong>of</strong> the proposed <strong>method</strong>s.<br />
Accuracy<br />
To test the validity <strong>of</strong> the proposed <strong>method</strong>s, they were<br />
applied to the determination <strong>of</strong> pure sample <strong>of</strong> SER<br />
over the working concentration ranges. The results<br />
obtained were in good agreement with those obtained<br />
using reference <strong>method</strong> [23]. Using Student’s t-test<strong>and</strong><br />
variance ratio F-test [25], revealed no significant difference<br />
between the per<strong>for</strong>mance <strong>of</strong> both <strong>method</strong>s <strong>and</strong><br />
reference <strong>method</strong> regarding the accuracy <strong>and</strong> precision,<br />
respectively. The reference <strong>method</strong> recommended an<br />
HPLC determination <strong>of</strong> SER in pure <strong>and</strong> dosage <strong>for</strong>ms<br />
using a mixture <strong>of</strong> 35% acetonitrile: methanol (92:8, v/v)<br />
<strong>and</strong> 65% <strong>of</strong> sodium acetate buffer at pH 4.5 as mobile<br />
phase with UV detection at 230 nm.<br />
The validity <strong>of</strong> the two <strong>method</strong>s were evaluated by<br />
statistical analysis <strong>of</strong> the regression lines regarding the<br />
st<strong>and</strong>ard deviation <strong>of</strong> the residuals (S y/x ), the st<strong>and</strong>ard<br />
deviation <strong>of</strong> the intercept (S a ) <strong>and</strong> st<strong>and</strong>ard deviation <strong>of</strong><br />
the slope (S b ).TheresultsaregiveninTable1.The<br />
small values <strong>of</strong> the figures point out to the low scattering<br />
<strong>of</strong> the calibration graph <strong>and</strong> the precision <strong>of</strong> the<br />
<strong>method</strong>s.
Walash et al. Chemistry Central Journal 2011, 5:61<br />
http://journal.chemistrycentral.com/content/5/1/61<br />
Page 6 <strong>of</strong> 11<br />
Table 1 Per<strong>for</strong>mance data <strong>of</strong> the proposed <strong>method</strong><br />
Parameter Spectr<strong>of</strong>luorimetric Method Spectrophotometric Method Ref. <strong>method</strong> [23]<br />
-concentration range (μg/mL ). 0.25-5 2-24<br />
-LOD (μg/mL ). 0.069 0.184<br />
-LOQ (μg/mL). 0.209 0.558<br />
-Correlation coefficient ( r). 0.9999 0.9999<br />
-Slope 31.8 0.035<br />
-Intercept 19.038 0.039<br />
-S y/x 0.928 2.72 × 10 -3<br />
-S a 0.664 1.96 × 10 -3<br />
-S b 0.221 1.387 × 10 -4<br />
-% Error 0.29 0.21<br />
-%RSD 0.65 0.51<br />
-No.<strong>of</strong> Experiments. 5 6 3<br />
-Mean found (%) 100.12 100.74 100<br />
± SD. 0.65 0.51 0.31<br />
-Student’s t-value. 0.275 (2.45) 2.216 (2.37)<br />
-Variance ratio F-test. 4.352 (19.25) 2.762 (19.30)<br />
-Applications. tablet preparations <strong>and</strong> spiked human plasma<br />
N.B.<br />
-S y/x =st<strong>and</strong>ard deviation <strong>of</strong> the residuals.<br />
-S a = st<strong>and</strong>ard deviation <strong>of</strong> the intercept <strong>of</strong> regression line.<br />
-S b = st<strong>and</strong>ard deviation <strong>of</strong> the slope <strong>of</strong> regression line<br />
-% Error = RSD%/√ n.<br />
- Figures between parentheses are the tabulated t <strong>and</strong> F values respectively, at p = 0.05.[25]<br />
Precision<br />
Repeatability<br />
The repeatability was per<strong>for</strong>med by applying the proposed<br />
<strong>method</strong>s <strong>for</strong> the determination <strong>of</strong> two concentrations<br />
<strong>of</strong> SER in pure <strong>for</strong>m on three successive times,<br />
<strong>and</strong> the results are listed in Table 2.<br />
Intermediate precision<br />
It was per<strong>for</strong>med through repeated analysis <strong>of</strong> SER in<br />
pure <strong>for</strong>m, using the concentrations shown in Table 2<br />
<strong>for</strong> a period <strong>of</strong> 3 successive days. The results are also<br />
summarized in Table 2.<br />
Robustness <strong>of</strong> the <strong>method</strong><br />
The robustness <strong>of</strong> the <strong>method</strong>s adopted is demonstrated<br />
by the constancy <strong>of</strong> the fluorescence intensity/absorbance<br />
value with the deliberated minor changes in the experimental<br />
parameters such as, change in pH 7.8 ±0.1, change<br />
in the volume <strong>of</strong> NBD-Cl (0.2% w/v), 1.0 ± 0.2 mL, the<br />
change in reaction time 25 ± 5 min. These minor changes<br />
that may take place during the experimental operation<br />
didn’t affect the fluorescence intensity or the absorbance<br />
value <strong>of</strong> the reaction products.<br />
Pharmaceutical Applications<br />
The proposed <strong>method</strong>s were then applied to the determination<br />
<strong>of</strong> SER in its tablets. The <strong>method</strong>s were tested<br />
<strong>for</strong> linearity, selectivity <strong>and</strong> accuracy according to ICH<br />
Q2B recommendations [22].<br />
Selectivity<br />
The selectivity <strong>of</strong> the <strong>method</strong> was investigated by observing<br />
any interference encountered from the common<br />
tablet excepients, such as talc, lactose, starch, avisil,<br />
gelatine, <strong>and</strong> magnesium stearate. These excepients did<br />
not interfere with the proposed <strong>method</strong>s. As revealed by<br />
a blank experiment using tablets additives but omitting<br />
sertraline.<br />
Accuracy<br />
The results <strong>of</strong> the pharmaceutical applications <strong>of</strong> the<br />
proposed <strong>method</strong>s were statistically compared with<br />
those obtained using the reference <strong>method</strong> [23]. Statistical<br />
analysis [25], <strong>of</strong> the results, using Student’s t-test<br />
<strong>and</strong> variance ratio F-test revealed no significant difference<br />
between the per<strong>for</strong>mance <strong>of</strong> the proposed <strong>and</strong><br />
reference <strong>method</strong>s regarding the accuracy <strong>and</strong> precision,<br />
respectively (Table 3).<br />
Analysis <strong>of</strong> Biological fluids<br />
The high sensitivity <strong>of</strong> the proposed fluorimetric <strong>method</strong><br />
allowed the determination <strong>of</strong> SER in spiked human<br />
plasma (Figure 8). Sertraline is given orally in a dose <strong>of</strong><br />
100 mg three times daily; this leads to a final blood level<br />
concentration <strong>of</strong> about 0.25 μg/mL i.e can be determined<br />
by the proposed <strong>method</strong>. The results are shown<br />
in Table 4. The extraction procedure described by Kim<br />
et.al [26] was adopted here. The results are satisfactorily<br />
accurate <strong>and</strong> precise.<br />
Precision<br />
The within-day precision was evaluated through replicate<br />
analysis <strong>of</strong> plasma samples spiked with increasing<br />
concentrations <strong>of</strong> the drug. The percentage recoveries
Walash et al. Chemistry Central Journal 2011, 5:61<br />
http://journal.chemistrycentral.com/content/5/1/61<br />
Page 7 <strong>of</strong> 11<br />
Table 2 Validation <strong>of</strong> the proposed <strong>method</strong> <strong>for</strong> the determination <strong>of</strong> SER in pure <strong>for</strong>m<br />
Sample concentration % recovery (repeatability) % recovery Intermediate precision<br />
Method I<br />
12 μg/mL 100 101.34<br />
102 102<br />
100.9 102<br />
X’ 100.78 101.78<br />
±SD 0.90 0.47<br />
%RSD 0.90 0.47<br />
% Error 0.45 0.26<br />
20 μg/mL 101 100<br />
100.55 99.76<br />
99 98.56<br />
X’ 100.18 99.44<br />
±SD 1.1 0.85<br />
%RSD 1.1 0.85<br />
% Error 0.63 100<br />
Method II<br />
2 μg/mL 98.50 102<br />
98.43 101.5<br />
99 101.8<br />
X’ 98.64 101.77<br />
±SD 0.40 0.21<br />
%RSD 0.40 0.21<br />
% Error 0.24 0.12<br />
4 μg/mL 99 99<br />
99.88 98.5<br />
98.88 100<br />
X’ 99.25 99.17<br />
±SD 0.69 1.06<br />
%RSD 0.69 1.06<br />
% Error 0.40 0.62<br />
Table 3 Application <strong>of</strong> the proposed <strong>method</strong>s to the determination <strong>of</strong> SER in tablets<br />
preparation Spectrophotometric <strong>method</strong> Ref. <strong>method</strong> [23]<br />
Amount taken (μg/mL) % found Amount taken (μg/mL) % found<br />
Seserine tablets (56.0 mg SER HCl/Tablet equivalent to 50.0 mg SER) 12.0 100.76 0.5 100.36<br />
20.0 99.05 1.0 99.87<br />
24.0 100.00 2.0 99.56<br />
X - ± SD 99.94 ± 0.54 99.93 ± 0.40<br />
Student’s t test 0.610<br />
Variance ratio F test 5.824<br />
Serlift tablets (100.0 mg SER HCL/Tablet) 12.0 101.00 0.5 99.65<br />
20.0 100.05 1.0 100.89<br />
24.0 100.50 2.0 100.25<br />
X - ± SD 100.52 ± 0.32 100.26 ± 0.62<br />
Student’s t test 0.562<br />
Variance ratio F test 1.702<br />
Lustral tablets (50.0 mg <strong>of</strong> SER/Table) 12.0 98.430 0.5 100.23<br />
20.0 98.187 1.0 100.43<br />
24.0 98.850 2.0 98.51<br />
X - ± SD 98.49 ± 0.17 99.72 ± 1.06
Walash et al. Chemistry Central Journal 2011, 5:61<br />
http://journal.chemistrycentral.com/content/5/1/61<br />
Page 8 <strong>of</strong> 11<br />
Table 3 Application <strong>of</strong> the proposed <strong>method</strong>s to the determination <strong>of</strong> SER in tablets (Continued)<br />
Student’s t test 1.930<br />
Variance ratio F test 9.903<br />
Spectr<strong>of</strong>luorimetric <strong>method</strong><br />
Seserine tablets (56.0 m g SER HCl/Tablet equivalent to 50.0 mg SER) 2.0 99.99 0.5 100.36<br />
3.0 100.05 1.0 99.87<br />
5.0 98.55 2.0 99.56<br />
X - ± SD 99.53 ± 1.06 99.93 ± 0.40<br />
Student’s t test 0.737<br />
Variance ratio F test 4.433<br />
Serlift tablets (100 0 mg SER HCL/Tablet 2.0 99.60 0.5 99.65<br />
3.0 98.56 1.0 100.89<br />
5.0 100.00 2.0 100.25<br />
X - ± SD 99.39 ± 1.02 100.26 ± 0.62<br />
Student’s t test 1.569<br />
Variance ratio F test 1.437<br />
Lustral tablets (50.0 mg <strong>of</strong> SER/Tablet) 2.0 101.05 0.5 100.23<br />
3.0 100.55 1.0 100.43<br />
5.0 99.56 2.0 98.51<br />
X - ± SD 100.39 ± 0.70 99.72 ± 1.06<br />
Student’s t test 0.884<br />
Variance ratio F test 1.938<br />
N.B.:<br />
The tabulated values <strong>of</strong> t <strong>and</strong> F are (2.78) <strong>and</strong> (19.00) respectively, at p = 0.05. [25]<br />
Each result is the average <strong>of</strong> three separate determinations.<br />
based on the average <strong>of</strong> five separate determinations<br />
were 101.05 ± 1.65, thus <strong>indicating</strong> the high precision <strong>of</strong><br />
the <strong>method</strong> (Table 4).<br />
The inter-day precision was also evaluated through<br />
replicate analysis <strong>of</strong> plasma samples spiked with 0.4 μg/<br />
mL <strong>of</strong> drug on three successive days. The percentage<br />
recoveries based on the average <strong>of</strong> four separate determinations<br />
were 101.94 ± 1.194. The results are also<br />
shown in Table 4.<br />
Fluorescence Intensity<br />
70<br />
60<br />
50<br />
40<br />
30<br />
20<br />
10<br />
d<br />
c<br />
b<br />
a<br />
0<br />
500 550 600 650 700<br />
Wavelength (nm.)<br />
Figure 8 Fluorescence emission spectra <strong>of</strong> plasma spiked with<br />
SER. (a) Blank, (b) 0.25 μg/mL, (c) 0.3 μg/mL, <strong>and</strong> (d) 0.35 μg/mL.<br />
Mechanism <strong>of</strong> the reaction<br />
The stoichiometry <strong>of</strong> the reaction was studied adopting<br />
the limiting logarithmic <strong>method</strong> [27]. The absorbance<br />
<strong>of</strong> the reaction product was alternatively<br />
measured in the presence <strong>of</strong> excess <strong>of</strong> either NBD Cl<br />
or SER. A plot <strong>of</strong> log absorbance versus log [NBD-Cl]<br />
<strong>and</strong> log [SER] gave straight lines, the values <strong>of</strong> the<br />
slopes were 0.79 <strong>and</strong> 0.83 respectively (Figure 9).<br />
Hence, it is concluded that, the molar reactivity <strong>of</strong> the<br />
reaction is 0.79/0.83, i.e. the reaction proceeds in the<br />
ratio<strong>of</strong>1:1.Byanalogytopreviousstudy[16],itis<br />
confirmed that one molecule <strong>of</strong> the drug reacts with<br />
one molecule <strong>of</strong> NBD-Cl. Sertraline in alkaline medium<br />
reacts with NBD-Cl through its secondary amino<br />
group to give the following final reaction product. A<br />
schematic proposal <strong>of</strong> the reaction pathway is given in<br />
Scheme 1.<br />
Stability indication <strong>of</strong> the <strong>method</strong><br />
Forced degradation studies <strong>of</strong> SER<br />
In order to establish whether the analytical <strong>method</strong> was<br />
<strong>stability</strong>-<strong>indicating</strong> or not, SER was exposed to different<br />
<strong>for</strong>ced degradation studies. The <strong>stability</strong> <strong>of</strong> SER has been<br />
studied under extreme challenge conditions as well as the<br />
more traditional pharmaceutical challenge conditions.<br />
Methanolwasusedasadilutingsolventinall<strong>for</strong>ced<br />
degradation studies. The drug was found to be highly
Walash et al. Chemistry Central Journal 2011, 5:61<br />
http://journal.chemistrycentral.com/content/5/1/61<br />
Page 9 <strong>of</strong> 11<br />
Table 4 Application <strong>of</strong> the proposed spectr<strong>of</strong>luorimetric <strong>method</strong> to the determination <strong>of</strong> SER in spiked human plasma.<br />
Sample Amount added (μg/mL) Amount found (μg/mL) % Recovery<br />
1-Plasma (intra-day precision)<br />
0.2 0.209 104.50<br />
0.25 0.242 96.80<br />
0.30 0.295 98.33<br />
0.35 0.347 99.14<br />
0.40 0.407 101.75<br />
Mean ± SD 100.10<br />
3.04<br />
2-Plasma (inter-day precision) 0.30 0.270 90.00<br />
0.30 0.270 90.00<br />
0.30 0.280 93.33<br />
Mean ± SD 91.11<br />
1.92<br />
N.B.:<br />
Each result is the average <strong>of</strong> three separate determinations.<br />
stable under <strong>for</strong>ced alkaline, acidic or photolytic degradation<br />
conditions as revealed from the constant absorbance<br />
values <strong>of</strong> samples treated with concentrated solutions <strong>of</strong><br />
NaOH or HCl <strong>and</strong> UV-light.<br />
A .<br />
Log A<br />
-0.1<br />
-0.2<br />
-0.3<br />
-0.4<br />
-0.5<br />
-0.6<br />
-4.00 -3.75 -3.50 -3.25 -3.00 -2.75<br />
Log [NBD-Cl]<br />
Oxidative degradation studies<br />
Degradation kinetics study<br />
For the kinetic study, 0.1% (v/v) <strong>of</strong> hydrogen peroxide was<br />
used <strong>for</strong> the oxidative degradation <strong>of</strong> the drug. The degradation<br />
was found to follow first order kinetics <strong>and</strong> to be<br />
temperature dependent (Figure 10). The apparent first<br />
order degradation rate constant (K obs )<strong>and</strong>thehalflife<br />
time (t 1/2 ) at each temperature were calculated (Table 5).<br />
Plotting log K obs values versus 1/T, the Arrhenius plot was<br />
obtained (Figure 11). The activation energy was calculated<br />
<strong>and</strong> found to be 6.38 k.Cal.Mol -1 .<br />
The tolerance limit (concentration <strong>of</strong> interfering substance<br />
causing 3.0% relative error) <strong>of</strong> the degradation product<br />
was measured after mixing increasing concentrations<br />
<strong>of</strong> the degradation product with 10 μg/mL pure SER. The<br />
tolerance limit was found to be 20%, i.e. up to 20% from<br />
the degradation product will not cause interference in the<br />
proposed spectrophotometric <strong>method</strong> (Table 6).<br />
B .<br />
-0.25<br />
Pathway <strong>of</strong> degradation<br />
By analogy to previous report [28] discussing the degradation<br />
<strong>of</strong> isradipine (containing secondary amino group)<br />
by hydrogen peroxide, it is suggested that the<br />
Log A<br />
-0.50<br />
-0.75<br />
-1.00<br />
0.0 0.5 1.0 1.5<br />
Log [sertraline]<br />
Figure 9 Limiting logarithmic plots <strong>for</strong> the molar reactivity <strong>of</strong><br />
SER with NBD-Cl. (A) log A vs log [NBD-Cl]. (B) log A vs log [SER].<br />
Scheme 1 Proposed reaction pathway between NBD-Cl <strong>and</strong><br />
sertraline.
Walash et al. Chemistry Central Journal 2011, 5:61<br />
http://journal.chemistrycentral.com/content/5/1/61<br />
Page 10 <strong>of</strong> 11<br />
Log a/a-x<br />
1.25<br />
1.00<br />
0.75<br />
0.50<br />
A<br />
B<br />
C<br />
D<br />
0.25<br />
0.00<br />
0 10 20 30 40 50 60 70<br />
Time(min.)<br />
Figure 10 Semilogarithmic plot <strong>of</strong> SER (20.0 μg/mL) versus<br />
different heating times with 0.1% (v/v) H 2 O 2 then with 0.2%<br />
NBD-Cl using the above conditions. (A = 80°C, B = 70°C, C = 60°<br />
C, D = 50°C ).<br />
Table 5 Effect <strong>of</strong> temperature on the kinetic parameters<br />
<strong>of</strong> SER<br />
Temperature (°C) K (min. -1 ) T 1/2 (min.) Ea (K.Cal.Mol -1 )<br />
50°C 0.018 38.58<br />
60°C 0.023 30.13 5.33<br />
70°C 0.033 21.00 8.19<br />
80°C 0.042 16.63 5.62<br />
X’ = 6.38<br />
Log k<br />
-1.25<br />
-1.50<br />
-1.75<br />
-2.00<br />
2.7 2.8 2.9 3.0 3.1 3.2 3.3<br />
1\T x 10 -3<br />
Figure 11 Arrhenius plot <strong>for</strong> the degradation <strong>of</strong> SER (20.0 μg/<br />
mL) in 0.1%(v/v) H 2 O 2 .<br />
Table 6 Determination <strong>of</strong> SER in presence <strong>of</strong> its oxidative<br />
degradation product by the proposed<br />
spectrophotometric <strong>method</strong><br />
Pure SER concentration<br />
(μg/mL)<br />
Degraded SER concentration<br />
added (μg/mL)<br />
%<br />
Found<br />
10 μg/mL 0.5 100.48<br />
1.0 102.10<br />
1.5 99.68<br />
2.0 100.81<br />
2.5 93.35<br />
3.0 81.59<br />
Scheme 2 Proposed oxidative degradation pathway <strong>of</strong><br />
sertraline with hydrogen peroxide.<br />
degradation pathway is via the<strong>for</strong>mation<strong>of</strong>N-oxide<br />
derivative (Scheme 2).<br />
Conclusion<br />
Two sensitive, simple <strong>and</strong> time saving <strong>method</strong>s were<br />
developed <strong>for</strong> the determination <strong>of</strong> SER either per se or in<br />
pharmaceutical preparations. By virtue <strong>of</strong> high sensitivity<br />
<strong>of</strong> the proposed fluorimetric <strong>method</strong>, it could be applied<br />
to the determination <strong>of</strong> SER in spiked human plasma with<br />
good accuracy <strong>and</strong> precision. The spectrophotometric<br />
<strong>method</strong> is also considered as <strong>stability</strong> <strong>indicating</strong> assay.<br />
Authors’ contributions<br />
MIW designed the proposed <strong>method</strong> <strong>and</strong> analyzed the data statistically. FFB<br />
proposed, planned <strong>and</strong> supervised the whole work. NME coordinated the<br />
study <strong>and</strong> modified the text. HE carried out the experimental work. All<br />
authors read <strong>and</strong> approved the final manuscript.<br />
Competing interests<br />
The authors declare that they have no competing interests.<br />
Received: 29 July 2011 Accepted: 13 October 2011<br />
Published: 13 October 2011<br />
References<br />
1. Nickell PV, Ward HE, Booth RG: Antianxiety agents. In Burger’s Medicinal<br />
Chemistry <strong>and</strong> Drug Discovery. Volume 5. Edited by: Wolff ME. John Wiley<br />
<strong>and</strong> Sons, New York; 1997:153-194.<br />
2. The British Pharmacopoeia 2009. The stationary <strong>of</strong>fice: London, Electronic<br />
version; 2009.<br />
3. Onal A, Kepekci SE, Cetin SM, Ertürk S: Spectrophotometric determination<br />
<strong>of</strong> certain antidepressants in pharmaceutical preparations. J AOAC Int<br />
2006, 89:966-971.<br />
4. Darwish IA: <strong>Development</strong> <strong>and</strong> <strong>validation</strong> <strong>of</strong> spectrophotometric <strong>method</strong>s<br />
<strong>for</strong> determination <strong>of</strong> fluoxetine, sertraline <strong>and</strong> paroxetine in<br />
pharmaceutical dosage <strong>for</strong>ms. J AOAC Int 2005, 88:38-45.<br />
5. Parasrampuria J: Sertraline hydrochloride. In Analytical Pr<strong>of</strong>iles <strong>of</strong> Drug<br />
Substances <strong>and</strong> Excipients. Volume 24. Edited by: Brittain HG. Academic Press:<br />
New York; 1996:443-486.<br />
6. Rogowsky D, Marr M, Long G, Moore C: Determination <strong>of</strong> sertraline <strong>and</strong><br />
desmethylsertraline in human serum using copolymeric bonded-phase<br />
extraction, liquid chromatography <strong>and</strong> gas chromatography-mass<br />
spectrometry. J Chromatogr Biomed Appl 1994, 655:138-141.<br />
7. Logan BK, Friel PN, Case GA: Analysis <strong>of</strong> sertraline (Zol<strong>of</strong>t) <strong>and</strong> its major<br />
metabolite in post-mortem specimens by gas <strong>and</strong> liquid<br />
chromatography. J Anal Toxicol 1994, 18:139-142.<br />
8. Fouda HG, Ronfeld RA, Weidler DJ: Gas-chromatographic - massspectrometric<br />
analysis <strong>and</strong> preliminary human pharmacokinetics <strong>of</strong><br />
sertraline, a new antidepressant drug. J Chromatogr Biomed Appl 1987,<br />
61:197-202.
Walash et al. Chemistry Central Journal 2011, 5:61<br />
http://journal.chemistrycentral.com/content/5/1/61<br />
Page 11 <strong>of</strong> 11<br />
9. Tremaine LM, Joerg EA: Automated gas-chromatographic - electroncapture<br />
assay <strong>for</strong> the selective serotonin uptake-blocker, sertraline. J<br />
Chromatogr Biomed Appl 1989, 88:423-429.<br />
10. Gupta RN, Dziurdzy SA: Therapeutic monitoring <strong>of</strong> sertraline. Clin Chem<br />
1994, 40:498-499.<br />
11. Wiener HL, Kramer HK, Reith MEA: Separation <strong>and</strong> determination <strong>of</strong><br />
sertraline <strong>and</strong> its metabolite, demethylsertraline, in mouse cerebral<br />
cortex by reversed-phase high-per<strong>for</strong>mance liquid chromatography. J<br />
Chromatogr Biomed Appl 1990, 92:467-472.<br />
12. Patel J, Spencer EP, Flangan RJ: HPLC <strong>of</strong> sertraline <strong>and</strong> norsertraline in<br />
plasma or serum. Biomed Chromtogr 1990, 10:351-354.<br />
13. McIntyre IM, King CV, Staikos V, Gall J, Drummer OH: A fatality involving<br />
moclobemide, sertraline, <strong>and</strong> pimozide. J Forensic Sci 1997, 42:951-953.<br />
14. El-Emam AA, Hansen SH, Moustafa MA, El-Ashry SM, El-Sherbiny DT:<br />
Determination <strong>of</strong> lisinopril in dosage <strong>for</strong>ms <strong>and</strong> spiked human plasma<br />
through derivatization with 7-chloro-4-nitrobenzo-2-oxa-1,3-diazole<br />
(NBD-C1) followed by spectrophotometry or HPLC with fluorimetric<br />
detection. J Pharm Biomed Anal 2004, 34:35-44.<br />
15. El-Enany N: Spectr<strong>of</strong>luorimetric <strong>and</strong> spectrophotometric determination <strong>of</strong><br />
gliclazide in pharmaceuticals by derivatization with 4-chloro-7-<br />
nitrobenzo-2-oxa-1,3-diazole. J AOAC Int 2003, 86:209-214.<br />
16. El-Enany N, Belal F, Rizk M: Kinetic spectrophotometric determination <strong>of</strong><br />
isoxsuprine in dosage <strong>for</strong>ms through derivatization with 4-chloro-7-<br />
nitrobenzo-2-oxa-1,3-diazole (NBD-Cl). Sci Pharm 2006, 74:99-119.<br />
17. El-Enany N, El-Sherbiny D, Belal F: Spectrophotometric,<br />
spectr<strong>of</strong>luorometric <strong>and</strong> HPLC determination <strong>of</strong> desloratadine in dosage<br />
<strong>for</strong>ms <strong>and</strong> human plasma. Chem Pharm Bull 2007, 55:1662-70.<br />
18. Ulu ST: Determination <strong>of</strong> tianeptine in human plasma using highper<strong>for</strong>mance<br />
liquid chromatography with fluorescence detection. J<br />
Chromatogr B 2006, 834:62-67.<br />
19. Erturk S, Cetin SM, Atmaca S, Ersoy L, Baktr G: A sensitive HPLC <strong>method</strong><br />
<strong>for</strong> the determination <strong>of</strong> Fluoxetine <strong>and</strong> Norfluoxetine in human plasma<br />
with fluorescence detection. Ther Drug Monit 2005, 27:38-43.<br />
20. Farshchia A, Ghiasi G, Bahrami G: High per<strong>for</strong>mance liquid<br />
chromatography determination <strong>of</strong> sertraline in human. Iranian Journal <strong>of</strong><br />
Pharmaceutical Sciences 2009, 5:171-178.<br />
21. Mahmoud AM, Darwish IA, Khalil NY: Fluorimetric study <strong>for</strong> the reaction<br />
between sertraline <strong>and</strong> 7-chloro-4-nitrobenzo-2-oxa-1,3-diazole: kinetics,<br />
mechanism <strong>and</strong> application <strong>for</strong> the determination <strong>of</strong> sertraline in<br />
tablets. J Fluorescence 2010, 20:607-13.<br />
22. ICH Harmonized Tripartite Guideline: Validation <strong>of</strong> Analytical Procedures.<br />
2005 [http://www.bi<strong>of</strong>orum.org.il/Uploads/Editor/karen/q2_r1_step4.pdf],<br />
Text <strong>and</strong> Methodology, Q2(R1), Current Step 4 Version, Parent Guidelines<br />
on Methodology .<br />
23. Malfará WR, Bertucci C, Costa Queiroz ME, Dreossi Carvalho SA, Pires Bianchi<br />
Mde L, Cesarino EJ, Crippa JA, Costa Queiroz RH: Reliable HPLC <strong>method</strong><br />
<strong>for</strong> therapeutic drug monitoring <strong>of</strong> frequently prescribed tricyclic <strong>and</strong><br />
nontricyclic antidepressants. J Pharm Biomed Anal 2007, 44:955-962.<br />
24. Miyano H, Toyo’oka T, Miyano H: Further studies on the reaction <strong>of</strong><br />
amines <strong>and</strong> proteins with 4-fluoro-7-nitrobenz<strong>of</strong>urazan. Anal Chim Acta<br />
1985, 170:81-87.<br />
25. Miller JN, Miller JC: Statistics <strong>and</strong> chemometrics <strong>for</strong> analytical chemistry. 5<br />
edition. Prentice Hall: Engl<strong>and</strong>; 2005, 39-73.<br />
26. Kim KM, Jung BH, Choi MH, Woo JS, Paeng KJ, Chung BC: Rapid <strong>and</strong><br />
sensitive determination <strong>of</strong> sertraline in human plasma using gas<br />
chromatography-mass spectrometry. J Chromatogr B Analyt Technol<br />
Biomed Life Sci 2002, 769:333-339.<br />
27. Rose J: Advanced physico-chemical experiments Pitman: London, Engl<strong>and</strong>;<br />
1964.<br />
28. Bartlett MG, Spell JC, Mathis PS, Elgany MF, El Zeany BE, Elkawy MA,<br />
Stewart JT: Determination <strong>of</strong> degradation products from the calciumchannel<br />
blocker isradipine. J Pharm Biomed Anal 1998, 18:335-345.<br />
doi:10.1186/1752-153X-5-61<br />
Cite this article as: Walash et al.: <strong>Development</strong> <strong>and</strong> <strong>validation</strong> <strong>of</strong><br />
<strong>stability</strong> <strong>indicating</strong> <strong>method</strong> <strong>for</strong> determination <strong>of</strong> sertraline following ICH<br />
guidlines <strong>and</strong> its determination in pharmaceuticals <strong>and</strong> biological fluids.<br />
Chemistry Central Journal 2011 5:61.<br />
Publish with ChemistryCentral <strong>and</strong> every<br />
scientist can read your work free <strong>of</strong> charge<br />
Open access provides opportunities to our<br />
colleagues in other parts <strong>of</strong> the globe, by allowing<br />
anyone to view the content free <strong>of</strong> charge.<br />
W. Jeffery Hurst, The Hershey Company.<br />
available free <strong>of</strong> charge to the entire scientific community<br />
peer reviewed <strong>and</strong> published immediately upon acceptance<br />
cited in PubMed <strong>and</strong> archived on PubMed Central<br />
yours you keep the copyright<br />
Submit your manuscript here:<br />
http://www.chemistrycentral.com/manuscript/