Household Production and Consumption in Finland 2001
Household Production and Consumption in Finland 2001
Household Production and Consumption in Finland 2001
You also want an ePaper? Increase the reach of your titles
YUMPU automatically turns print PDFs into web optimized ePapers that Google loves.
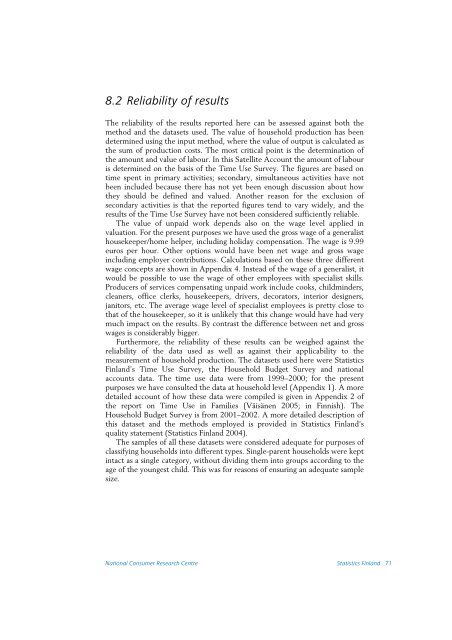
8.2 Reliability ofresults<br />
The reliability of the results reported here can be assessed aga<strong>in</strong>st both the<br />
method <strong>and</strong> the datasets used. The value of household production has been<br />
determ<strong>in</strong>ed us<strong>in</strong>g the <strong>in</strong>put method, where the value of output is calculated as<br />
the sum of production costs. The most critical po<strong>in</strong>t is the determ<strong>in</strong>ation of<br />
the amount <strong>and</strong> value of labour. In this Satellite Account the amount of labour<br />
is determ<strong>in</strong>ed on the basis of the Time Use Survey. The figures are based on<br />
time spent <strong>in</strong> primary activities; secondary, simultaneous activities have not<br />
been <strong>in</strong>cluded because there has not yet been enough discussion about how<br />
they should be def<strong>in</strong>ed <strong>and</strong> valued. Another reason for the exclusion of<br />
secondary activities is that the reported figures tend to vary widely, <strong>and</strong> the<br />
results of the Time Use Survey have not been considered sufficiently reliable.<br />
The value of unpaid work depends also on the wage level applied <strong>in</strong><br />
valuation. For the present purposes we have used the gross wage of a generalist<br />
housekeeper/home helper, <strong>in</strong>clud<strong>in</strong>g holiday compensation. The wage is 9.99<br />
euros per hour. Other options would have been net wage <strong>and</strong> gross wage<br />
<strong>in</strong>clud<strong>in</strong>g employer contributions. Calculations based on these three different<br />
wage concepts are shown <strong>in</strong> Appendix 4. Instead of the wage of a generalist, it<br />
would be possible to use the wage of other employees with specialist skills.<br />
Producers of services compensat<strong>in</strong>g unpaid work <strong>in</strong>clude cooks, childm<strong>in</strong>ders,<br />
cleaners, office clerks, housekeepers, drivers, decorators, <strong>in</strong>terior designers,<br />
janitors, etc. The average wage level of specialist employees is pretty close to<br />
that of the housekeeper, so it is unlikely that this change would have had very<br />
much impact on the results. By contrast the difference between net <strong>and</strong> gross<br />
wages is considerably bigger.<br />
Furthermore, the reliability of these results can be weighed aga<strong>in</strong>st the<br />
reliability of the data used as well as aga<strong>in</strong>st their applicability to the<br />
measurement of household production. The datasets used here were Statistics<br />
F<strong>in</strong>l<strong>and</strong>’s Time Use Survey, the <strong>Household</strong> Budget Survey <strong>and</strong> national<br />
accounts data. The time use data were from 1999–2000; for the present<br />
purposes we have consulted the data at household level (Appendix 1). A more<br />
detailed account of how these data were compiled is given <strong>in</strong> Appendix 2 of<br />
the report on Time Use <strong>in</strong> Families (Väisänen 2005; <strong>in</strong> F<strong>in</strong>nish). The<br />
<strong>Household</strong> Budget Survey is from <strong>2001</strong>–2002. A more detailed description of<br />
this dataset <strong>and</strong> the methods employed is provided <strong>in</strong> Statistics F<strong>in</strong>l<strong>and</strong>’s<br />
quality statement (Statistics F<strong>in</strong>l<strong>and</strong> 2004).<br />
The samples of all these datasets were considered adequate for purposes of<br />
classify<strong>in</strong>g households <strong>in</strong>to different types. S<strong>in</strong>gle-parent households were kept<br />
<strong>in</strong>tact as a s<strong>in</strong>gle category, without divid<strong>in</strong>g them <strong>in</strong>to groups accord<strong>in</strong>g to the<br />
age of the youngest child. This was for reasons of ensur<strong>in</strong>g an adequate sample<br />
size.<br />
National Consumer Research Centre Statistics F<strong>in</strong>l<strong>and</strong> 71


