

Household Production and Consumption in Finland 2001
Household Production and Consumption in Finland 2001
Household Production and Consumption in Finland 2001

You also want an ePaper? Increase the reach of your titles
YUMPU automatically turns print PDFs into web optimized ePapers that Google loves.
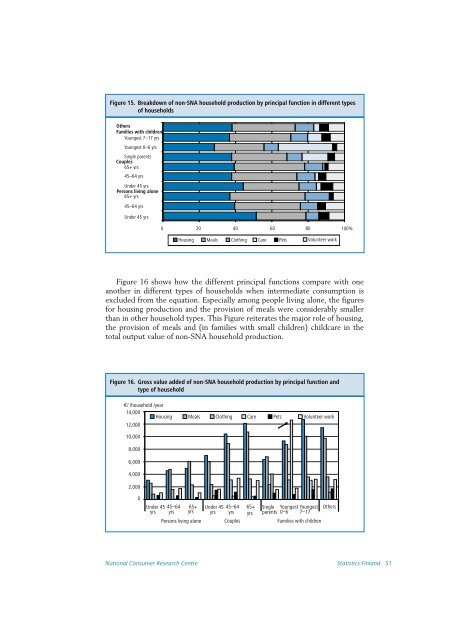
Figure 15. Breakdown of non-SNA household production by pr<strong>in</strong>cipal function <strong>in</strong> different types<br />
of households<br />
Others<br />
Families with children<br />
Youngest 7–17 yrs<br />
Youngest 0–6 yrs<br />
S<strong>in</strong>gle parents<br />
Couples<br />
65+ yrs<br />
45–64 yrs<br />
Under 45 yrs<br />
Persons liv<strong>in</strong>g alone<br />
65+ yrs<br />
45–64 yrs<br />
Under 45 yrs<br />
0 20 40 60 80 100%<br />
Hous<strong>in</strong>g Meals Cloth<strong>in</strong>g Care Pets Volunteer work<br />
Figure 16 shows how the different pr<strong>in</strong>cipal functions compare with one<br />
another <strong>in</strong> different types of households when <strong>in</strong>termediate consumption is<br />
excluded from the equation. Especially among people liv<strong>in</strong>g alone, the figures<br />
for hous<strong>in</strong>g production <strong>and</strong> the provision of meals were considerably smaller<br />
than <strong>in</strong> other household types. This Figure reiterates the major role of hous<strong>in</strong>g,<br />
the provision of meals <strong>and</strong> (<strong>in</strong> families with small children) childcare <strong>in</strong> the<br />
total output value of non-SNA household production.<br />
Figure 16. Gross value added of non-SNA household production by pr<strong>in</strong>cipal function <strong>and</strong><br />
type of household<br />
€/ /household /year<br />
14,000<br />
Hous<strong>in</strong>g Meals Cloth<strong>in</strong>g Care Pets Volunteer work<br />
12,000<br />
10,000<br />
8,000<br />
6,000<br />
4,000<br />
2,000<br />
0<br />
Under 45 45–64 65+ Under 45 45–64 65+ S<strong>in</strong>gle Youngest Youngest Others<br />
yrs yrs yrs yrs yrs yrs parents 0–6 7–17<br />
Persons liv<strong>in</strong>g alone Couples<br />
Families with children<br />
National Consumer Research Centre Statistics F<strong>in</strong>l<strong>and</strong> 51


