

Household Production and Consumption in Finland 2001
Household Production and Consumption in Finland 2001
Household Production and Consumption in Finland 2001

Create successful ePaper yourself
Turn your PDF publications into a flip-book with our unique Google optimized e-Paper software.
6 <strong>Household</strong> production <strong>in</strong> different<br />
types ofhouseholds<br />
In Chapter 5 above, household production was exam<strong>in</strong>ed at the national level.<br />
The discussion below describes household production <strong>in</strong> different types of<br />
households. In this analysis the figures can be presented <strong>in</strong> two different ways.<br />
First, we can look at the amount of production <strong>in</strong> one <strong>in</strong>dividual household<br />
<strong>and</strong> at how it breaks down between different pr<strong>in</strong>cipal functions <strong>in</strong> different<br />
types of households. This is a micro-level analysis. Secondly, we can exam<strong>in</strong>e<br />
different household types at the level of the national economy, <strong>in</strong> which case<br />
the results will also depend on the overall number of that particular type of<br />
household <strong>in</strong> the country. This approach allows us to compare the household<br />
production of, say, pensioner households <strong>and</strong> work<strong>in</strong>g-age households at the<br />
national level. The production <strong>and</strong> generation of <strong>in</strong>come accounts for each<br />
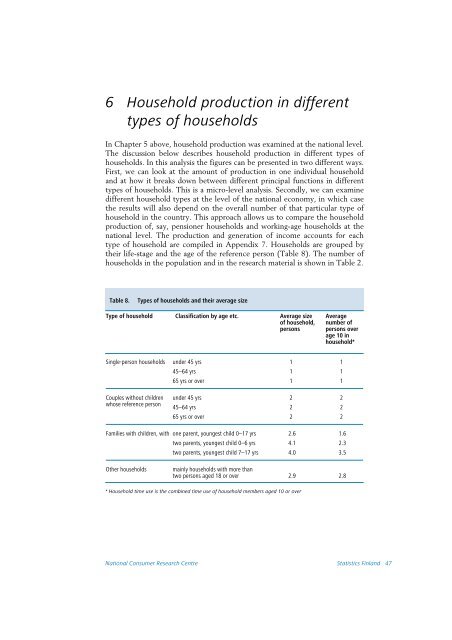
type of household are compiled <strong>in</strong> Appendix 7. <strong>Household</strong>s are grouped by<br />
their life-stage <strong>and</strong> the age of the reference person (Table 8). The number of<br />
households <strong>in</strong> the population <strong>and</strong> <strong>in</strong> the research material is shown <strong>in</strong> Table 2.<br />
Table 8.<br />
Types of households <strong>and</strong> their average size<br />
Type of household Classification by age etc. Average size<br />
of household,<br />
persons<br />
Average<br />
number of<br />
persons over<br />
age 10 <strong>in</strong><br />
household*<br />
S<strong>in</strong>gle-person households under 45 yrs 1 1<br />
45–64 yrs 1 1<br />
65 yrs or over 1 1<br />
Couples without children<br />
whose reference person<br />
under 45 yrs 2 2<br />
45–64 yrs 2 2<br />
65 yrs or over 2 2<br />
Families with children, with one parent, youngest child 0–17 yrs 2.6 1.6<br />
two parents, youngest child 0–6 yrs 4.1 2.3<br />
two parents, youngest child 7–17 yrs 4.0 3.5<br />
Other households<br />
ma<strong>in</strong>ly households with more than<br />
two persons aged 18 or over 2.92.8<br />
* <strong>Household</strong> time use is the comb<strong>in</strong>ed time use of household members aged 10 or over<br />
National Consumer Research Centre Statistics F<strong>in</strong>l<strong>and</strong> 47


