Annual Report 2007 - Komatsu
Annual Report 2007 - Komatsu Annual Report 2007 - Komatsu
Notes to Consolidated Financial Statements Komatsu Ltd. and Consolidated Subsidiaries 21. The Fair Value of Financial Instruments (1) Cash and Cash Equivalents, Time Deposits, Trade Notes and Accounts Receivables, Other Current Assets, Short- Term Debt, Trade Notes and Accounts Payables, and Other Current Liabilities The carrying amount approximates fair value because of the short maturity of these instruments. (2) Investment Securities The fair values of investment securities available for sale for which it is practicable to estimate fair value are based on quoted market prices. (3) Installment Receivables The fair values of installment receivables are based on the present value of future cash flows through maturity, discounted using estimated current interest rates. The fair values computed on such a basis approximate the carrying amounts (Note 5). (4) Long-Term Debt The fair values of each of the long-term debts are based on the quoted price in the most active market or the present value of future cash flows associated with each instrument discounted using the current borrowing rate for similar debt of comparable maturity. (5) Derivative Financial Instruments The fair values of derivative financial instruments, consisting principally of foreign currency contracts and interest swap agreements, are estimated by obtaining quotes from brokers. The carrying amounts and the estimated fair values of the financial instruments, including financial instruments not qualifying as hedge, as of March 31, 2007 and 2006, are summarized as follows: Millions of yen Thousands of U.S. dollars 2007 2006 2007 Carrying Estimated Carrying Estimated Carrying Estimated amount fair value amount fair value amount fair value Investment securities ¥108,590 ¥108,590 ¥ 95,159 ¥ 95,159 $ 920,254 $ 920,254 Long-term debt, including current portion 246,826 244,921 279,783 276,630 2,091,746 2,075,602 Derivatives: Forwards and options Assets 614 614 367 367 5,203 5,203 Liabilities 1,079 1,079 1,446 1,446 9,144 9,144 Interest rate swap, cross-currency swap and interest rate cap agreements Assets 285 285 1,511 1,511 2,415 2,415 Liabilities 2,192 2,192 3,041 3,041 18,576 18,576 Limitations Fair value estimates are made at a specific point in time, based on relevant market information and information about the financial instrument. These estimates are subjective in nature and involve uncertainties and matters of significant judgment and therefore cannot be determined with precision. Changes in assumptions could affect the estimates. 22. Business Segment Information Under SFAS No. 131, “Disclosures about Segments of an Enterprise and Related Information,” operating segments are defined as components of an enterprise about which separate financial information is available that is evaluated regularly by the chief operating decision maker, in deciding how to allocate resources and in assessing performance. The operating segments are managed separately because each operating segment represents a strategic business unit that offers different products and services. Komatsu operates on a worldwide basis with three operating segments: 1) Construction and mining equipment, 2) Industrial Machinery, Vehicles and Others, 3) Electronics. 82 Annual Report 2007
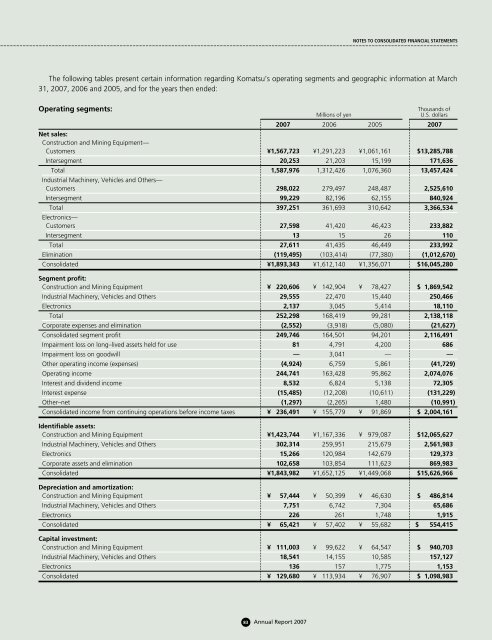
NOTES TO CONSOLIDATED FINANCIAL STATEMENTS The following tables present certain information regarding Komatsu’s operating segments and geographic information at March 31, 2007, 2006 and 2005, and for the years then ended: Operating segments: Thousands of Millions of yen U.S. dollars 2007 2006 2005 2007 Net sales: Construction and Mining Equipment— Customers ¥1,567,723 ¥1,291,223 ¥1,061,161 $13,285,788 Intersegment 20,253 21,203 15,199 171,636 Total 1,587,976 1,312,426 1,076,360 13,457,424 Industrial Machinery, Vehicles and Others— Customers 298,022 279,497 248,487 2,525,610 Intersegment 99,229 82,196 62,155 840,924 Total 397,251 361,693 310,642 3,366,534 Electronics— Customers 27,598 41,420 46,423 233,882 Intersegment 13 15 26 110 Total 27,611 41,435 46,449 233,992 Elimination (119,495) (103,414) (77,380) (1,012,670) Consolidated ¥1,893,343 ¥1,612,140 ¥1,356,071 $16,045,280 Segment profit: Construction and Mining Equipment ¥ 220,606 ¥ 142,904 ¥ 78,427 $ 1,869,542 Industrial Machinery, Vehicles and Others 29,555 22,470 15,440 250,466 Electronics 2,137 3,045 5,414 18,110 Total 252,298 168,419 99,281 2,138,118 Corporate expenses and elimination (2,552) (3,918) (5,080) (21,627) Consolidated segment profit 249,746 164,501 94,201 2,116,491 Impairment loss on long–lived assets held for use 81 4,791 4,200 686 Impairment loss on goodwill — 3,041 — — Other operating income (expenses) (4,924) 6,759 5,861 (41,729) Operating income 244,741 163,428 95,862 2,074,076 Interest and dividend income 8,532 6,824 5,138 72,305 Interest expense (15,485) (12,208) (10,611) (131,229) Other–net (1,297) (2,265) 1,480 (10,991) Consolidated income from continuing operations before income taxes ¥ 236,491 ¥ 155,779 ¥ 91,869 $ 2,004,161 Identifiable assets: Construction and Mining Equipment ¥1,423,744 ¥1,167,336 ¥ 979,087 $12,065,627 Industrial Machinery, Vehicles and Others 302,314 259,951 215,679 2,561,983 Electronics 15,266 120,984 142,679 129,373 Corporate assets and elimination 102,658 103,854 111,623 869,983 Consolidated ¥1,843,982 ¥1,652,125 ¥1,449,068 $15,626,966 Depreciation and amortization: Construction and Mining Equipment ¥ 57,444 ¥ 50,399 ¥ 46,630 $ 486,814 Industrial Machinery, Vehicles and Others 7,751 6,742 7,304 65,686 Electronics 226 261 1,748 1,915 Consolidated ¥ 65,421 ¥ 57,402 ¥ 55,682 $ 554,415 Capital investment: Construction and Mining Equipment ¥ 111,003 ¥ 99,622 ¥ 64,547 $ 940,703 Industrial Machinery, Vehicles and Others 18,541 14,155 10,585 157,127 Electronics 136 157 1,775 1,153 Consolidated ¥ 129,680 ¥ 113,934 ¥ 76,907 $ 1,098,983 83 Annual Report 2007
- Page 33 and 34: Research and Development We are pro
- Page 35 and 36: Global Manufacturing Operation for
- Page 37 and 38: change. These are the first updates
- Page 39 and 40: Financial Section Financial Review.
- Page 41 and 42: FINANCIAL REVIEW and mining equipme
- Page 43 and 44: FINANCIAL REVIEW wholly owned subsi
- Page 45 and 46: FINANCIAL REVIEW cash used in inves
- Page 47 and 48: FINANCIAL REVIEW 5 Environmental la
- Page 49 and 50: FINANCIAL REVIEW Interest Rate Risk
- Page 51 and 52: FIVE-YEAR SUMMARY Millions of yen (
- Page 53 and 54: CONSOLIDATED BALANCE SHEETS Thousan
- Page 55 and 56: Consolidated Statements of Sharehol
- Page 57 and 58: Notes to Consolidated Financial Sta
- Page 59 and 60: NOTES TO CONSOLIDATED FINANCIAL STA
- Page 61 and 62: NOTES TO CONSOLIDATED FINANCIAL STA
- Page 63 and 64: NOTES TO CONSOLIDATED FINANCIAL STA
- Page 65 and 66: NOTES TO CONSOLIDATED FINANCIAL STA
- Page 67 and 68: NOTES TO CONSOLIDATED FINANCIAL STA
- Page 69 and 70: NOTES TO CONSOLIDATED FINANCIAL STA
- Page 71 and 72: NOTES TO CONSOLIDATED FINANCIAL STA
- Page 73 and 74: NOTES TO CONSOLIDATED FINANCIAL STA
- Page 75 and 76: NOTES TO CONSOLIDATED FINANCIAL STA
- Page 77 and 78: NOTES TO CONSOLIDATED FINANCIAL STA
- Page 79 and 80: NOTES TO CONSOLIDATED FINANCIAL STA
- Page 81 and 82: NOTES TO CONSOLIDATED FINANCIAL STA
- Page 83: NOTES TO CONSOLIDATED FINANCIAL STA
- Page 87 and 88: NOTES TO CONSOLIDATED FINANCIAL STA
- Page 89 and 90: NOTES TO CONSOLIDATED FINANCIAL STA
- Page 91 and 92: Report of Independent Registered Pu
- Page 93 and 94: Directors, Auditors and Officers (A
- Page 95 and 96: KOMATSU GROUP INVESTMENT HOLDINGS S
- Page 97: 2-3-6 Akasaka, Minato-ku Tokyo 107-
NOTES TO CONSOLIDATED FINANCIAL STATEMENTS<br />
The following tables present certain information regarding <strong>Komatsu</strong>’s operating segments and geographic information at March<br />
31, <strong>2007</strong>, 2006 and 2005, and for the years then ended:<br />
Operating segments:<br />
Thousands of<br />
Millions of yen<br />
U.S. dollars<br />
<strong>2007</strong> 2006 2005 <strong>2007</strong><br />
Net sales:<br />
Construction and Mining Equipment—<br />
Customers ¥1,567,723 ¥1,291,223 ¥1,061,161 $13,285,788<br />
Intersegment 20,253 21,203 15,199 171,636<br />
Total 1,587,976 1,312,426 1,076,360 13,457,424<br />
Industrial Machinery, Vehicles and Others—<br />
Customers 298,022 279,497 248,487 2,525,610<br />
Intersegment 99,229 82,196 62,155 840,924<br />
Total 397,251 361,693 310,642 3,366,534<br />
Electronics—<br />
Customers 27,598 41,420 46,423 233,882<br />
Intersegment 13 15 26 110<br />
Total 27,611 41,435 46,449 233,992<br />
Elimination (119,495) (103,414) (77,380) (1,012,670)<br />
Consolidated ¥1,893,343 ¥1,612,140 ¥1,356,071 $16,045,280<br />
Segment profit:<br />
Construction and Mining Equipment ¥ 220,606 ¥ 142,904 ¥ 78,427 $ 1,869,542<br />
Industrial Machinery, Vehicles and Others 29,555 22,470 15,440 250,466<br />
Electronics 2,137 3,045 5,414 18,110<br />
Total 252,298 168,419 99,281 2,138,118<br />
Corporate expenses and elimination (2,552) (3,918) (5,080) (21,627)<br />
Consolidated segment profit 249,746 164,501 94,201 2,116,491<br />
Impairment loss on long–lived assets held for use 81 4,791 4,200 686<br />
Impairment loss on goodwill — 3,041 — —<br />
Other operating income (expenses) (4,924) 6,759 5,861 (41,729)<br />
Operating income 244,741 163,428 95,862 2,074,076<br />
Interest and dividend income 8,532 6,824 5,138 72,305<br />
Interest expense (15,485) (12,208) (10,611) (131,229)<br />
Other–net (1,297) (2,265) 1,480 (10,991)<br />
Consolidated income from continuing operations before income taxes ¥ 236,491 ¥ 155,779 ¥ 91,869 $ 2,004,161<br />
Identifiable assets:<br />
Construction and Mining Equipment ¥1,423,744 ¥1,167,336 ¥ 979,087 $12,065,627<br />
Industrial Machinery, Vehicles and Others 302,314 259,951 215,679 2,561,983<br />
Electronics 15,266 120,984 142,679 129,373<br />
Corporate assets and elimination 102,658 103,854 111,623 869,983<br />
Consolidated ¥1,843,982 ¥1,652,125 ¥1,449,068 $15,626,966<br />
Depreciation and amortization:<br />
Construction and Mining Equipment ¥ 57,444 ¥ 50,399 ¥ 46,630 $ 486,814<br />
Industrial Machinery, Vehicles and Others 7,751 6,742 7,304 65,686<br />
Electronics 226 261 1,748 1,915<br />
Consolidated ¥ 65,421 ¥ 57,402 ¥ 55,682 $ 554,415<br />
Capital investment:<br />
Construction and Mining Equipment ¥ 111,003 ¥ 99,622 ¥ 64,547 $ 940,703<br />
Industrial Machinery, Vehicles and Others 18,541 14,155 10,585 157,127<br />
Electronics 136 157 1,775 1,153<br />
Consolidated ¥ 129,680 ¥ 113,934 ¥ 76,907 $ 1,098,983<br />
83 <strong>Annual</strong> <strong>Report</strong> <strong>2007</strong>


