Annual Report 2007 - Komatsu
Annual Report 2007 - Komatsu
Annual Report 2007 - Komatsu

Create successful ePaper yourself
Turn your PDF publications into a flip-book with our unique Google optimized e-Paper software.
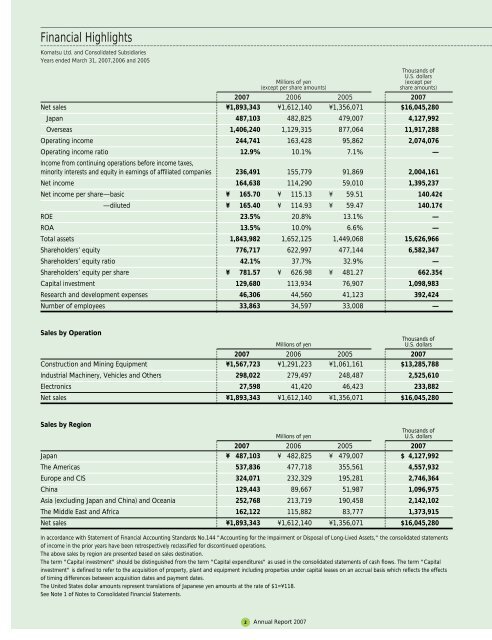
Financial Highlights<br />
<strong>Komatsu</strong> Ltd. and Consolidated Subsidiaries<br />
Years ended March 31, <strong>2007</strong>,2006 and 2005<br />
Thousands of<br />
U.S. dollars<br />
Millions of yen<br />
(except per<br />
(except per share amounts)<br />
share amounts)<br />
<strong>2007</strong> 2006 2005 <strong>2007</strong><br />
Net sales ¥1,893,343 ¥1,612,140 ¥1,356,071 $16,045,280<br />
Japan 487,103 482,825 479,007 4,127,992<br />
Overseas 1,406,240 1,129,315 877,064 11,917,288<br />
Operating income 244,741 163,428 95,862 2,074,076<br />
Operating income ratio 12.9% 10.1% 7.1% —<br />
Income from continuing operations before income taxes,<br />
minority interests and equity in earnings of affiliated companies 236,491 155,779 91,869 2,004,161<br />
Net income 164,638 114,290 59,010 1,395,237<br />
Net income per share—basic ¥ 165.70 ¥ 115.13 ¥ 59.51 140.42¢<br />
—diluted ¥ 165.40 ¥ 114.93 ¥ 59.47 140.17¢<br />
ROE 23.5% 20.8% 13.1% —<br />
ROA 13.5% 10.0% 6.6% —<br />
Total assets 1,843,982 1,652,125 1,449,068 15,626,966<br />
Shareholders’ equity 776,717 622,997 477,144 6,582,347<br />
Shareholders’ equity ratio 42.1% 37.7% 32.9% —<br />
Shareholders’ equity per share ¥ 781.57 ¥ 626.98 ¥ 481.27 662.35¢<br />
Capital investment 129,680 113,934 76,907 1,098,983<br />
Research and development expenses 46,306 44,560 41,123 392,424<br />
Number of employees 33,863 34,597 33,008 —<br />
Sales by Operation<br />
Millions of yen<br />
Thousands of<br />
U.S. dollars<br />
<strong>2007</strong> 2006 2005 <strong>2007</strong><br />
Construction and Mining Equipment ¥1,567,723 ¥1,291,223 ¥1,061,161 $13,285,788<br />
Industrial Machinery, Vehicles and Others 298,022 279,497 248,487 2,525,610<br />
Electronics 27,598 41,420 46,423 233,882<br />
Net sales ¥1,893,343 ¥1,612,140 ¥1,356,071 $16,045,280<br />
Sales by Region<br />
Millions of yen<br />
Thousands of<br />
U.S. dollars<br />
<strong>2007</strong> 2006 2005 <strong>2007</strong><br />
Japan ¥ 487,103 ¥ 482,825 ¥ 479,007 $ 4,127,992<br />
The Americas 537,836 477,718 355,561 4,557,932<br />
Europe and CIS 324,071 232,329 195,281 2,746,364<br />
China 129,443 89,667 51,987 1,096,975<br />
Asia (excluding Japan and China) and Oceania 252,768 213,719 190,458 2,142,102<br />
The Middle East and Africa 162,122 115,882 83,777 1,373,915<br />
Net sales ¥1,893,343 ¥1,612,140 ¥1,356,071 $16,045,280<br />
In accordance with Statement of Financial Accounting Standards No.144 "Accounting for the Impairment or Disposal of Long-Lived Assets," the consolidated statements<br />
of income in the prior years have been retrospectively reclassified for discontinued operations.<br />
The above sales by region are presented based on sales destination.<br />
The term "Capital investment" should be distinguished from the term "Capital expenditures" as used in the consolidated statements of cash flows. The term "Capital<br />
investment" is defined to refer to the acquisition of property, plant and equipment including properties under capital leases on an accrual basis which reflects the effects<br />
of timing differences between acquisition dates and payment dates.<br />
The United States dollar amounts represent translations of Japanese yen amounts at the rate of $1=¥118.<br />
See Note 1 of Notes to Consolidated Financial Statements.<br />
2 <strong>Annual</strong> <strong>Report</strong> <strong>2007</strong>