Part-C
Part-C
Part-C

Create successful ePaper yourself
Turn your PDF publications into a flip-book with our unique Google optimized e-Paper software.
<strong>Part</strong>-C<br />
STATE PLAN<br />
2009-10
C -1<br />
Table C-1<br />
TENTH FIVE YEAR PLAN -ANNUAL PLANS - KERALA<br />
(Rs In Lakh)<br />
Tenth Five Year Plan<br />
X<br />
Sl.No.<br />
Plan<br />
Head of Development 2002-03 2003-04<br />
2004-05<br />
2005-06 2006-07<br />
Proposed<br />
%<br />
%<br />
% %<br />
Accounts Accounts Accounts Accounts Accounts<br />
Outlay<br />
% Total %<br />
1 2 3 4 5 6 7 8 9 10 11 12 13 14 15<br />
I<br />
Agriculture and Allied<br />
services<br />
102500 27110.78 6 17826.24 4 23570.77 5 22551.43 5 41099.69 8 132158.91 6<br />
II Rural Development 66975 16808.38 4 22988.99 6 31210.43 7 28712.41 6 31418.84 6 131139.05 6<br />
III Co-operation 10000 1213.50 0 952.63 0 1151.50 0 697.56 0 711.20 0 4726.39 0<br />
IV Irrigation and Flood Control 93000 15540.71 4 16868.72 4 16835.89 4 22214.91 5 15221.76 3 86681.99 4<br />
V Power 350000 73926.13 17 33140.94 8 43722.53 10 55978.80 12 69047.70 13 275816.10 12<br />
VI Industry & Minerals 132875 21195.65 5 24927.88 6 28439.44 6 20563.50 4 33227.79 6 128354.26 6<br />
VII Transport & Communications 266000 47645.05 11 45101.02 11 53275.50 12 64676.05 14 64094.66 12 274792.28 12<br />
Scientific Services and<br />
VIII<br />
Research<br />
Social and Community<br />
IX<br />
Services<br />
12000 380.16 0 10557.95 3 13584.65 3 5201.21 1 4046.40 1 33770.37 1<br />
436045 75924.65 17 60602.20 15 72711.83 16 88084.42 19 88589.61 17 385912.71 17<br />
X Economic Services 116805 12278.03 3 7226.81 2 3747.24 1 6921.50 1 3564.34 1 33737.92 1<br />
XI General Services 13800 2854.31 1 2608.66 1 3368.18 1 6676.57 1 4128.89 1 19636.61 1<br />
XII<br />
Plan of Local Self Govt. for<br />
local level programmes<br />
800000 100459.11 23 128421.62 31 99100.20 22 100814.53 21 123380.26 23 552175.72 24<br />
TOTAL 2400000 395336.46 90 371223.66 90 390718.16 87 423092.89 89 478531.14 90 2058902.31 89<br />
* Special Assistance 1465.85 0 559.92 0 468.00 0 413.07 0 361.27 0 3268.11 0<br />
Centrally Sponcered<br />
Schemes<br />
44551.63 10 41378.23 10 58892.41 13 51402.40 11 53802.68 10 250027.35 11<br />
Grand Total 2400000 441353.94 100 413161.81 100 450078.57 100 474908.36 100 532695.09 100 2312197.77 100<br />
Budget in Brief 2009-10
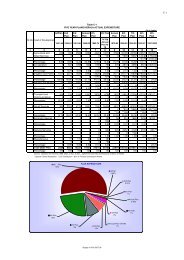
C-2<br />
TENTH FIVE YEAR PLAN OUTLAY - KERALA<br />
Agriculture and<br />
Allied services<br />
Rural Development<br />
Co-operation<br />
Centrally Sponcered Schemes<br />
Irrigation and<br />
Flood Control<br />
* Special Assistance<br />
Power<br />
Plan of Local Self Govt. for local<br />
level programmes<br />
Industry & Minerals<br />
General Services<br />
Economic Services<br />
Social and Community<br />
Services<br />
Scientific Services<br />
and Research<br />
Transport<br />
& Communications<br />
Refer Table C-1<br />
Budget in Brief 2009-10
C -3<br />
Table C-2<br />
NINTH FIVE YEAR PLAN -ANNUAL PLANS - KERALA<br />
(Rs In Lakh)<br />
Sl.No.<br />
1997-98<br />
1998-99<br />
1999-2000<br />
2000-01<br />
2001-02<br />
Head of Development<br />
%<br />
%<br />
% %<br />
Accounts<br />
Accounts<br />
Accounts<br />
Accounts<br />
Accounts<br />
% Total %<br />
1 2 3 4 5 6 7 8 9 10 11 12 13 14<br />
I Agriculture and Allied 27211.81 8.48 31156.55 8.73 28421.90 8.20 29426.85 8.94 26370.22 9.24 142587.33 8.70<br />
services<br />
(+) 345 @ (+) 419.98 @ (+) 764.98 @<br />
II<br />
Rural Development 8421.33 2.62 7844.07 2.20 6910.65 1.99 8341.93 2.54 10893.46 3.82 42411.44 2.59<br />
(+) 987.68 * (+) 1112.64 * (+)2100.32 *<br />
III Co-operation 4019.77 1.25 3590.44 1.01 5436.72 1.57 5022.12 1.53 3557.58 1.25 21626.63 1.32<br />
Irrigation and Flood<br />
IV Control 23846.81 7.43 24059.12 6.74 23988.02 6.92 21886.15 6.65 17701.56 6.21 111481.66 6.80<br />
V Power 54860.11 17.09 66641.56 18.68 60367.69 17.42 62427.59 18.97 45638.22 16.00 289935.17 17.69<br />
VI Industry & Minerals 26768.74 8.34 25233.33 7.07 23566.50 6.80 18278.30 5.55 14017.19 4.91 107864.06 6.58<br />
VII<br />
Transport &<br />
Communications 26798.31 8.35 22713.45 6.37 26788.95 7.73 24502.96 7.45 27413.40 9.61 128217.07 7.82<br />
VIII Scientific Services 1210.86 0.38 1716.61 0.48 1795.10 0.52 2048.36 0.62 1847.08 0.65 8618.01 0.53<br />
Social and<br />
67311.37 20.96 72200.37 20.24 77158.34 22.27 72769.75 22.11 64495.41 22.61 353935.24 21.60<br />
IX Community<br />
(+) 70 ** (+) 70.00 ** (+) 140.00 **<br />
Services<br />
(+) 870.32 * (+) 891.21 * (+) 1100.89 * (+) 1190.47 * (+) 224.79 * (+) 4277.68 *<br />
X Economic Services 1135.50 0.35 2420.51 0.68 2029.26 0.59 4197.11 1.28 8919.72 3.13 18702.10 1.14<br />
XI General Services 5299.69 1.65 5294.95 1.48 4961.14 1.43 4216.34 1.28 2404.60 0.84 22176.72 1.35<br />
XII<br />
Plan Allocation to Local<br />
Self Govt. for local level<br />
Plan programmes 74186.70 23.11 93887.19 26.32 85089.45 24.56 75948.38 23.08 62014.33 21.74 391126.05 23.87<br />
TOTAL 321071.00 100 356758.15 100 346513.72 100 329065.84 100 285272.77 100 1638681.48 100<br />
(+) 345.00 @ (+) 419.98 @ (+) 764.98 @<br />
(+) 1858.00 * (+) 2003.85 * (+) 1100.89 * (+) 1190.47 * (+) 224.79 * (+) 6378.00 *<br />
(+) 70.00 ** (+) 70.00 ** (+) 140 **<br />
* :Special Central Assistance<br />
** :Share of ESI<br />
@ :Xth Finance Commission Award<br />
(+) : Additional Central Assistance<br />
Budget in Brief 2009-10
C -4<br />
Total IX th Plan Expenditure<br />
Plan Assistance to Local<br />
Bodies(23.87%)<br />
Agriculture and Allied<br />
services (8.70%)<br />
Rural Development (2.59%)<br />
General Services(1.35%)<br />
Co-operation(1.32%)<br />
Irrigation and Flood<br />
Control(6.80%)<br />
Economic Services(1.14%)<br />
Power(17.69%)<br />
Social and Community<br />
Services(21.60%)<br />
Scientific Services and<br />
Research(0.53%)<br />
Transport &<br />
Communications(7.82%)<br />
Industry & Minerals(6.58%)<br />
Refer Table C-2<br />
Budget in Brief 2009-10
Refer Table C-1&2<br />
Agriculture & Allied<br />
services<br />
0<br />
75000<br />
225000<br />
150000<br />
132159<br />
143352<br />
300000<br />
375000<br />
450000<br />
525000<br />
600000<br />
675000<br />
Budget in Brief 2009-10<br />
Rural Development<br />
Co-operation<br />
Irrigation & Flood<br />
Control<br />
Power<br />
Industry & Minerals<br />
Transport &<br />
Communications<br />
Scientific Services &<br />
Research<br />
Social & Community<br />
Services<br />
Economic Services<br />
131139<br />
44512<br />
4726<br />
21627<br />
86682<br />
111482<br />
128354<br />
107864<br />
128217<br />
33770<br />
8618<br />
33738<br />
18702<br />
275816<br />
289935<br />
274792<br />
385913<br />
358353<br />
X th Plan IX th Plan<br />
SECTORAL ALLOCATION OF IX TH AND X TH PLANS<br />
General Services<br />
19637<br />
22177<br />
Plan Allocation to Local<br />
Self Govt.<br />
391126<br />
552176<br />
C-5
C-6<br />
Table C-3<br />
ELEVENTH FIVE YEAR PLAN - KERALA<br />
STATE PLAN<br />
CSS<br />
(Rs In Lakh)<br />
GROSS PLAN OUTLAY<br />
Sl.No.<br />
Head of Development<br />
XI th Plan<br />
Outlay<br />
2007-08<br />
Accounts<br />
2008-09<br />
R. E.<br />
2009-10<br />
B. E.<br />
2007-08<br />
Accounts<br />
2008-09<br />
R. E.<br />
2009-10<br />
B. E.<br />
2007-08<br />
Accounts<br />
2008-09<br />
R. E.<br />
2009-10<br />
B. E.<br />
1 2 3 4 5 6 7 8 9 10 11 12<br />
I Agriculture and Allied services 253611 23625.18 47430.93 44315.00 8832.70 11078.09 8122.10 32457.88 58509.02 52437.10<br />
II Rural Development 218931 29243.17 34898.06 36793.00 54.50 480.03 850.02 29297.67 35378.09 37643.02<br />
III Co-operation 11300 766.75 2017.50 2000.00 4922.95 8145.00 5350.00 5689.70 10162.50 7350.00<br />
IV Irrigation and Flood Control 225859 19535.36 30256.31 25065.00 950.19 490.03 323.02 20485.55 30746.34 25388.02<br />
V Power 534713 57505.08 88218.95 99756.00 250.00 0.00 0.00 57755.08 88218.95 99756.00<br />
VI Industry & Minerals 141133 37468.56 34186.03 36049.00 1529.45 2712.15 1996.00 38998.01 36898.18 38045.00<br />
VII Transport & Communications 296748 91411.77 95457.12 80660.00 177.07 229.30 577.00 91588.84 95686.42 81237.00<br />
VIII Scientific Services and Research 46334 2188.95 6500.00 6698.00 0.00 75.00 75.00 2188.95 6575.00 6773.00<br />
IX Social and Community Services 969214 153019 232061.93 295292.00 59898.33 74888.76 69107.46 212917.33 306950.69 364399.46<br />
X Economic Services 155823 9012.56 7966.07 27892.00 1243.56 1253.00 1339.00 10256.12 9219.07 29231.00<br />
XI General Services 25634 5604.24 4719.46 2967.00 383.31 471.19 550.00 5987.55 5190.65 3517.00<br />
XII<br />
Plan of Local Self Govt. for local<br />
level programmes<br />
1162900 139659.30 187751.00 208513.00 0.00 0.00 0.00 139659.30 187751.00 208513.00<br />
TOTAL 4042200 569039.92 771463.36 866000.00 78242.06 99822.55 88289.60 647281.98 871285.91 954289.60<br />
Special Central Assistance 1557.94 1850 900.00 0.00 0.00 0.00 1557.94 1850.00 900.00<br />
Grand Total 4042200 570597.86 773313.36 866900.00 78242.06 99822.55 88289.60 648839.92 873135.91 955189.60<br />
Budget in Brief 2009-10
C-7<br />
450000<br />
YEAR WISE SECTORAL CLASSIFICATION - XITH PLAN<br />
405000<br />
360000<br />
315000<br />
306951<br />
364399<br />
2008-09RE<br />
2009-10BE<br />
270000<br />
225000<br />
180000<br />
187751<br />
208513<br />
135000<br />
90000<br />
45000<br />
0<br />
Agriculture &Allied<br />
services<br />
58509<br />
52437<br />
35378<br />
37643<br />
10163<br />
7350<br />
30746<br />
25388<br />
88219<br />
99756<br />
36898<br />
38045<br />
95686<br />
81237<br />
6575<br />
6773<br />
9219<br />
29231<br />
Rural Development<br />
5191<br />
3517<br />
Co-operation<br />
Irrigation &Flood Control<br />
Power<br />
Industry & Minerals<br />
Transport &<br />
Communications<br />
Scientific Services&<br />
Research<br />
1850<br />
900<br />
Social and Community<br />
Services<br />
Economic Services<br />
General Services<br />
Plan Allocation to Local<br />
Self Govt.<br />
Special Central<br />
Assistance<br />
Refer Table C-3<br />
Budget in Brief 2009-10
C -8<br />
Sl. Head of<br />
No. Development<br />
IstPlan<br />
Table C-4<br />
FIVE YEAR PLANS KERALA ACTUAL EXPENDITURE<br />
2nd<br />
Plan<br />
3rd<br />
Plan<br />
Annual<br />
Plan<br />
4th<br />
Plan<br />
1951-56 1956-61 1961-66 1966-69 1969-74<br />
5th Plan<br />
74-78&<br />
Annual<br />
Plan 78-79<br />
Annual<br />
Plan<br />
(Rs In Lakh)<br />
6th Plan 7th Plan 8th Plan<br />
1979-80 1980-85 1985-90 1992-97<br />
1 2 3 4 5 6 7 8 9 10 11 12<br />
249 795 2586 3290 4420 10371 3782 33160 39768 129670<br />
Agricultural and<br />
0 0 0 0 0 *101 0 *1905 *3337 140 @<br />
1 Allied Services<br />
*4179<br />
Percentage 9.62 9.90 14.20 22.80 12.80 15.20 15.79 19.46 16.92 18.17<br />
0 541 1098 600 1199 783 275 3810 3096 8573<br />
Co-operation<br />
2<br />
0 0 0 0 0 *22 0 *47 0 0<br />
Percentage 0 6.70 6.00 4.20 3.50 1.20 1.15 2.14 1.22 1.16<br />
Irrigation and 1571 3274 7634 5442 14329 26566 8171 60177 79838 278502<br />
3 Power<br />
0 0 0 0 *1140 *614 *332 *1635 *1428 *2206<br />
Percentage 60.68 40.80 41.90 37.70 44.70 39.30 35.50 34.31 31.91 38.07<br />
Industry and 50 604 1437 1335 2502 7724 4367 16630 27261 86936<br />
4 Mining<br />
0 0 0 0 *100 *71 0 *17 0 0<br />
Percentage 1.93 7.50 7.90 9.20 7.50 11.30 18.23 9.24 10.70 11.79<br />
Transport and 336 718 1196 1067 3076 4788 1625 11861 27358 62232<br />
5 Communication 0 0 0 0 0 *2 172 0 0 0<br />
Percentage 12.98 9.00 6.60 7.40 8.90 6.90 7.50 6.58 10.74 8.44<br />
383 2019 4170 2661 7766 16424 4907 46849 60530 150407<br />
6<br />
Social Services 0 0 0 0 0 0 0 *910 *5885 *2985<br />
0 0 0 0 0 0 **19 **153 0 **224<br />
Percentage 14.79 25.20 22.90 18.40 22.50 23.80 20.56 26.60 26.08 20.83<br />
Economic<br />
0 0 0 0 0 155 59 551 1880 2236<br />
7 Sevices<br />
0 0 0 0 0 *258 0 0 0 0<br />
Percentage 0 0 0 0 0 0.60 0.25 0.31 0.74 0.30<br />
0 0 0 0 0 930 245 2457 4128 9103<br />
General Services<br />
8<br />
0 0 0 0 0 0 0 0 *182<br />
Percentage 0 0 0 0 0 1.30 1.02 1.36 1.69 1.24<br />
0 71 110 42 44 197<br />
Miscellaneous<br />
9<br />
0 0 0 0 0 *94<br />
Percentage 0 0.90 0.50 0.30 0.10 0.40<br />
Total State Plan 2589 8022 18231 14437 34576 69100 23954 180162 254691 737393<br />
Percentage 100 100 100 100 100 100 100 100 100 100<br />
Source: Statistics for Planning 1986- Dept. of Eco. & Stat. , Eighth five year Plan and Accounts of Govt. of Kerala<br />
* Special Central Assistance ** ESI Contribution @ X th Finance Commission Award<br />
7th Plan<br />
19%<br />
PLAN EXPENDITURE<br />
8th Plan<br />
55%<br />
6th Plan<br />
13%<br />
IstPlan<br />
0.19%<br />
Annual Plan 1979-<br />
80<br />
1%<br />
5th Plan<br />
5%<br />
4th Plan<br />
3%<br />
Annual Plan<br />
1.07%<br />
2nd Plan<br />
0.60%<br />
3rd Plan<br />
1%<br />
Budget in Brief 2009-10
C-9<br />
Table C-5<br />
PLAN OUTLAYS - ALL STATES<br />
(Rs In Crore)<br />
Total Plan outlays<br />
Tenth Plan (Year wise)<br />
Eleventh Plan<br />
Sl.<br />
No<br />
States<br />
Actual Expenditure<br />
Outlay<br />
Seventh Eighth Ninth 2002-03 2003-04 2004-05 2005-06 2006-07 2007-08 2008-09<br />
1 2 3 4 5 6 7 8 9 10 11<br />
1 Andhra Pr 5200 10500 25150 8315 10759 11457 13439 18207 29982 44000<br />
2 Arunachal Pr 400 1155 3570 532 642 656 738 892 1320 2065<br />
3 Assam 2100 4662 8984 1415 1456 2175 1869 2758 3895 5012<br />
4 Bihar 5100 13000 16680 2207 2627 3196 4465 8550 10200 13000<br />
5 Chhattisgarh 1767 2404 2833 3465 5107 7414 9600<br />
6 Delhi 2000 4500 15541 4406 4609 4261 4286 5084 9000 10000<br />
7 Goa 360 761 1500 423 568 767 958 1070 1430 1738<br />
8 Gujarat 6000 11500 28000 5403 7585 7603 11000 14384 16000 21000<br />
9 Haryana 2900 5700 9310 1776 1866 2108 2997 4233 5500 6650<br />
10 Himachal Pr 1050 2502 5700 2051 1307 1475 1676 2017 2105 2400<br />
11 J & K 1400 4000 9500 2064 2352 2839 3556 3406 4850 4500<br />
12 Jharkhand 2797 1772 2991 4079 3883 6676 8015<br />
13 Karnataka 3500 12300 23400 8164 8619 11741 12678 18309 17783 26053<br />
14 Kerala 2100 5460 16100 3944 3618 3544 3878 4559 6950 7700<br />
15 Madhya Pr 7000 11100 20075 5330 5087 6610 7443 9532 12011 14183<br />
16 Maharashtra 10500 18520 36700 7739 8188 9817 14674 15681 20200 25000<br />
17 Manipur 430 979 2427 209 287 560 611 1046 1420 1660<br />
18 Meghalaya 440 1029 2501 400 487 590 688 760 1017 1500<br />
19 Mizoram 260 763 1618 421 551 550 693 702 858 1000<br />
20 Nagaland 400 844 2006 368 479 463 648 693 843 1200<br />
21 Orissa 2700 10000 15000 2474 2437 2739 2819 3631 5520 7500<br />
22 Punjab 3285 6570 11500 1766 1586 1956 3825 5752 5111 6210<br />
23 Rajasthan 3000 11500 22526 4431 6044 6591 7700 8969 11950 14000<br />
24 Sikkim 230 550 1600 340 368 467 472 450 695 852<br />
25 Tamilnadu 5750 10200 25000 5841 7088 8286 8784 12677 14000 16000<br />
26 Tripura 440 1130 2577 591 576 579 746 892 1021 1450<br />
27 Uttarakhand 1449 1678 1917 3026 3250 4379 4775<br />
28 Uttar Pradesh 10447 21000 46340 6618 6132 8428 13523 20342 25000 35000<br />
29 West Bengal 4125 9760 16900 2673 2529 4268 5990 6935 9637 11602<br />
30 Puducherry 916 1037 1090 1750<br />
All States 81117 179985 370205 85914 93701 111467 141642 184808 237857 305415<br />
Source:State Finances- A Study of Budgets of 2008-09, RBI<br />
Budget in Brief 2009-10
C-10<br />
Plan Outlay (2008-09 )- For All States<br />
(Rs in Crore)<br />
0 5000 10000 15000 20000 25000 30000 35000 40000 45000 50000<br />
Puducherry<br />
Goa<br />
Sikkim<br />
Mizoram<br />
Nagaland<br />
Meghalaya<br />
Tripura<br />
Arunachal Pr<br />
Manipur<br />
Himachal Pr<br />
Assam<br />
Uttarakhand<br />
J & K<br />
Orissa<br />
Punjab<br />
Haryana<br />
Jharkhand<br />
Kerala<br />
Chhattisgarh<br />
Delhi<br />
West Bengal<br />
Bihar<br />
Rajasthan<br />
Madhya Pr<br />
Tamilnadu<br />
Gujarat<br />
Karnataka<br />
Maharashtra<br />
Uttar Pradesh<br />
Andhra Pr<br />
1750<br />
1738<br />
852<br />
1000<br />
1200<br />
1500<br />
1450<br />
2065<br />
1660<br />
2400<br />
5012<br />
4775<br />
4500<br />
7500<br />
6210<br />
6650<br />
8015<br />
7700<br />
9600<br />
10000<br />
11602<br />
13000<br />
14000<br />
14183<br />
16000<br />
21000<br />
26053<br />
25000<br />
35000<br />
44000<br />
Refer Table C-5<br />
Budget in Brief 2009-10