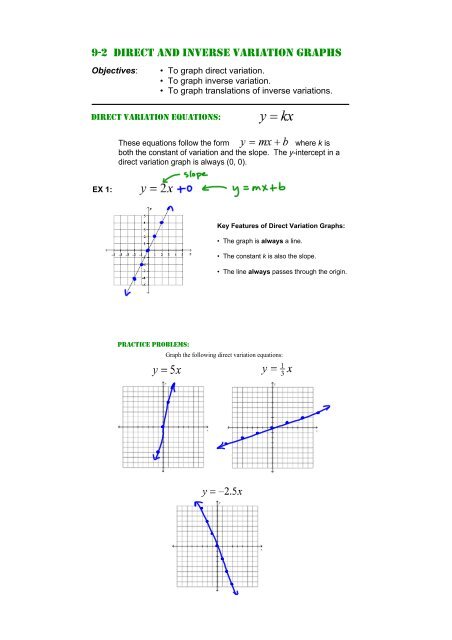
92 direct and inverse variation graphs
92 direct and inverse variation graphs
92 direct and inverse variation graphs

Create successful ePaper yourself
Turn your PDF publications into a flip-book with our unique Google optimized e-Paper software.
92 <strong>direct</strong> <strong>and</strong> <strong>inverse</strong> <strong>variation</strong> <strong>graphs</strong><br />
Objectives:<br />
• To graph <strong>direct</strong> <strong>variation</strong>.<br />
• To graph <strong>inverse</strong> <strong>variation</strong>.<br />
• To graph translations of <strong>inverse</strong> <strong>variation</strong>s.<br />
<strong>direct</strong> <strong>variation</strong> equations:<br />
These equations follow the form<br />
where k is<br />
both the constant of <strong>variation</strong> <strong>and</strong> the slope. The yintercept in a<br />
<strong>direct</strong> <strong>variation</strong> graph is always (0, 0).<br />
EX 1:<br />
Key Features of Direct Variation Graphs:<br />
• The graph is always a line.<br />
• The constant k is also the slope.<br />
• The line always passes through the origin.<br />
practice problems:<br />
Graph the following <strong>direct</strong> <strong>variation</strong> equations:
<strong>inverse</strong> <strong>variation</strong> equations:<br />
These equations don’t follow any form we’ve seen before.<br />
They are a new “family” of <strong>graphs</strong>.<br />
EX 2:<br />
><br />
Key Features of Inverse Variation Graphs:<br />
><br />
• The graph always has two asymptotes.<br />
One asymptote is horizontal ( ).<br />
><br />
One asymptote is vertical ( ).<br />
• The graph always has two symmetric branches.<br />
><br />
graphing <strong>inverse</strong> <strong>variation</strong> “parents”:<br />
1) Sketch <strong>and</strong> label both asymptotes:<br />
<strong>and</strong><br />
2) Make an x/y table by choosing both whole number <strong>and</strong> fractional values that<br />
work “nicely” with the numerator.<br />
3) Plot the points in the table (for both branches) <strong>and</strong> connect the points.<br />
Practice Problems:<br />
Graph <strong>and</strong> sketch the following <strong>inverse</strong> <strong>variation</strong> equations:<br />
Start with √k in the middle.<br />
4.<br />
Then choose two numbers<br />
smaller <strong>and</strong> two numbers<br />
larger than √k that work<br />
nicely with k.
5.<br />
Start with √k in the middle.<br />
Then choose two numbers<br />
smaller <strong>and</strong> two numbers<br />
larger than √k that work<br />
nicely with k.<br />
Make sure you are creating<br />
the table for both branches.<br />
6.<br />
the affect of<br />
on <strong>inverse</strong> <strong>variation</strong> <strong>graphs</strong>:
describing translations:<br />
Remember:<br />
" x lies, y tells the truth"!<br />
graphing <strong>inverse</strong> <strong>variation</strong> translations (“children”):<br />
1) Identify the “parent” function <strong>and</strong> create the “parent” table.<br />
2) Describe the shift. (Remember: “x lies, y tells the truth”)<br />
3) Sketch <strong>and</strong> label the asymptotes based on the shift information.<br />
4) Exp<strong>and</strong> the parent table according to the shift description.<br />
5) Plot the points in the table (for both branches) <strong>and</strong> connect the points.<br />
EX 3:<br />
Shift Description: ___________________________<br />
Asymptotes:<br />
____________ & ____________
Practice Problems:<br />
Shift Description: ___________________________<br />
7.<br />
Asymptotes:<br />
____________ & ____________<br />
Practice Problems:<br />
Shift Description: ___________________________<br />
8.<br />
Asymptotes:<br />
____________ & ____________
tonight’s homework:<br />
p. 488 #1, 3, 4, 8 10, 12, 14, 15, 19, 22 24, 34, 36, 37, 40<br />
HOMEWORK TIPS:<br />
USE GRAPH PAPER!!!<br />
#4 9: 1. Graph both functions<br />
2. Describe how the <strong>graphs</strong> are similar.<br />
3. Describe how the <strong>graphs</strong> are different.<br />
#10 & 12: 1. Enter the weight equation into Y1.<br />
2. Enter the given weight into Y2.<br />
3. Adjust the [ WINDOW ] to see where they intersect.<br />
4. [ 2 nd ] [ TRACE ] 5:intersect<br />
#34, 36 & 37<br />
1. Solve each equation for y.<br />
2. State whether you have <strong>direct</strong>, <strong>inverse</strong> or neither <strong>variation</strong>.<br />
3. Graph the equation.