PPE Demand Analysis Tool Sample Report - Digestive Health
PPE Demand Analysis Tool Sample Report - Digestive Health
PPE Demand Analysis Tool Sample Report - Digestive Health

You also want an ePaper? Increase the reach of your titles
YUMPU automatically turns print PDFs into web optimized ePapers that Google loves.
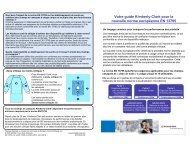
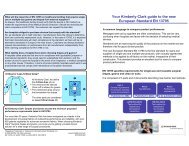
Trusted Clinical Solutions<br />
Enter Facility Name
You may also enter KC<br />
AHA # directly<br />
STEP 1: Select Facility State<br />
FL<br />
1234567<br />
STEP 2: Select Facility Name<br />
North Metro Hospital<br />
Input variables and calculator assumptions should be reviewed and verified by the facility<br />
<strong>PPE</strong> Pandemic <strong>Demand</strong> <strong>Analysis</strong> - Input Variables<br />
STEP 3: Modify assumptions (if desired)<br />
STEP 4: Verify & input ventilators<br />
STEP 5: Verify information<br />
CDC FluSurge's ASSUMPTON PAGE INPUTS<br />
Verispan/SMG ID G013WH SMSA<br />
#REF!<br />
5 ALOS non-ICU for influenza-related illness (IRI)<br />
Employees<br />
10,022 2000 Census 3,876,380<br />
10 ALOS ICU for influenza-related illness (IRI)<br />
Professional Care Givers 3,952 0-17 161,919<br />
Age<br />
10 Average days on ventilator for IRI<br />
Staffed Facility Beds 1,494 18-64 407,757<br />
Breakdown<br />
15% Percent admitted IRI patients will need ICU care<br />
Adjusted Daily Census 1556 65+ 96,528<br />
8% Percent of admitted IRI patients will need ventilators<br />
xCU Beds<br />
309 SMSA Staffed Beds 8,693<br />
70% Percent of IRI deaths assumed to be hospitalized<br />
Admissions<br />
18,060 Market Share - Beds 17%<br />
3% Overall Daily percentage increase in cases per day<br />
ER Visits<br />
180,534 Market Share - xCU's 29%<br />
25 % Attack Rate from FluSurgeMain Menu<br />
Outpatient Visits per week 7,349 Population Market Share 666,204<br />
8 Week Duration from FluSurgeMain Menu<br />
Ventilators<br />
0 0<br />
IRI = Influenza Related Illness<br />
Note: Numbers above are based on SMG Hospital data. Facility should<br />
Note: Numbers above are U.S. Census Data. Facility should<br />
ALOS = Average Length of Stay<br />
review and modify as desired.<br />
review and modify as desired.<br />
Note: Numbers above are HHS pandemic planning assumptions and used in<br />
the underlying logic of the CDC FluSurge program. Facility should review an<br />
modify as desired.<br />
Inputs to customize FluSurge<br />
STEP 6: Go to CDC FluSurge (http://www.pandemicflu.gov/plan/tools.html) Enter information requested shown in orange above.<br />
STEP 7: Enter Total Admissions from CDC FluSurge Results Screen<br />
Categories from<br />
CDC FluSurge<br />
Hospital<br />
Admissions<br />
ICU Capacity<br />
(Peak)<br />
Ventilator<br />
Capacity (Peak)<br />
Total Deaths<br />
(most likely)<br />
TOTALS<br />
2,372<br />
Hospital<br />
Capacity (Peak)<br />
331<br />
99<br />
99<br />
481<br />
Product Category<br />
Respirators<br />
Surgical Masks (Fluid Resistant)<br />
Standard Masks<br />
Eyewear<br />
Cover Gowns<br />
Gloves<br />
Headwear<br />
Input here<br />
These<br />
inputs are<br />
not required<br />
but you may<br />
want to<br />
input them<br />
for your<br />
reference<br />
KC Annual<br />
20%<br />
Outpatient Visits during Pandemic<br />
% increase over<br />
average<br />
Week 1 7,994<br />
109%<br />
Week 2 13,324<br />
181%<br />
Week 3 19,986<br />
272%<br />
Week 4 25,316<br />
344%<br />
Week 5 25,316<br />
344%<br />
19,986<br />
Week 7 13,324<br />
181%<br />
Week 8 7,994<br />
109%<br />
Week 9<br />
#REF!<br />
#REF!<br />
Week 10<br />
#REF!<br />
#REF!<br />
Week 11<br />
#REF!<br />
#REF!<br />
Week 12<br />
#REF!<br />
#REF!<br />
Outpatient Visits Occuring<br />
During Pandemic Period<br />
133,241<br />
#REF! #REF! #REF! #REF! Week 6 272%<br />
58.0 0 58 1.1 0.003 0.039 0.00789 0.015 0.006<br />
1106.0 0 1,106 21.3 0.061 0.740 0.15050 0.280 0.110<br />
2000.0 0 2,000 38.5 0.111 1.339 0.27216 0.506 0.200<br />
179.0 0 179 3.4 0.010 0.120 0.02436 0.045 0.018<br />
7627.0 0 7,627 146.7 0.422 5.105 1.03787 1.930 0.761<br />
4840.0 0 4,840 93.1 0.268 3.240 0.65862 1.225 0.483<br />
447.0 0 447 8.6 0.025 0.299 0.06083 0.113 0.045<br />
Note: Based on current<br />
annualized traced sales to<br />
Kimberly-Clark.<br />
CDC FluSurge Data <strong>Analysis</strong> Results<br />
STEP 9: Facility should verify product usage totals and input additional volume.<br />
CDC FluSurge will also return an anlysis for the other category impacts by week. See example below.<br />
Other Annual<br />
CURRENT (BASELINE) PRODUCT USAGE IN CASES<br />
TOTAL<br />
Weekly Base<br />
Screen Capture from FluSurge<br />
Output<br />
STEP 10: Proceed to "<strong>Demand</strong> Based Increase" Worksheet<br />
Outpatient Visits<br />
STEP 8: Facility can modify % individuals seeking care<br />
Outpatient visits defined as % of customer's market share contracting<br />
pandemic disease and seeking help at facility equals:<br />
Note: Assumptions from Step 3 should match info input into CDC FluSurge<br />
by Admit by Bed by Visit by Professional by Employee<br />
Note: This tool is intended to provide healthcare facilities a means of evaluating how much <strong>PPE</strong> they may want to consider stockpiling in preparation for a potential future pandemic. This tool creates a baseline of information using U.S Census Data, SMG Hospital Information, CDC FluSurge<br />
data and facility sales information of Kimberly-Clark products. The default assumptions used to calculate <strong>PPE</strong> demand are based on HHS pandemic planning assumptions and can be adjusted by the facility. The intent of the analysis is to provide a working guideline for facilities to estimate<br />
potential <strong>PPE</strong> demand and does not in itself represent a guarantee that projected amount will represent sufficient inventory levels in the case of a pandemic. Input variables should be reviewed and verified by the facility.<br />
© 2007 KCWW. All Rights Reserved.
KC<br />
AHA:<br />
1234567<br />
STEP 1: Review and/or modify <strong>PPE</strong> set usage assumptions<br />
<strong>PPE</strong> Pandemic <strong>Demand</strong> <strong>Analysis</strong> - Results <strong>Report</strong><br />
Input variables and calculator assumptions should be reviewed and verified by the facility<br />
North Metro Hospital<br />
Sets of <strong>PPE</strong> that will be used per:<br />
OUTPATIENT VISITS<br />
ADMISSIONS<br />
TOTAL BEDS (INCLUDING xCU BEDS)<br />
PROFESSIONAL HEALTHCARE WORKER USES per DAY<br />
FACILITY EMPLOYEE USES per DAY<br />
USER DETERMINED (see below) 0<br />
Other Increase Factors to Consider: Other Staff, Morgue, Laboratory, Surge Capacity Rooms, Volunteers, etc.<br />
STEP 2: Modify % product to constitute <strong>PPE</strong> set<br />
Respirators<br />
Fluid Resistant<br />
Masks<br />
Standard<br />
Masks<br />
Eyewear<br />
Cover<br />
Gowns<br />
20 50% 25% 25% 25% 100% 100% 25%<br />
100 100% 0% 25% 50% 100% 100% 50%<br />
24 100% 0% 25% 50% 100% 100% 50%<br />
8 50% 25% 25% 25% 25% 100% 25%<br />
4 25% 25% 25% 10% 10% 25% 10%<br />
Gloves<br />
Headwear<br />
SELECT METRIC TO LOAD ON:<br />
ADMISSIONS<br />
SELECTED CRITERIA TO BE USED FOR DEMAND CALCULATION<br />
Additional ADMISSIONS requiring precautions<br />
Pandemic Related Increase based on ADMISSIONS<br />
Estimates<br />
2,372<br />
100<br />
Based on FluSurge Data<br />
sets of <strong>PPE</strong><br />
RESULTING INCREASE IN <strong>PPE</strong> DEMAND<br />
<strong>PPE</strong> Product Category<br />
Quantity Needed<br />
(in Eaches)<br />
Quantity Per Case<br />
Respirators 237,200 210<br />
Surgical Masks (Fluid Resistant) 50,000 300<br />
Standard Masks 25,000 300<br />
Eyewear 118,600 50<br />
Cover Gowns 237,200 100<br />
Gloves 237,200 1,000<br />
Headwear 118,600 500<br />
Additional Cases Needed<br />
1130<br />
167<br />
83<br />
2372<br />
2372<br />
237<br />
237<br />
STEP 5: Select # weeks to spread order<br />
TO SPREAD LOAD IN OVER<br />
6 WEEKS,<br />
YOU WOULD NEED TO INCREASE YOUR STANDARD ORDERS BY:<br />
ORDERING SCHEDULE<br />
Product Category<br />
Current Weekly Order<br />
Additional Product to<br />
Order<br />
Respirators 1.1 132<br />
Standard Masks 21.3 83<br />
Eyewear 0.0 198<br />
Cover Gowns 3.5 40<br />
Gloves 146.7 132<br />
Headwear 93.1 66<br />
New Amount to Order for 6 weeks<br />
133<br />
105<br />
198<br />
43<br />
278<br />
159<br />
Note: This tool is intended to provide healthcare facilities a means of evaluating how much <strong>PPE</strong> they may want to consider stockpiling in preparation for a potential future pandemic.<br />
This tool creates a baseline of information using U.S Census Data, SMG Hospital Information and facility sales information of Kimberly-Clark products. The default assumptions<br />
used to calculate <strong>PPE</strong> demand are based on HHS pandemic planning assumptions and can be adjusted by the facility. The intent of the analysis is to provide a working guideline for<br />
facilities to estimate potential <strong>PPE</strong> demand and does not in itself represent a guarantee that projected amount will represent sufficient inventory levels in the case of a pandemic.<br />
© 2007 KCWW. All Rights Reserved.
General <strong>PPE</strong> Stockpile Based on Current Usage<br />
CDC recommends stockpiling 6-8 weeks of consumable medical supplies<br />
STEP 1: Select Facility State<br />
FL<br />
You may also enter KC AHA # directly<br />
STEP 2: Select Facility Name<br />
1234567 North Metro Hospital<br />
STEP 3: Add non-KC volume<br />
STEP 4: Choose # weeks<br />
GENERAL <strong>PPE</strong> STOCKPILE BASED ON CURRENT USAGE FIGURES<br />
Product Category<br />
Respirators<br />
Surgical Masks (Fluid Resistant)<br />
Standard Masks<br />
Eyewear<br />
Cover Gowns<br />
Gloves<br />
Headwear<br />
KC Annual Usage<br />
(in cases)<br />
ADDITIONAL<br />
Annual Usage<br />
(in cases)<br />
TOTAL<br />
Annual Usage<br />
(in cases)<br />
Weekly Base<br />
(in cases)<br />
# Weeks Avg Usage<br />
to Stockpile<br />
STOCKPILE<br />
TOTAL<br />
(in cases)<br />
58 0 58 1.1 8 Weeks Stockpiled 9<br />
1,106 0 1,106 21.3 8 Weeks Stockpiled 170<br />
0 0 0 0.0 8 Weeks Stockpiled 0<br />
180 0 180 3.5 8 Weeks Stockpiled 28<br />
7,628 0 7,628 146.7 8 Weeks Stockpiled 1,173<br />
4,840 0 4,840 93.1 8 Weeks Stockpiled 745<br />
447 0 447 8.6 8 Weeks Stockpiled 69<br />
STEP 5: Facility should verify & add relevant volume<br />
STEP 6: Choose # weeks to spread order<br />
TO SPREAD PURCHASE OVER 6 WEEKS, INCREASE STANDARD ORDERS BY<br />
Product Category<br />
Respirators<br />
Surgical Masks (Fluid Resistant)<br />
Standard Masks<br />
Eyewear<br />
Cover Gowns<br />
Gloves<br />
Headwear<br />
ORDERING SCHEDULE<br />
Current Weekly<br />
Order<br />
Additional<br />
Product to<br />
Order<br />
1.1 1<br />
21.3 28<br />
0.0 0<br />
3.5 5<br />
146.7 196<br />
93.1 124<br />
8.6 11<br />
New Amount to Order for 6 Weeks<br />
3<br />
50<br />
0<br />
8<br />
342<br />
217<br />
20<br />
Note: This tool is intended to provide healthcare facilities a method to evaluate how much <strong>PPE</strong> to consider stockpiling in preparation for a potential future pandemic. This General Stockpile Calculator<br />
calculates the number of cases of <strong>PPE</strong> required to create a stockpile of a facility-defined number of weeks based on current annual usage of <strong>PPE</strong>. This usage is not necessarily indicative of the same type<br />
of <strong>PPE</strong> mix that may be required during a pandemic, nor does it represent a guarantee that projected amounts will represent sufficient inventory levels in the case of a pandemic. Based on CDC<br />
recommendations for stockpiling, it instead, projects a basic level of safety stock.<br />
© 2007 KCWW. All Rights Reserved.