KB prezent. angl - Komerční banka
KB prezent. angl - Komerční banka
KB prezent. angl - Komerční banka

You also want an ePaper? Increase the reach of your titles
YUMPU automatically turns print PDFs into web optimized ePapers that Google loves.
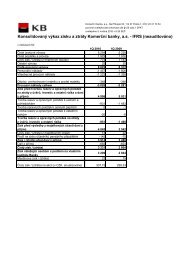
Survey of Financial Results<br />
1999 – 2003<br />
Survey of Financial Results 1999 – 2003<br />
CZK million Unconsolidated data 2003 2002 2001 2000 1999<br />
Net interest income 11,937 12,447 12,989 12,287 11,947<br />
Net fees and commissions 8,711 8,320 8,394 7,181 4,350<br />
Total operating income 21,889 22,597 23,809 21,805 20,390<br />
Total operating costs (11,728) * (12,760) * (15,065) * (13,783) * (12,770)<br />
Net profit/(loss) 9,262 8,763 2,532 (19) (9,782)<br />
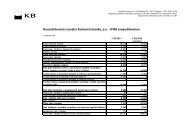
International Financial<br />
Reporting Standards (IFRS)<br />
Total assets 447,565 439,753 421,720 402,205 390,122<br />
Loans to customers, net 130,900 121,154 135,197 126,943 181,754<br />
Amounts due to customers 349,505 341,114 321,345 287,624 259,191<br />
Total shareholders’ equity 40,399 33,758 23,598 20,211 17,776<br />
Return on average equity, ROAE (%) 24.98 30.56 11.56 x x<br />
Return on average assets, ROAA (%) 2.09 2.03 0.61 x x<br />
Net interest margin (%) 3.00 3.25 3.64 3.62 3.42<br />
Cost/income ratio (%) 53.58 56.47 63.27 63.21 62.63<br />
Operating costs on an employee (CZK thousand) (1,351) (1,428) (1,526) (1,162) (947)<br />
Net profit on an employee (CZK thousand) 1,067 981 256 x x<br />
Total assets on an employee (CZK thousand) 51,545 49,217 42,714 33,898 28,926<br />
Czech Accounting Standards<br />
(CAS) **<br />
Methodology<br />
of the Czech<br />
National Bank ***<br />
Net interest income 11,962 12,614 13,565 12,344 11,915<br />
Net fees and commissions 5,780 6,232 5,981 4,422 4,350<br />
Total operating costs (10,120) (11,705) (12,066) (11,022) (11,039)<br />
Net profit/(loss) 9,310 9,229 2,624 (149) (9,242)<br />
Total assets 451,397 445,982 429,659 407,558 439,110<br />
Amounts due from customers 160,149 163,806 193,774 133,977 183,644<br />
Amounts owed to customers 315,808 305,788 289,638 272,228 259,191<br />
Total shareholders’ equity 40,419 33,804 23,668 20,034 17,826<br />
Return on average equity, ROAE (%) 25.09 32.12 12.01 x x<br />
Return on average assets, ROAA (%) 2.07 2.11 0.63 x x<br />
Capital adequacy (%) 15.37 13.35 14.30 14.38 10.69<br />
Tier 1 27,734 22,138 19,951 20,100 15,084<br />
Tier 2 2,272 6,091 9,607 9,973 9,882<br />
Tier 3 0 0 0 0 0<br />
Deductible items from Tier 1 and Tier 2 2,590 1,896 1,387 1,322 1,994<br />
Capital requirement A 14,543 15,164 15,071 15,424 17,193<br />
Capital requirement B 776 638 688 573 N/A<br />
Number of employees (average) 8,683 8,935 9,873 11,865 13,487<br />
Number of points of sale 335 331 323 342 349<br />
Note: * Including restructuring costs.<br />
** Excluding 1999 all periods according to the methodology effective since 2002.<br />
*** Data for 2003 according to a new methodology.