JPMorgan - KASE
JPMorgan - KASE
JPMorgan - KASE

Create successful ePaper yourself
Turn your PDF publications into a flip-book with our unique Google optimized e-Paper software.
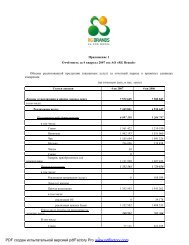
Product Produced<br />
Amount<br />
Sold<br />
2001 2000<br />
Average<br />
Price<br />
Revenue<br />
Amount<br />
Sold<br />
Average<br />
Price<br />
Revenue<br />
(Tonnes) ($/tonne) ($000’s) (Tonnes) ($/tonne) ($000’s)<br />
Gasoline ..................... 548,503 207.54 113,838 315,327 215.31 67,893<br />
Diesel........................ 710,029 178.30 126,600 433,222 185.30 80,274<br />
Heavy fuel oil (mazut) ......... 1,045,682 50.00 52,284 566,948 49.79 28,230<br />
LPG ......................... 107,079 92.71 9,927 63,478 70.56 4,479<br />
Jetfuelandkerosene .......... 57,829 231.84 13,407 16,637 226.30 3,765<br />
Totalselfrefined .............. 2,469,122 128.00 316,056 1,395,612 132.30 184,641<br />
Resale of purchased refined<br />
products ................... 83,695 154.15 12,902 148,752 128.31 19,087<br />
Total refined product sales ..... 2,552,817 128.86 328,958 1,544,364 131.92 203,728<br />
Processing Fees<br />
Total processing fees earned in 2001 amounted to $11.0 million compared to $11.9 million in<br />
2000.<br />
The following table sets out the total quantity of oil processed into product and the average fee<br />
charged:<br />
Tollers’ Volumes<br />
Processed*<br />
Processing<br />
Fee<br />
Processing<br />
Fees Earned<br />
(Tonnes) ($/tonne) ($000’s)<br />
2001 ............................................. 694,924 15.84 11,008<br />
2000 ............................................. 711,368 16.71 11,884<br />
* 2001 processed crude is approximately 5.4 MMbbls (2000 – 5.5 MMbbls)<br />
Interest and Other Income<br />
Revenues from interest and other income increased $3.7 million, or 59.0%, from the year ended<br />
December 31, 2000 to the year ended December 31, 2001 and were $6.4 million and $10.1 million<br />
respectively. The increase was primarily due to an increase in third party service fees and<br />
Upstream asset sales.<br />
Expenses<br />
Production<br />
Production expenses were $43.0 million in 2001 and $35.3 million in 2000. Based on the number<br />
of barrels of oil produced, these costs were $1.17/Bbl for 2001 and $1.15/Bbl for 2000. The $7.7<br />
million absolute increase between 2001 and 2000 resulted from the increase in production<br />
volumes of 6 MMbbls and the inclusion of the Kazgermunai joint venture for the entire year.<br />
Royalties<br />
The total royalty expense for 2001 was $35.5 million, which represented an effective overall<br />
percentage of 9.24%, compared to $33.7 million, or an overall effective percentage of 9.95%, for<br />
2000. The following table sets out the royalty paid in kind and in cash by quarter in 2001 and<br />
2000:<br />
Quarter ending<br />
Royalty<br />
in Kind<br />
2001 2000<br />
Cash<br />
Royalty<br />
Total<br />
Royalty<br />
Royalty<br />
in Kind<br />
Cash<br />
Royalty<br />
Total<br />
Royalty<br />
($ in 000’s)<br />
March31 .............................. — 5,589 5,589 — 5,694 5,694<br />
June30 ............................... 6,680 2,634 9,314 785 4,912 5,697<br />
September 30 .......................... 11,103 1,493 12,596 5,563 1,401 6,964<br />
December31 .......................... 7,526 479 8,005 9,548 5,806 15,354<br />
Total Royalty .......................... 25,309 10,195 35,504 15,896 17,813 33,709<br />
44