Estimation of Demographic Parameters from Live ... - BioOne
Estimation of Demographic Parameters from Live ... - BioOne
Estimation of Demographic Parameters from Live ... - BioOne

You also want an ePaper? Increase the reach of your titles
YUMPU automatically turns print PDFs into web optimized ePapers that Google loves.
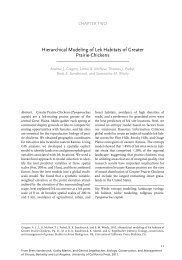
Figure 1. A comparison <strong>of</strong> encounter histories and mark–recapture<br />
models for analyses <strong>of</strong> live-encounter data. The example contains 4<br />
occasions (t 1 to t 4 ) and 3 intervals (arrows). In Cormack-Jolly-Seber,<br />
temporal symmetry, and robust design models, encounters at each<br />
occasion (L or LLL) are coded as: 1 ¼ detected and 0 ¼ not detected. In<br />
the multi-strata model, detections are coded as categorical states such<br />
as: B ¼ breeding, and N ¼ nonbreeding. In the joint live–dead model,<br />
detections at each occasion (LD) are coded as: 1 ¼ detected alive, and<br />
2 ¼ recovered dead. <strong>Demographic</strong> parameters that can be estimated<br />
<strong>from</strong> live-encounter data include the probabilities <strong>of</strong> apparent survival<br />
(/), encounter (p), seniority (f), true detection (p*), recapture (c),<br />
population size (N), site propensity (d), changing strata (w), true survival<br />
(S), site fidelity (F) and reporting (r).<br />
parameters. Return rates are a negatively biased estimate <strong>of</strong><br />
true survival if any <strong>of</strong> the 3 other probabilities are ,1<br />
(Martin et al. 1995). Negative bias should have greater<br />
consequences for management <strong>of</strong> long-lived animals if adult<br />
survival has a high elasticity value.<br />
Given the expected problems <strong>of</strong> bias and interpretation,<br />
investigators should avoid return rates if possible. However,<br />
return rates may be the only estimator available if the<br />
duration <strong>of</strong> a project is 2–3 years. Return rates can be used as<br />
a relative index <strong>of</strong> true survival but only if investigators are<br />
willing to make assumptions about the remaining 3<br />
probabilities. If one assumes that site fidelity, site propensity,<br />
and true detection are equivalent among groups, then<br />
differences in return rates can be ascribed to variation in true<br />
survival. Similarly, it is possible to compare temporal trends<br />
in return rates among 2 or more locations if one assumes<br />
that the distributions <strong>of</strong> a subset <strong>of</strong> the probabilities are<br />
stationary, if not equivalent.<br />
Jolly-Seber and Cormack-Jolly-Seber<br />
Models<br />
The first step in any mark–recapture analysis is to assemble<br />
encounter histories for all uniquely marked individuals. In<br />
standard mark–recapture models for open populations, each<br />
sampling occasion is coded as: 1 ¼ an observer detected the<br />
individual, or 0 ¼ an observer did not encounter the<br />
individual (Fig. 1). In live-encounter data, detections <strong>of</strong><br />
uniquely marked individuals may include physical captures,<br />
resightings, or both. If inspection <strong>of</strong> the encounter histories<br />
reveals gaps where observers did not detect some individuals<br />
in intervening years (e.g., 1011), then the probability <strong>of</strong><br />
encounter is ,1. Next, investigators select the factors that<br />
will be included in the set <strong>of</strong> candidate models a priori, they<br />
apply goodness-<strong>of</strong>-fit procedures to the most general<br />
starting (or global) model to determine whether a variance<br />
inflation factor (^c) is needed to correct for possible overdispersion,<br />
and then use model selection procedures to<br />
identify parsimonious models for parameter estimation<br />
(Burnham and Anderson 1998).<br />
The Jolly-Seber (JS) model estimates 4 parameters <strong>from</strong><br />
the encounter histories: the probability <strong>of</strong> apparent (or local)<br />
survival (/ ¼ S 3 F), the probability <strong>of</strong> encounter (p ¼ d 3<br />
p*), population size (N), and the number <strong>of</strong> new individuals<br />
entering the population (B; Pollock et al. 1990). Unfortunately,<br />
individual heterogeneity and other issues <strong>of</strong>ten lead<br />
to bias in estimates <strong>of</strong> N and B <strong>from</strong> JS models. Thus,<br />
analyses <strong>of</strong> live-encounter data frequently rely on the<br />
Cormack-Jolly-Seber (CJS) model, a restricted model that<br />
estimates 2 <strong>of</strong> the 4 parameters: apparent survival (/) and<br />
the probability <strong>of</strong> encounter (p; Lebreton et al. 1992).<br />
Standard CJS models usually contain group (grp) or timedependence<br />
(t) and may be denoted / grp3t , p grp3t where the<br />
3 indicates an interaction between the categorical factors.<br />
Cormack-Jolly-Seber models have been widely applied to a<br />
diverse range <strong>of</strong> wildlife populations, including amphibians<br />
(Anholt et al. 2003), reptiles (Freilich et al. 2000,<br />
Willemsen and Hailey 2001), birds (Sandercock and<br />
Gratto-Trevor 1997, Rivera-Milán and Schaffner 2002,<br />
Morrison et al. 2004, Ward et al. 2004), and mammals<br />
(Langtimm et al. 1998, Lindenmayer et al. 1998).<br />
One limitation <strong>of</strong> CJS models is that / and p are both<br />
products <strong>of</strong> multiple parameters. If modeling <strong>of</strong> a set <strong>of</strong><br />
encounter histories indicates that p ¼ 1, then return rates are<br />
equivalent to apparent survival (rr ¼ /) and can be analyzed<br />
with logistic regression. This situation is unusual but does<br />
apply to some stage classes (breeders: Cam and Monnat<br />
2000, Sandercock et al. 2000, Robertson et al. 2006;<br />
territory holders: Johnson et al. 2001) and to some<br />
populations (McElligott et al. 2002, Ozgul et al. 2004). If<br />
p , 1, but true detection rates are assumed to be stationary,<br />
investigators can use encounter rates as a relative index <strong>of</strong><br />
site propensity (p ’ d; Cooch et al. 2001).<br />
In general, / will be a less-biased estimator <strong>of</strong> true survival<br />
than return rates because the effects <strong>of</strong> variation in d and p*<br />
have been removed. Similar to return rates, estimates <strong>of</strong> /<br />
will be high if S and F are both high (e.g., ^/ . 0.93, puffins<br />
[Fratercula arctica]: Breton et al. 2005; murres [Uria aalge]:<br />
Robertson et al. 2006). Cormack-Jolly-Seber models<br />
estimate true survival (/ ¼ S) for sessile animals with<br />
limited movements because site fidelity is likely to be high<br />
(F ¼ 1, Villella et al. 2004). Conversely, CJS models can be<br />
used to estimate site fidelity (/ ¼ F) if true survival rates are<br />
high during a short-term study (S ¼ 1, Boulanger and<br />
McLellan 2001, Schaub et al. 2001). In open population<br />
models for most vagile animals, however, the complement <strong>of</strong><br />
apparent survival (1 /) will include losses to mortality and<br />
to permanent emigration, and the relative importance <strong>of</strong><br />
1506 The Journal <strong>of</strong> Wildlife Management 70(6)