Presentation of Karl Mielke, CEO K+S North America Salt Holdings ...
Presentation of Karl Mielke, CEO K+S North America Salt Holdings ...
Presentation of Karl Mielke, CEO K+S North America Salt Holdings ...

You also want an ePaper? Increase the reach of your titles
YUMPU automatically turns print PDFs into web optimized ePapers that Google loves.
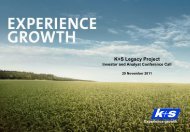
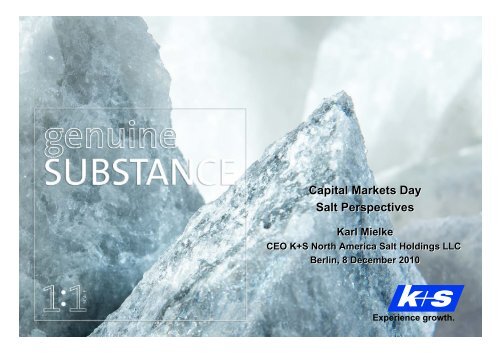
Capital Markets Day<br />
<strong>Salt</strong> Perspectives<br />
<strong>Karl</strong> <strong>Mielke</strong><br />
<strong>CEO</strong> <strong>K+S</strong> <strong>North</strong> <strong>America</strong> <strong>Salt</strong> <strong>Holdings</strong> LLC<br />
Berlin, 8 December 2010<br />
Experience growth.
<strong>Salt</strong><br />
Content<br />
A. <strong>Salt</strong> Market Environment<br />
B. The <strong>K+S</strong> <strong>Salt</strong> Business<br />
C. <strong>K+S</strong>’ Position in Competitive Environment<br />
D. Growth Perspectives & Strategy<br />
December 2010 <strong>K+S</strong> Group 1
No Life without <strong>Salt</strong>!<br />
<strong>Salt</strong> is…<br />
… a fundamental component <strong>of</strong> our life<br />
These are the following main production methods <strong>of</strong> salt:<br />
Rock <strong>Salt</strong><br />
Sea-/Solar <strong>Salt</strong><br />
Evaporated <strong>Salt</strong><br />
Brine<br />
Conventional<br />
mining<br />
Crystallisation<br />
from sea water<br />
Recrystallisation<br />
<strong>of</strong> purified brine<br />
Controlled<br />
borehole-brining<br />
December 2010 <strong>K+S</strong> Group 2
<strong>Salt</strong><br />
Details <strong>of</strong> the Market for <strong>Salt</strong> for Chemical Use<br />
• Largest salt product market with global<br />
chemical industry consuming approx. 150 Mt<br />
per year as feedstock<br />
• Main applications:<br />
• chlor-alkali industry (→ PVC)<br />
• synthetic soda ash production (→ glass)<br />
Electrolysis<br />
facility<br />
• Key demand drivers:<br />
• GDP growth<br />
• urbanization<br />
• Success factors:<br />
• efficient sourcing and logistics network<br />
• reliant delivery capacity<br />
December 2010 <strong>K+S</strong> Group 3
<strong>Salt</strong><br />
Details <strong>of</strong> the De-icing <strong>Salt</strong> Market<br />
• Clients are mainly municipalities and other public<br />
authorities<br />
• Contract award is mainly based on public bidding<br />
process<br />
• Main application:<br />
• salt used as de-icing agent for highway safety<br />
• Key demand drivers:<br />
• winter weather conditions<br />
• infrastructure development<br />
• Success factors:<br />
• efficient sourcing and logistics network<br />
• delivery capacity<br />
December 2010 <strong>K+S</strong> Group 4
<strong>Salt</strong><br />
Details <strong>of</strong> De-icing <strong>Salt</strong> Bidding Processes<br />
defined by<br />
Details specified in typical<br />
bid document<br />
volume<br />
destination<br />
delivery<br />
product and service<br />
specifications<br />
guaranteed minimum<br />
purchase requirement<br />
maximum delivery<br />
requirement<br />
price<br />
vendor purchaser<br />
• Government de-icing contracts are awarded in<br />
Europe, the US and Canada in the form <strong>of</strong> public<br />
bids<br />
• Government purchaser issues bid documents in<br />
late spring/early summer<br />
• Vendors hand in sealed bids, which will be<br />
opened at date and time specified in the bid<br />
documents<br />
• Lowest priced bid that satisfies all requirements<br />
will be awarded<br />
• In the US, Canada and most parts <strong>of</strong> Europe, all<br />
vendor’s bids will become public<br />
• In the US most bids are valid for one year/season<br />
• In Canada and some parts <strong>of</strong> Europe contracts<br />
might be awarded for a duration <strong>of</strong> up to 4 years<br />
December 2010 <strong>K+S</strong> Group 5
<strong>Salt</strong><br />
Details <strong>of</strong> the Food Grade <strong>Salt</strong> Market<br />
• Main applications:<br />
• table salt (Consumer)<br />
• food processing<br />
• Key demand drivers:<br />
• population growth<br />
• eating habit<br />
• Success factors:<br />
• high quality standards<br />
• marketing/branding<br />
(especially in <strong>North</strong> and South <strong>America</strong>)<br />
• supply chain efficiency to fulfil customer<br />
requirements<br />
• Current situation:<br />
Within the US and some European countries<br />
increasing political pressure to reduce the<br />
consumption <strong>of</strong> sodium<br />
December 2010 <strong>K+S</strong> Group 6
<strong>Salt</strong><br />
Industrial/Other Applications <strong>of</strong> <strong>Salt</strong><br />
The industrial salt market comprises different<br />
high-value applications:<br />
• Pharmaceutical<br />
• Highly regulated, high-margin segment<br />
• Main use in infusion and dialysis solutions, as<br />
well as cosmetics and drugs<br />
• Water s<strong>of</strong>tening<br />
• Used in municipal and private household<br />
water treatment<br />
• Oil and gas drilling<br />
• <strong>Salt</strong> used as drilling agent in oil and gas<br />
exploration<br />
• Animal feed<br />
• Animal feed salts serve as raw ingredient to<br />
industrially assembled feed mixes<br />
December 2010 <strong>K+S</strong> Group <strong>K+S</strong> Group 7
<strong>Salt</strong><br />
Main End Uses for <strong>Salt</strong><br />
• <strong>Salt</strong> has more than 14,000 different applications<br />
• <strong>Salt</strong> prices vary from approx. 40 US$/t (certain chemical salts) to approx. 1,000 US$/t<br />
(pharma salt)<br />
• Main applications <strong>of</strong> salt are: input for chemical processes, food grade and de-icing<br />
<strong>North</strong> <strong>America</strong><br />
(Consumption 2007: 69 million tonnes)<br />
Global<br />
(Consumption 2007: 259 million tonnes)<br />
Industrial/Others<br />
10.0%<br />
De-icing<br />
<strong>Salt</strong><br />
14.0%<br />
Asia<br />
(Consumption 2007: 94 million tonnes)<br />
Europe<br />
(Consumption 2007: 72 million tonnes)<br />
Food<br />
Grade<br />
<strong>Salt</strong><br />
17.5%<br />
Sources: Roskill 2007, <strong>K+S</strong><br />
<strong>Salt</strong> for<br />
Chemical<br />
Processes<br />
58.5%<br />
South <strong>America</strong><br />
(Consumption 2007: 14 million tonnes)<br />
December 2010 <strong>K+S</strong> Group 8
<strong>Salt</strong><br />
Main <strong>Salt</strong> Suppliers Worldwide<br />
Capacity in million tonnes (crystallised salt and salt in brine; excl. captive use)<br />
3.5<br />
13.1<br />
14.4<br />
14.0<br />
9.7<br />
18.7<br />
Compass<br />
Cargill<br />
7.5<br />
Artyomsol<br />
5.3<br />
4.1<br />
Südsalz<br />
Salins<br />
3.6<br />
Akzo<br />
China National <strong>Salt</strong><br />
7.0<br />
ESSA<br />
9.0<br />
7.0<br />
Dampier<br />
3.8<br />
Mitsui<br />
Sources: Roskill 2007, <strong>K+S</strong><br />
December 2010 <strong>K+S</strong> Group 9
<strong>Salt</strong><br />
Content<br />
A. <strong>Salt</strong> Market Environment<br />
B. The <strong>K+S</strong> <strong>Salt</strong> Business<br />
C. <strong>K+S</strong>’ Position in Competitive Environment<br />
C. Growth Perspectives & Strategy<br />
December 2010 <strong>K+S</strong> Group 10
<strong>Salt</strong><br />
Steps in Developing the <strong>K+S</strong> <strong>Salt</strong> Business<br />
5<br />
Acquired Morton <strong>Salt</strong>,<br />
the largest salt producer<br />
in <strong>North</strong> <strong>America</strong><br />
<strong>K+S</strong><br />
4<br />
Morton<br />
<strong>Salt</strong><br />
Acquired No.1 salt<br />
producer in South<br />
<strong>America</strong> through SPL<br />
acquisition<br />
- Market entry into U.S.<br />
and Latin <strong>America</strong><br />
SPL<br />
1<br />
2<br />
3<br />
Originally, salt<br />
business with high<br />
exposure to de-icing<br />
and industrial salt in<br />
Europe<br />
Added salt for chemical<br />
use through the acquisition<br />
<strong>of</strong> Frisia Zout (NL)<br />
Created No.1 salt<br />
producer in Europe<br />
through the acquisition<br />
<strong>of</strong> Solvay salt business<br />
December 2010 <strong>K+S</strong> Group 11
<strong>Salt</strong><br />
Strong presence in attractive de-icing regions<br />
Great Lakes<br />
• Continental climate with<br />
a distinctly stable winter<br />
• High population density<br />
• Very stable de-icing<br />
business with high<br />
quantities<br />
US – East Coast<br />
• Atlantic climate<br />
• Relatively volatile, to<br />
some extent severe<br />
winters<br />
• Very high population<br />
density<br />
• Stable de-icing<br />
business<br />
Eastern Canada<br />
• Atlantic climate<br />
• Relatively stable winters<br />
• Low population density<br />
• Stable de-icing business<br />
• Long-term contracts<br />
Western Europe<br />
• Atlantic climate<br />
• Rather mild winters with<br />
cyclic upward swings<br />
• Very high population<br />
density<br />
• Relatively cyclic deicing<br />
business<br />
Scandinavia<br />
• In comparison to<br />
Western Europe,<br />
stable winters<br />
• Relatively low<br />
population density<br />
• Relatively stable<br />
de-icing business<br />
December 2010 <strong>K+S</strong> Group 12
<strong>Salt</strong><br />
Balanced Product and Regional Portfolio<br />
Revenues by product group<br />
De-icing salt<br />
40%<br />
Other<br />
4%<br />
2005<br />
Food grade salt<br />
18%<br />
Industrial salt<br />
31%<br />
<strong>Salt</strong> for chemical use<br />
7%<br />
De-icing salt<br />
39%<br />
Other<br />
5%<br />
9M/2010<br />
Food grade salt<br />
20%<br />
Industrial salt<br />
31%<br />
<strong>Salt</strong> for chemical use<br />
5%<br />
Product mix:<br />
The very balanced<br />
product mix could be<br />
maintained over the<br />
years, even after<br />
acquiring SPL and<br />
Morton <strong>Salt</strong>.<br />
2005<br />
Overseas 1%<br />
Rest<br />
<strong>of</strong> Europe<br />
54%<br />
Revenues by region<br />
Germany<br />
45%<br />
Overseas 72%<br />
9M/2010<br />
Germany<br />
13%<br />
Rest<br />
<strong>of</strong> Europe<br />
15%<br />
Regional mix:<br />
The strong dependence<br />
on Europe could be<br />
diversified towards a<br />
more balanced regional<br />
mix with overseas sales<br />
in particular in the US,<br />
Canada, Chile and<br />
Brazil.<br />
December 2010 <strong>K+S</strong> Group 13
<strong>Salt</strong><br />
Mitigation <strong>of</strong> Volatility in De-icing Business<br />
Sales Volume De-icing <strong>Salt</strong> ISCO*:<br />
Sales Volume De-icing <strong>Salt</strong> Morton*:<br />
Sales Volume De-icing <strong>Salt</strong> esco*:<br />
5,000<br />
8,000<br />
4,000<br />
4,000<br />
6,000<br />
3,000<br />
1.000 t<br />
3,000<br />
2,000<br />
1.000 t<br />
4,000<br />
1.000 t<br />
2,000<br />
1,000<br />
2,000<br />
1,000<br />
-<br />
2006 2007 2008 2009 2010e<br />
-<br />
2006 2007 2008 2009 2010e<br />
0<br />
2006 2007 2008 2009 2010e<br />
10 year average sales volume (2000 – 2009) * before consolidation <strong>of</strong> intersegment sales volumes<br />
1.000 t<br />
14,000<br />
12,000<br />
10,000<br />
8,000<br />
6,000<br />
4,000<br />
2,000<br />
0<br />
2006 2007 2008 2009 2010e<br />
esco Morton SPL<br />
The worldwide de-icing salt market<br />
exhibits varying volatility<br />
Access to the largest de-icing world<br />
markets mitigates the overall degree<br />
<strong>of</strong> fluctuation in the de-icing salt<br />
business<br />
Unique, interregional production<br />
network (including access to salt<br />
production from potash facilities)<br />
allows benefiting from strong demand<br />
surges at short notice<br />
December 2010 <strong>K+S</strong> Group 14
<strong>Salt</strong><br />
Morton <strong>Salt</strong> Reduces Earnings Volatility<br />
Million €<br />
500<br />
400<br />
300<br />
EBITDA <strong>of</strong> <strong>Salt</strong> Business Segment<br />
(without Morton <strong>Salt</strong>) ≙ esco + SPL<br />
EBITDA <strong>of</strong> Morton <strong>Salt</strong><br />
EBITDA <strong>of</strong> <strong>Salt</strong> Business Segment<br />
Standard deviation<br />
<strong>Salt</strong> Business Segment (without<br />
Morton <strong>Salt</strong>): 42.4%<br />
<strong>Salt</strong> Business Segment<br />
(including Morton <strong>Salt</strong>): 20.5%<br />
%<br />
25<br />
20<br />
15<br />
200<br />
10<br />
100<br />
5<br />
EBITDA-Margin <strong>of</strong> <strong>Salt</strong> Business Segment<br />
(without Morton <strong>Salt</strong>) ≙ esco + SPL<br />
EBITDA-Margin <strong>of</strong> <strong>Salt</strong> Business Segment<br />
(including Morton <strong>Salt</strong>)<br />
0<br />
2000 2001 2002 2003 2004 2005<br />
0<br />
2006 2007 2008 2009LTM*<br />
2011e** 2008 2000 2009 2001 2002 2003 2004 2005 2006 2007 2008 2009 LTM*<br />
• With the acquisition <strong>of</strong> Morton <strong>Salt</strong>, standard deviation <strong>of</strong> EBITDA more than halved to approx. 20%<br />
• In addition, Morton <strong>Salt</strong> reduces volatility in EBITDA margins significantly<br />
• Furthermore, the level <strong>of</strong> EBITDA margin is also positively impacted by the acquisition <strong>of</strong> Morton <strong>Salt</strong><br />
* LTM=Last twelve months as <strong>of</strong> 30 September 2010; ** Middle <strong>of</strong> corridor between € 175 to 190 million, the current EBIT potential <strong>of</strong> the whole <strong>Salt</strong> business<br />
segment assuming normal de-icing salt sales at their multi-year average level<br />
December 2010 <strong>K+S</strong> Group 15
<strong>Salt</strong><br />
Historical and Recent Volume and Price Development<br />
Million tonnes Morton <strong>Salt</strong> (as <strong>of</strong><br />
€<br />
25<br />
1 October 2009)<br />
SPL (as <strong>of</strong><br />
70<br />
20<br />
1 July 2006)<br />
22<br />
21<br />
60<br />
55.5<br />
53.4*<br />
9<br />
49.1<br />
48.7<br />
50<br />
45.0 45.5<br />
9<br />
9<br />
15<br />
14.81<br />
40<br />
10<br />
5<br />
0<br />
6.07<br />
2.82<br />
3.25<br />
8.02<br />
3.90<br />
4.12<br />
8.77<br />
4.73<br />
4.04<br />
5.85 9.47<br />
5.00<br />
4.47<br />
5.85<br />
8.96<br />
2005 2006 2007 2008 2009 2010e<br />
13<br />
• Sales volumes increased over the past years mainly due to external growth, while the de-icing salt share<br />
remained rather stable<br />
• The price level for de-icing salt was tending upwards over the past years - a trend that might pause in 2010<br />
• Sales volume 2010e: 22 million tonnes (<strong>of</strong> which de-icing salt: 13 million tonnes)<br />
• Sales volume 2011e based on long-term average volumes: 21 million tonnes (<strong>of</strong> which de-icing salt: 12 million<br />
tonnes)<br />
* Average selling price in 9M/10<br />
December 2010 <strong>K+S</strong> Group 16<br />
12<br />
2011e<br />
30<br />
20<br />
10<br />
0<br />
De-icing salt sales volume<br />
Sales volume <strong>of</strong> industrial salt,<br />
salt for chemical use and food grade salt<br />
Yearly average price <strong>of</strong> de-icing salt
<strong>Salt</strong><br />
Cost Situation<br />
• Personnel<br />
• Annual work-time accounts in Germany make high degree <strong>of</strong> flexibility possible<br />
• Performance-related salary component, in Germany applicable to all employees<br />
• Personnel exchange with Potash and Magnesium Business Segment possible<br />
• Seasonal adjustment <strong>of</strong> workforce in <strong>America</strong> possible<br />
• Energy<br />
• One site in the Netherlands will switch to using steam from a substitute fuel heating plant<br />
in 2011<br />
• Continuous technical improvements and investments<br />
Outlook: energy cost increases will be mitigated in the medium-term perspective due<br />
to the above-mentioned measures<br />
• Freight/Logistics <strong>Salt</strong> Supply<br />
• Own shipping company with global market knowledge and six own vessels<br />
• Medium-term sea freight contracts and freight hedging<br />
• Determination <strong>of</strong> group-wide most efficient sourcing<br />
Outlook: lower sea freight and synergies in ground freight expected<br />
December 2010 <strong>K+S</strong> Group 17
<strong>Salt</strong><br />
Capex/Depreciation History and Outlook (2013)<br />
Million € %<br />
150<br />
200<br />
125<br />
175<br />
150<br />
100<br />
125<br />
75<br />
100<br />
50<br />
25<br />
0<br />
2004<br />
2005 2006 2007 2008 2009 2010e 2011e 2012e 2013e<br />
75<br />
50<br />
25<br />
0<br />
Capex (lhs)<br />
Capex/depreciation incl.<br />
ppa depreciation (rhs)<br />
Capex/depreciation excl.<br />
ppa depreciation (rhs)<br />
• Capex increased following the acquisitions <strong>of</strong> SPL in 2006 and Morton <strong>Salt</strong> in 2009<br />
• Temporary increase in capex/depreciation ratio caused by investments in ships and harbour facility in Chile<br />
• PPA depreciation lowers capex/depreciation ratio. Without PPA, the ratio will fluctuate around 100%<br />
December 2010 <strong>K+S</strong> Group 18
<strong>Salt</strong><br />
Content<br />
A. <strong>Salt</strong> Market Environment<br />
B. The <strong>K+S</strong> <strong>Salt</strong> Business<br />
C. <strong>K+S</strong>’ Position in Competitive Environment<br />
D. Growth Perspectives & Strategy<br />
December 2010 <strong>K+S</strong> Group 19
<strong>Salt</strong><br />
Competitive advantage<br />
Production<br />
network and<br />
Know-how<br />
Logistics<br />
network<br />
Product<br />
portfolio<br />
• Geographical diversification <strong>of</strong> production facilities within a region and<br />
across continents<br />
• Access to multitude <strong>of</strong> technical and geological experts within the<br />
<strong>K+S</strong> Group<br />
• Mixture <strong>of</strong> own ships, medium-term sea freight contracts and<br />
freight hedging<br />
• Utilisation <strong>of</strong> global logistic knowledge <strong>of</strong> <strong>K+S</strong> Group<br />
• Close supply chain cooperation for most efficient group-wide<br />
sourcing<br />
• Balanced and less cyclical product portfolio<br />
• Product innovations through access to group-wide<br />
R&D network<br />
December 2010 <strong>K+S</strong> Group 20
<strong>Salt</strong><br />
Unique Production Network / Excellence in Logistics<br />
December 2010 <strong>K+S</strong> Group 21
<strong>Salt</strong><br />
Comparison <strong>of</strong> Portfolios with Competitors<br />
<strong>K+S</strong><br />
China National<br />
<strong>Salt</strong><br />
Compass<br />
Minerals<br />
Dampier<br />
<strong>Salt</strong><br />
Number <strong>of</strong> production sites<br />
<strong>of</strong> which<br />
34<br />
14<br />
8<br />
3<br />
Rock salt<br />
10<br />
3<br />
Solar evaporation salt<br />
7<br />
4<br />
1<br />
3<br />
Vacuum salt<br />
17<br />
10<br />
4<br />
Product portfolio (% <strong>of</strong> sales volume, <strong>K+S</strong>: LTM as <strong>of</strong> 30 September 2010)<br />
De-icing salt<br />
Industrial salt<br />
<strong>Salt</strong> for chemical use<br />
Food grade salt<br />
Other<br />
<br />
<br />
<br />
A diversified production network reduces the risk <strong>of</strong> dependence on a single production centre<br />
and sales region<br />
Geographical diversification <strong>of</strong> production centres makes regional production close to<br />
customers possible and helps to optimize logistical costs<br />
A broad product portfolio reduces the volatility <strong>of</strong> revenues and earnings<br />
Source: company information, own estimates<br />
December 2010 <strong>K+S</strong> Group 22
<strong>Salt</strong><br />
Content<br />
A. <strong>Salt</strong> Market Environment<br />
B. The <strong>K+S</strong> <strong>Salt</strong> Business<br />
C. <strong>K+S</strong>’ Position in Competitive Environment<br />
D. Growth Perspectives & Strategy<br />
December 2010 <strong>K+S</strong> Group 23
<strong>Salt</strong><br />
Regional Growth Perspectives – <strong>North</strong> <strong>America</strong><br />
Overall stable growth prospects<br />
• Chemical:<br />
• New construction <strong>of</strong> chlor-alkali facilities in progress in the US<br />
• Recently established chlorine transportation regulation will lead to smaller plants close to<br />
sea ports and point <strong>of</strong> demand, easily accessible by vessels<br />
<strong>K+S</strong> will benefit through its extensive production network<br />
• De-icing:<br />
• Ongoing infrastructure development<br />
Through its presence in major de-icing regions, Morton and ISCO are well<br />
positioned to capture additional demand<br />
• Food:<br />
• Sodium intake debate will spur demand for innovative low sodium products and sea salts<br />
<strong>K+S</strong> is the only salt producer that can <strong>of</strong>fer a wide range <strong>of</strong> sea salts as well as an<br />
in-house solution to consumers and clients, which is a blend <strong>of</strong> <strong>Salt</strong> and KCl<br />
December 2010 <strong>K+S</strong> Group 24
<strong>Salt</strong><br />
Regional Growth Perspectives – Europe<br />
• Chemical:<br />
• Limited market growth<br />
esco will commit more capacity to strongly growing salt specialities<br />
• De-icing:<br />
• Ongoing infrastructure investment in Europe<br />
esco mine Bernburg well located to capture strong growth in selected markets<br />
in Eastern Europe<br />
• Industrial:<br />
Market growth mainly within salt specialities segment<br />
• Strong market growth in industrial speciality segments<br />
Redirection <strong>of</strong> vacuum salt capacity to capture growth in high-margin salt<br />
specialities<br />
December 2010 <strong>K+S</strong> Group 25
<strong>Salt</strong><br />
Regional Growth Perspectives – South <strong>America</strong><br />
Overall strong market growth prospects<br />
• Chemical:<br />
• New chlor-alkali projects in Central and South <strong>America</strong><br />
• Food:<br />
• Market growth in line with population development<br />
• Industrial:<br />
• Strong market growth in industrial specialty segments<br />
<br />
Production facilities in Chile and Brazil are optimally located to deliver growth<br />
markets in South <strong>America</strong><br />
December 2010 <strong>K+S</strong> Group 26
<strong>Salt</strong><br />
Regional Growth Perspectives – Asia<br />
Overall very strong growth prospects<br />
• Chemical:<br />
• Local chlor-alkali capacities to grow at estimated 2 million tonnes per year<br />
• De-icing:<br />
• Infrastructure development and road safety concerns will foster development <strong>of</strong> local<br />
de-icing market<br />
• Food:<br />
• Change <strong>of</strong> eating habits is driving strong growth in processed food<br />
<br />
<strong>K+S</strong> is studying long-term options <strong>of</strong> how to participate in selected, attractive segments<br />
December 2010 <strong>K+S</strong> Group 27
<strong>Salt</strong><br />
Current and Medium-term EBIT Potential<br />
Million €<br />
250<br />
Reasons for pr<strong>of</strong>itability growth:<br />
200<br />
150<br />
100<br />
175 - 190<br />
• Growth in high-margin<br />
specialities<br />
• Growth in adjacent markets<br />
• Improvements in energy<br />
efficiency<br />
• Logistics flow optimizations<br />
• Other business synergies<br />
50<br />
0<br />
Current EBIT potential assuming<br />
normal de-icing salt sales at their<br />
multi-year average level<br />
Medium-term EBIT potential<br />
December 2010 <strong>K+S</strong> Group 28
<strong>Salt</strong><br />
Strategy <strong>of</strong> the <strong>Salt</strong> Business Segment<br />
Growth<br />
Market<br />
Optimisation<br />
Optimisation <strong>of</strong> current<br />
business<br />
Strategic Focus<br />
Entry into new regional markets<br />
Strengthening <strong>of</strong> positions in existing<br />
and adjacent markets<br />
Optimal resource utilisation by<br />
constantly optimising the current<br />
network and structures<br />
Short-term mid/long-term<br />
December 2010 <strong>K+S</strong> Group 29
<strong>K+S</strong> Group<br />
Forward-Looking Statements<br />
This presentation contains facts and forecasts that relate to the future development <strong>of</strong> the <strong>K+S</strong><br />
Group and its companies. The forecasts are estimates that we have made on the basis <strong>of</strong> all the<br />
information available to us at this moment in time. Should the assumptions underlying these forecasts<br />
prove not to be correct or should certain risks – such as those referred to in the recent Risk<br />
Report – materialise, actual developments and events may deviate from current expectations. The<br />
Company assumes no obligation to update the statements contained in this presentation, save for<br />
the making <strong>of</strong> such disclosures as are required by the provisions <strong>of</strong> statute.<br />
December 2010 <strong>K+S</strong> Group <strong>K+S</strong> Group 30
<strong>K+S</strong> Aktiengesellschaft<br />
Bertha-von-Suttner-Straße 7<br />
34131 Kassel | Germany<br />
phone: +49 (0)561 / 9301-0<br />
fax: +49 (0)561 / 9301-1753<br />
Investor Relations<br />
phone: +49 (0)561 / 9301-1100<br />
fax: +49 (0)561 / 9301-2425<br />
email:<br />
investor-relations@k-plus-s.com<br />
Internet: www.k-plus-s.com<br />
Experience growth.