Standardpräsentation Investor Relations - K+S Aktiengesellschaft
Standardpräsentation Investor Relations - K+S Aktiengesellschaft
Standardpräsentation Investor Relations - K+S Aktiengesellschaft

Create successful ePaper yourself
Turn your PDF publications into a flip-book with our unique Google optimized e-Paper software.
1982/83<br />
1987/88<br />
1992/93<br />
1997/98<br />
2002/03<br />
2007/08<br />
2011/12<br />
2012/13<br />
e<br />
in million tonnes<br />
Potash and Magnesium Products<br />
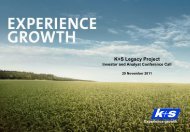
Low Stocks-to-use Ratios of Agricultural Products<br />
Production and demand development vs. stocks-to-use ratio (Wheat and coarse grains)<br />
1900<br />
45,0 45.0<br />
1800<br />
Production Demand Stocks-to-use<br />
40,0 40.0<br />
1700<br />
35,0 35.0<br />
1600<br />
30,0 30.0<br />
1500<br />
25,0 25.0<br />
1400<br />
Critical Level<br />
20,0 20.0<br />
1300<br />
15,0 15.0<br />
1200<br />
10,0 10.0<br />
1100<br />
5,0 5.0<br />
1000<br />
0,0 0.0<br />
Stocks-to-use ratio<br />
• Over the past thirty years, annual global production has often fallen short of demand.<br />
• Despite reasonable harvest levels during the last ten years, these structural supply and<br />
demand gaps have resulted in historically low stocks-to-use ratios. This ratio relates available<br />
stocks to estimated demand of one year and therefore can be translated into the number of days the stocks<br />
would last without any new harvests. A stocks-to-use ratio of 20% can be translated into 73 days.<br />
• The production level for the agricultural year 2012/13 expected by the USDA will not be efficient to meet<br />
consumption, so that stocks-to-use ratio will remain very low (18.4% or 66 days).<br />
June 2013<br />
Source: USDA; as of 12 June 2013<br />
<strong>K+S</strong> Group<br />
14