2009-2010 Self-Study WASC Action Plan - Julian Charter School
2009-2010 Self-Study WASC Action Plan - Julian Charter School
2009-2010 Self-Study WASC Action Plan - Julian Charter School

You also want an ePaper? Increase the reach of your titles
YUMPU automatically turns print PDFs into web optimized ePapers that Google loves.
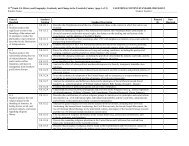
STUDENT PERFORMANCE DATA<br />
ACADEMIC PERFORMANCE INDEX (API)<br />
JCS showed a 35-point growth in its API in 2008 (30 points above<br />
the growth target). Continual progress was reported in each of the<br />
last three year reporting periods (2007-<strong>2009</strong>) as shown in Table 9.<br />
Table 8: <strong>School</strong>wide Academic Performance Index (API)<br />
API Score Statewide Similar Required API Score for<br />
Year<br />
(Growth) Rank <strong>School</strong>s Rank Next Year (Actual Score)<br />
Met API Target?<br />
(+/- target)<br />
2006 717 7 9 726 No -9<br />
2007 730 7 10 730 Yes +0<br />
2008 764 8 10 734 Yes +30<br />
<strong>2009</strong> 770 TBD TBD 768 Yes +2<br />
Source: DataQuest<br />
Each of the school's “numerically significant” subgroups (Socioeconomically<br />
Disadvantaged (SED), White, and Hispanic/Latino)<br />
met its growth target in the last three years. As of 2008, Students<br />
with Disabilities are classed as a significant subgroup.<br />
Table 9: Academic Performance Index (API) Including Significant Subgroups<br />
API Growth Targets<br />
2007 2008 <strong>2009</strong><br />
Base Growth Met? Base Growth Met? Base Growth Met?<br />
<strong>School</strong>wide 725 730 Yes 729 764 Yes 763 770 Yes<br />
African-Am./Black * * * * * *<br />
Am. Indian/AK Native * * * * * *<br />
Asian * * * * * *<br />
Filipino * * * * * *<br />
Hispanic or Latino 667 690 Yes 689 705 Yes 703 710 Yes<br />
Pacific Islander * * * * * *<br />
White not Hispanic 737 742 Yes 741 777 Yes 776 783 Yes<br />
SED** 649 671 Yes 670 717 Yes 718 723 Yes<br />
English Learners * * * * * *<br />
Students w/Disabilities * * * 580 578 586 No<br />
* Not a numerically significant subgroup for the reporting period<br />
**SED: Students on the free/reduced price lunch program or those whose parents did not attend college<br />
***Significant Subgroups: 100 students w/valid test scores or 15% of the tested enrollment w/50 students<br />
Source: DataQuest<br />
STAR TEST RESULTS<br />
In evaluating the results of the STAR program, JCS has noted the<br />
following data trends:<br />
ENGLISH-L ANGUAGE ARTS<br />
• The number of students meeting the proficiency target in<br />
the elementary grades (K-6) increases with each grade level.<br />
Chapter 1: Student/Community Profile<br />
<strong>Julian</strong> <strong>Charter</strong> <strong>School</strong> Focus on Learning <strong>2009</strong>-<strong>2010</strong> 15