2009-2010 Self-Study WASC Action Plan - Julian Charter School
2009-2010 Self-Study WASC Action Plan - Julian Charter School
2009-2010 Self-Study WASC Action Plan - Julian Charter School

You also want an ePaper? Increase the reach of your titles
YUMPU automatically turns print PDFs into web optimized ePapers that Google loves.
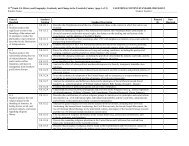
California Physical Fitness Test Results (<strong>School</strong> Year 2008-09)<br />
The California Physical Fitness Test is administered to students in grades 5, 7, and 9 only. This table displays by grade<br />
level the percent of students meeting the healthy fitness zone on all six fitness standards for the most recent testing<br />
period. Detailed information regarding this test, and comparisons of a school’s test results to the district and state levels,<br />
may be found at the CDE Physical Fitness Testing (PFT) Web page.<br />
Grade<br />
Percent of Students Meeting Healthy Fitness Zones<br />
Level Four of Six Standards Five of Six Standards Six of Six Standards<br />
5 20.8 31.2 20.8<br />
7 22.8 31.7 21.1<br />
9 24.5 28.2 14.7<br />
X. Accountability<br />
Academic Performance Index<br />
The Academic Performance Index (API) is an annual measure of the academic performance and progress of schools in<br />
California. API scores range from 200 to 1,000, with a statewide target of 800. Detailed information about the API can be<br />
found at the CDE Academic Performance Index (API) Web page.<br />
API Ranks – Three-Year Comparison<br />
This table displays the school’s statewide and similar schools API ranks. The statewide API rank ranges from 1 to 10. A<br />
statewide rank of 1 means that the school has an API score in the lowest 10 percent of all schools in the state, while a<br />
statewide rank of 10 means that the school has an API score in the highest 10 percent of all schools in the state. The<br />
similar schools API rank reflects how a school compares to 100 statistically matched “similar schools.” A similar schools<br />
rank of 1 means that the school’s academic performance is comparable to the lowest performing 10 schools of the 100<br />
similar schools, while a similar schools rank of 10 means that the school’s academic performance is better than at least 90<br />
of the 100 similar schools.<br />
API Rank 2006 2007 2008<br />
Statewide 7 7 8<br />
Similar <strong>School</strong>s 9 10 10<br />
API Changes by Student Group – Three-Year Comparison<br />
This table displays, by student group, the actual API changes in points added or lost for the past three years, and the<br />
most recent API score. Note: "N/A" means that the student group is not numerically significant.<br />
Growth API<br />
Actual API Change<br />
Group<br />
Score<br />
2005-06 2006-07 2007-08 2008<br />
All Students at the <strong>School</strong> 5 35 7 770<br />
African American N/A N/A N/A N/A<br />
American Indian or Alaska Native N/A N/A N/A N/A<br />
Asian/Filipino N/A N/A N/A N/A<br />
Hispanic or Latino 23 15 7 710<br />
Pacific Islander N/A N/A N/A N/A<br />
White (not Hispanic) 5 36 7 783<br />
Socioeconomically Disadvantaged 22 47 5 723<br />
English Learners N/A N/A N/A N/A<br />
Students with Disabilities N/A N/A N8 586<br />
Adequate Yearly Progress<br />
The federal NCLB Act requires that all schools and districts meet the following Adequate Yearly Progress (AYP) criteria:<br />
• Participation rate on the state’s standards-based assessments in English-language arts (ELA) and mathematics<br />
• Percent proficient on the state’s standards-based assessments in ELA and mathematics<br />
• API as an additional indicator<br />
• Graduation rate (for secondary schools)<br />
Appendix<br />
140 <strong>Julian</strong> <strong>Charter</strong> <strong>School</strong> Focus on Learning <strong>2009</strong>-<strong>2010</strong>