2009-2010 Self-Study WASC Action Plan - Julian Charter School
2009-2010 Self-Study WASC Action Plan - Julian Charter School
2009-2010 Self-Study WASC Action Plan - Julian Charter School

Create successful ePaper yourself
Turn your PDF publications into a flip-book with our unique Google optimized e-Paper software.
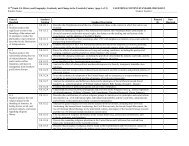
White (not Hispanic) 61 39 55 41<br />
Male 54 40 48 40<br />
Female 63 34 50 37<br />
Economically Disadvantaged 44 25 32 27<br />
English Learners * * * *<br />
Students with Disabilities 30 28 36 14<br />
California High <strong>School</strong> Exit Examination<br />
The California High <strong>School</strong> Exit Examination (CAHSEE) is primarily used as a graduation requirement. However, the<br />
grade 10 results of this exam are also used to establish the percentages of students at three proficiency levels (not<br />
proficient, proficient, or advanced) in ELA and mathematics in order to compute Adequate Yearly Progress (AYP)<br />
designations as required by the federal NCLB Act of 2001. Detailed information regarding CAHSEE results can be found<br />
at the CAHSEE Web site. Note: Scores are not shown when the number of students tested is 10 or less, either because<br />
the number of students in this category is too small for statistical accuracy, or to protect student privacy. In no case shall a<br />
group score be reported that deliberately/inadvertently makes public the score or performance of an individual student.<br />
CAHSEE Results for Grade 10 Students – Three-Year Comparison<br />
This table displays the percent of students passing the CAHSEE with a score of 350 or above in English-language arts<br />
and mathematics.<br />
Subject<br />
<strong>School</strong> District State<br />
2006-07 2007-08 2008-09 2006-07 2007-08 2008-09 2006-07 2007-08 2008-09<br />
English-Language Arts 79% 88% 91% N/A N/A N/A 77% 79% 79%<br />
Mathematics 72% 84% 77% N/A N/A N/A 76% 78% 80%<br />
CAHSEE Results by Performance Level for All Students – Three-Year Comparison<br />
This table displays the percent of students achieving at the Proficient or Advanced level in English-language arts and<br />
mathematics.<br />
Subject<br />
<strong>School</strong> District State<br />
2006-07 2007-08 2008-09 2006-07 2007-08 2008-09 2006-07 2007-08 2008-09<br />
English-Language Arts 55.6% 63.9% 72.7% N/A N/A N/A 48.6% 52.9% 52.0%<br />
Mathematics 41.3% 54.4% 52.3% N/A N/A N/A 49.9% 51.3% 53.3%<br />
CAHSEE Results by Performance Level for Student Groups – Most Recent Year<br />
This table displays the percent of students, by group, achieving at each performance level in English-language arts and<br />
mathematics for the most recent testing period. (Passing = 350 or above; Proficient, for NCLB purposes, is defined as 380<br />
for both ELA and math. Advanced, for NCLB purposes, is defined as 403 for ELA and 422 for math.)<br />
Group<br />
English-Language Arts<br />
Not<br />
Proficient Advanced<br />
Proficient<br />
Not<br />
Proficient<br />
Mathematics<br />
Proficient<br />
Advanced<br />
All Students 27.3 27.3 45.5 47.7 39.8 12.5<br />
Male 38.9 27.8 33.3 50.0 41.7 8.3<br />
Female 19.2 26.9 53.8 46.2 38.5 15.4<br />
African American * * * * * *<br />
American Indian or Alaska Native * * * * * *<br />
Asian/Filipino * * * * * *<br />
Hispanic or Latino 37.5 31.2 31.2 76.5 17.6 5.9<br />
Pacific Islander * * * * * *<br />
White (not Hispanic) 23.8 27.0 49.2 40.3 45.2 14.5<br />
Economically Disadvantaged 35.2 35.3 29.4 56.2 37.5 6.2<br />
English Learners * * * * * *<br />
Students with Disabilities * * * * * *<br />
Appendix<br />
<strong>Julian</strong> <strong>Charter</strong> <strong>School</strong> Focus on Learning <strong>2009</strong>-<strong>2010</strong> 139