2009-2010 Self-Study WASC Action Plan - Julian Charter School
2009-2010 Self-Study WASC Action Plan - Julian Charter School
2009-2010 Self-Study WASC Action Plan - Julian Charter School

Create successful ePaper yourself
Turn your PDF publications into a flip-book with our unique Google optimized e-Paper software.
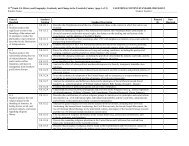
California Department of Education<br />
Statewide Assessment Division<br />
Return to Test Results Search<br />
California Standardized Testing and Reporting (STAR)<br />
<strong>Julian</strong> <strong>Charter</strong> <strong>School</strong><br />
All Students<br />
Total Enrollment on First Day of Testing: 1,601 County Name: San Diego County<br />
Total Number Tested: 1,547 District Name: <strong>Julian</strong> <strong>Charter</strong> District<br />
Total Number Tested in Selected Subgroup: 1,547<br />
<strong>School</strong> Name: <strong>Julian</strong> <strong>Charter</strong> <strong>School</strong><br />
CDS Code: 37-68163-3731239<br />
California Standards Test Scores - <strong>2009</strong><br />
Grades<br />
2 3 4 5 6 7 8 9 10 11 EOC<br />
Reported Enrollment 134 143 145 129 153 171 150 193 189 194<br />
CST English-Language Arts<br />
Students Tested 129 136 135 118 150 167 142 190 184 190<br />
% of Enrollment 96.3 % 95.1 % 93.1 % 91.5 % 98.0 % 97.7 % 94.7 % 98.4 % 97.4 % 97.9 %<br />
Students with Scores 128 136 135 117 150 167 142 190 184 190<br />
Mean Scale Score 351.8 349.6 382.3 381.4 373.6 376.3 364.7 364.9 340.2 330.6<br />
% Advanced 20 % 21 % 42 % 32 % 31 % 34 % 26 % 28 % 22 % 13 %<br />
% Proficient 33 % 29 % 29 % 43 % 43 % 38 % 32 % 32 % 23 % 24 %<br />
% Basic 27 % 29 % 22 % 18 % 17 % 20 % 32 % 29 % 27 % 28 %<br />
% Below Basic 11 % 15 % 5 % 5 % 7 % 6 % 9 % 6 % 16 % 21 %<br />
% Far Below Basic 9 % 7 % 1 % 3 % 2 % 2 % 1 % 4 % 12 % 14 %<br />
CST Mathematics<br />
Students Tested 129 136 135 117 149 163<br />
% of Enrollment 96.3 % 95.1 % 93.1 % 90.7 % 97.4 % 95.3 %<br />
Students with Scores 129 135 135 115 149 163<br />
Mean Scale Score 360.3 358.7 361.4 349.2 343.7 342.5<br />
% Advanced 26 % 23 % 24 % 17 % 16 % 10 %<br />
% Proficient 30 % 32 % 32 % 24 % 26 % 31 %<br />
% Basic 23 % 21 % 27 % 27 % 36 % 36 %<br />
% Below Basic 17 % 22 % 16 % 24 % 14 % 19 %<br />
% Far Below Basic 4 % 2 % 1 % 8 % 8 % 4 %<br />
CST General Mathematics<br />
Students Tested 97 52 149<br />
% of Enrollment 64.7 % 26.9 %<br />
Students with Scores 96 52 148<br />
Mean Scale Score 338.5 305.9 327.2<br />
% Advanced 4 % 0 % 3 %<br />
% Proficient 36 % 23 % 32 %<br />
% Basic 41 % 25 % 35 %<br />
% Below Basic 15 % 38 % 23 %<br />
% Far Below Basic 4 % 13 % 7 %<br />
CST Algebra I<br />
Students Tested 4 40 94 54 39 231<br />
% of Enrollment 2.3 % 26.7 % 48.7 % 28.6 % 20.1 %<br />
Appendix<br />
<strong>Julian</strong> <strong>Charter</strong> <strong>School</strong> Focus on Learning <strong>2009</strong>-<strong>2010</strong> 125