2009-2010 Self-Study WASC Action Plan - Julian Charter School
2009-2010 Self-Study WASC Action Plan - Julian Charter School
2009-2010 Self-Study WASC Action Plan - Julian Charter School

Create successful ePaper yourself
Turn your PDF publications into a flip-book with our unique Google optimized e-Paper software.
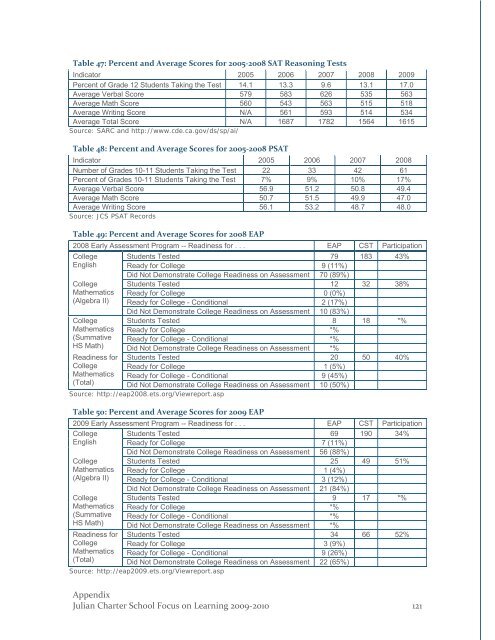
Table 47: Percent and Average Scores for 2005-2008 SAT Reasoning Tests<br />
Indicator 2005 2006 2007 2008 <strong>2009</strong><br />
Percent of Grade 12 Students Taking the Test 14.1 13.3 9.6 13.1 17.0<br />
Average Verbal Score 579 583 626 535 563<br />
Average Math Score 560 543 563 515 518<br />
Average Writing Score N/A 561 593 514 534<br />
Average Total Score N/A 1687 1782 1564 1615<br />
Source: SARC and http://www.cde.ca.gov/ds/sp/ai/<br />
Table 48: Percent and Average Scores for 2005-2008 PSAT<br />
Indicator 2005 2006 2007 2008<br />
Number of Grades 10-11 Students Taking the Test 22 33 42 61<br />
Percent of Grades 10-11 Students Taking the Test 7% 9% 10% 17%<br />
Average Verbal Score 56.9 51.2 50.8 49.4<br />
Average Math Score 50.7 51.5 49.9 47.0<br />
Average Writing Score 56.1 53.2 48.7 48.0<br />
Source: JCS PSAT Records<br />
Table 49: Percent and Average Scores for 2008 EAP<br />
2008 Early Assessment Program -- Readiness for . . . EAP CST Participation<br />
College<br />
English<br />
College<br />
Mathematics<br />
(Algebra II)<br />
College<br />
Mathematics<br />
(Summative<br />
HS Math)<br />
Readiness for<br />
College<br />
Mathematics<br />
(Total)<br />
Students Tested 79 183 43%<br />
Ready for College 9 (11%)<br />
Did Not Demonstrate College Readiness on Assessment 70 (89%)<br />
Students Tested 12 32 38%<br />
Ready for College 0 (0%)<br />
Ready for College - Conditional 2 (17%)<br />
Did Not Demonstrate College Readiness on Assessment 10 (83%)<br />
Students Tested 8 18 *%<br />
Ready for College *%<br />
Ready for College - Conditional *%<br />
Did Not Demonstrate College Readiness on Assessment *%<br />
Students Tested 20 50 40%<br />
Ready for College 1 (5%)<br />
Ready for College - Conditional 9 (45%)<br />
Did Not Demonstrate College Readiness on Assessment 10 (50%)<br />
Source: http://eap2008.ets.org/Viewreport.asp<br />
Table 50: Percent and Average Scores for <strong>2009</strong> EAP<br />
<strong>2009</strong> Early Assessment Program -- Readiness for . . . EAP CST Participation<br />
College<br />
English<br />
College<br />
Mathematics<br />
(Algebra II)<br />
College<br />
Mathematics<br />
(Summative<br />
HS Math)<br />
Readiness for<br />
College<br />
Mathematics<br />
(Total)<br />
Students Tested 69 190 34%<br />
Ready for College 7 (11%)<br />
Did Not Demonstrate College Readiness on Assessment 56 (88%)<br />
Students Tested 25 49 51%<br />
Ready for College 1 (4%)<br />
Ready for College - Conditional 3 (12%)<br />
Did Not Demonstrate College Readiness on Assessment 21 (84%)<br />
Students Tested 9 17 *%<br />
Ready for College *%<br />
Ready for College - Conditional *%<br />
Did Not Demonstrate College Readiness on Assessment *%<br />
Students Tested 34 66 52%<br />
Ready for College 3 (9%)<br />
Ready for College - Conditional 9 (26%)<br />
Did Not Demonstrate College Readiness on Assessment 22 (65%)<br />
Source: http://eap<strong>2009</strong>.ets.org/Viewreport.asp<br />
Appendix<br />
<strong>Julian</strong> <strong>Charter</strong> <strong>School</strong> Focus on Learning <strong>2009</strong>-<strong>2010</strong> 121