2009-2010 Self-Study WASC Action Plan - Julian Charter School
2009-2010 Self-Study WASC Action Plan - Julian Charter School
2009-2010 Self-Study WASC Action Plan - Julian Charter School

You also want an ePaper? Increase the reach of your titles
YUMPU automatically turns print PDFs into web optimized ePapers that Google loves.
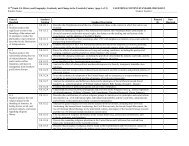
Table 30: CAHSEE English-Language Arts (ELA)<br />
Percent of Students by Graduating Class Who Have Passed<br />
Class of 2007<br />
Class of 2008<br />
Class of <strong>2009</strong><br />
All<br />
Administrations<br />
All<br />
Administrations<br />
All<br />
Administrations<br />
Count % Passed Count % Passed Count % Passed<br />
All Students<br />
<strong>School</strong> - All Students 149/155 96% 156/163 96% 151/156 97%<br />
Gender<br />
Male 75/77 97% 73/77 95% 63/65 97%<br />
Female 74/78 95% 83/86 97% 88/91 97%<br />
Race/Ethnicity<br />
African American/Black 5/5 100% 9/10 90% 5/5 100%<br />
Am. Indian/AK Native 5/6 83% 4/4 100% 4/4 100%<br />
Asian 2/2 100% 3/3 100% 4/4 100%<br />
Filipino 2/2 100% 1/1 100% 3/3 100%<br />
Hispanic/Latino 21/23 91% 26/28 93% 29/30 97%<br />
Pacific Islander 1/1 100% 2/2 100% 0 -<br />
White not Hispanic 110/113 97% 110/114 96% 106/110 96%<br />
Multiple/No Response 3/3 100% 1/1 100% 0 -<br />
Language Fluency<br />
English Only 148/154 96% 155/162 96% 151/156 97%<br />
Redesignated FEP 1/1 100% 1/1 100% 0 -<br />
EL 0 - 0 - 0 -<br />
General Education/Special Education or 504<br />
General Education 136/138 99% 144/147 98% 142/143 99%<br />
Special Education/504 13/17 76% 12/16 75% 10/13 77%<br />
Table 31: CAHSEE Mathematics<br />
Percent of Students by Graduating Class Who Have Passed<br />
Class of 2007<br />
Class of 2008<br />
Class of <strong>2009</strong><br />
All<br />
Administrations<br />
All<br />
Administrations<br />
All<br />
Administrations<br />
Count % Passed Count % Passed Count % Passed<br />
All Students<br />
<strong>School</strong> - All Students 148/155 95% 149/163 91% 149/156 96%<br />
Gender<br />
Male 76/77 99% 70/77 91% 64/65 98%<br />
Female 72/78 92% 79/86 92% 85/91 93%<br />
Race/Ethnicity<br />
African American/Black 5/5 100% 8/10 80% 5/5 100%<br />
Am. Indian/AK Native 5/6 83% 3/4 75% 4/4 100%<br />
Asian 2/2 100% 3/3 100% 4/4 100%<br />
Filipino 2/2 100% 0/1 0% 3/3 100%<br />
Hispanic/Latino 21/23 91% 26/28 93% 30/30 100%<br />
Pacific Islander 1/1 100% 2/2 100% 0 -<br />
White not Hispanic 109/113 96% 106/114 93% 103/110 94%<br />
Multiple/No Response 3/3 100% 1/1 100% 0 -<br />
Language Fluency<br />
English Only 148/154 96% 148/162 91% 149/156 96%<br />
Redesignated FEP 0/1 0% 1/1 100% 0 -<br />
EL 0 - 0 - 0 -<br />
General Education/Special Education or 504<br />
General Education 134/138 97% 141/147 96% 140/143 98%<br />
Special Education/504 14/17 82% 8/16 50% 9/13 69%<br />
Appendix<br />
116 <strong>Julian</strong> <strong>Charter</strong> <strong>School</strong> Focus on Learning <strong>2009</strong>-<strong>2010</strong>