Unmasking Unreported Crime: Idaho Crime Victimization Survey
Unmasking Unreported Crime: Idaho Crime Victimization Survey
Unmasking Unreported Crime: Idaho Crime Victimization Survey

You also want an ePaper? Increase the reach of your titles
YUMPU automatically turns print PDFs into web optimized ePapers that Google loves.
<strong>Unmasking</strong> <strong>Unreported</strong> <strong>Crime</strong>:<br />
<strong>Idaho</strong> <strong>Crime</strong> <strong>Victimization</strong> <strong>Survey</strong><br />
2008<br />
BJS/JRSA National Conference<br />
October 23 rd , 2009<br />
St. Louis, MO
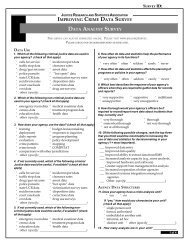
Purpose:<br />
• In March through May of 2009, <strong>Idaho</strong> State Police in<br />
collaboration with the University of <strong>Idaho</strong> conducted a<br />
victimization survey.<br />
• The purpose of the survey was:<br />
▫ To add to previous victimization research by ISP.<br />
▫ To have a better understanding of the amount of<br />
non-reported crime occurring in <strong>Idaho</strong>.<br />
▫ To understand the number of victims of domestic<br />
violence, sexual assault and stalking.
Methodology:<br />
• Randomly sampled 7,000 landline households,<br />
of which 2,668 agreed to participate<br />
▫ response rate of 48.2% and a participation rate of<br />
64.1%<br />
• Also sampled 5,000 mobile lines with 566<br />
agreeing to participate<br />
▫ 20% response rate and 35.8% participation rate<br />
• Total sample response rate: 38.9% with 56.3%<br />
participation rate.
Methodology Cont.<br />
• Questions were asked concerning:<br />
▫ property crime<br />
▫ violent crime<br />
▫ sexual assault<br />
▫ domestic violence<br />
▫ perceptions of crime and neighborhood safety<br />
▫ satisfaction of police services
• Much of<br />
<strong>Idaho</strong> is<br />
covered by<br />
mountains.<br />
• Most (approx.<br />
75%) of<br />
<strong>Idaho</strong>ans live<br />
in the Snake<br />
River plain.<br />
• <strong>Idaho</strong> has 15.6<br />
people per<br />
square mile<br />
(2003 est.)
Results:<br />
• Demographics:<br />
▫ Median age: 54.4 (range 18-98)<br />
▫ Gender: 44.3% Male, 55.7% Female<br />
▫ Race: 93.2% White<br />
▫ Ethnicity: 5.1% Hispanic<br />
▫ Educational level: Only 6.1% had less than high school.<br />
• 72.4% had some college, technical school, or above<br />
▫ Living area: 63.3% Urban<br />
36.7% Rural<br />
▫ Employment: 44.1% full-time, 29.9% retired<br />
▫ Marital Status: 69.2% Married<br />
▫ Children in household under 18 = 38.3%<br />
▫ Median Income Range: $40,000 - $49,999<br />
▫ Average number of years in <strong>Idaho</strong>: 30.8
Reported versus <strong>Unreported</strong> <strong>Crime</strong><br />
• 65.3% of the total survey population experienced<br />
a crime in 2008.<br />
▫ Of these, 49.7% reported a crime.<br />
• Reported crime is dependant upon severity of<br />
crime and characteristics of victims.<br />
• Victims who have reported a crime have<br />
different perceptions of law enforcement.<br />
▫ Weigh the odds of whether the crime will be<br />
resolved better with law enforcement involvement<br />
or without.
All <strong>Crime</strong> Victims:<br />
Reported crime:<br />
• Urban<br />
• HS grad<br />
• Employed part time*<br />
• Female*<br />
• Under $44,000<br />
• Non-white<br />
• Hispanic<br />
• 18 to 60<br />
• Living with partner,<br />
separated, divorced*<br />
Not reported crime:<br />
• Rural<br />
• College degree*<br />
• Student, homemaker*<br />
• Male*<br />
• Over $75,000*<br />
• White<br />
• Non-Hispanic<br />
• Over 60<br />
• Married, Single (never<br />
married)*<br />
*Significant Difference
Property <strong>Crime</strong>:<br />
Total Property <strong>Crime</strong>: 1450 incidents<br />
43% reported, 57% not reported<br />
• Pick-pocket: 32 victims<br />
▫ Reported 62.6% ; not reported 34.4%<br />
• Vandalism: 457 incidents, 295 victims<br />
▫ Reported: 50.8% reported; not reported 49.2%<br />
• Motor vehicle thefts: 352 incidents, 213 victims<br />
▫ Reported: 40.6%; not reported 59.4%<br />
• Larceny: 427 incidents; 238 victims<br />
▫ Reported 37.7%; not reported 62.3%<br />
• Theft from inside building: 182 incidents, 113 victims<br />
▫ Reported 37.4% of incidents, not reported 62.6%
Property <strong>Crime</strong> Cont. n=806<br />
• Not reported because (could answer more than one):<br />
▫ Incident not important, it was a minor offense (23.8%)<br />
▫ You believed the police couldn't do anything to help<br />
(19.4%)<br />
▫ You dealt with the incident in another way (7.2%)<br />
▫ You felt the crime was due to your own carelessness<br />
(5.4%)<br />
▫ You did not want to involve the police (4.7%)<br />
▫ The offender was a close family member or friend (3.3%)<br />
▫ Other (36.2%)
Property <strong>Crime</strong> Cont.<br />
Types of “Other” responses:<br />
▫ Didn’t know when it happened<br />
▫ Couldn’t prove it<br />
▫ Didn't even think to report it<br />
▫ Didn't want to go through the hassle/too busy
Property <strong>Crime</strong> Victim Characteristics<br />
Reported<br />
• Urban<br />
• Some college, associates<br />
• Employed full-time,<br />
retired<br />
• Over 60<br />
• Separated, divorced<br />
• Under $44,000<br />
• Female<br />
• Hispanic<br />
• Race, no difference<br />
Not reported<br />
• Rural<br />
• High School grad, Bachelor’s<br />
• Student, homemaker,<br />
unemployed<br />
• 18 –30 and 46 –60<br />
• living with partner, single<br />
• $45,000 to $75,000<br />
• Males<br />
• Non-Hispanic<br />
• Race no difference
Aggravated Assault:<br />
• 78 incidents/48 victims<br />
• Reported 47.4%; not reported 52.6%<br />
• Not reported because (could answer more than one):<br />
▫ Dealt with crime in another way (32.0%)<br />
▫ Incident was not important, minor offense (28.0%)<br />
▫ Offender was a close family member or friend (28.0%)<br />
▫ Believed the police could do nothing to help (20.0%)<br />
▫ Did not want to involve the police (8.0%)<br />
▫ Other (4.0%)<br />
• Afraid of losing job
Simple Assault:<br />
• 279 incidents/99 victims<br />
• Reported 26.9%; not reported 70.3%<br />
• Not reported because:<br />
▫ Incident was not important, minor offense (28.3%)<br />
▫ Dealt with crime in another way (21.2%)<br />
▫ Offender was a close family member or friend (20.2%)<br />
▫ Did not want to involve the police (13.1%)<br />
▫ Believed the police could do nothing to help (4.0%)<br />
▫ Afraid of offender (2.0%)<br />
▫ Other (11.2%)<br />
• Police were already involved, were already aware of<br />
situation<br />
• Happened at work<br />
• Don’t know
Robbery<br />
• 5 incidents/5 victims<br />
• Reported 80%, not reported 20%<br />
• Not reported because:<br />
▫ 100% incident not important, minor offense
Violent <strong>Crime</strong>: Aggravated Assault, Simple<br />
Assault, and Robbery<br />
Reported<br />
• Urban*<br />
• Associates degree<br />
• Employed<br />
• $25,000 to $44,000*<br />
• Females<br />
• 31 to 60<br />
• Married, living with<br />
partner<br />
• Ethnicity, no difference<br />
• Race, no difference<br />
Not reported<br />
• Rural*<br />
• Master’s or higher*<br />
• Not employed<br />
• Over $75,000*<br />
• Male<br />
• 18 – 30<br />
• Single*<br />
• Ethnicity, no difference<br />
• Race, no difference<br />
*Significant Difference
Lifetime Rape:<br />
• 267 incidents/132 victims<br />
• Reported 16.0%, not reported 83.4%<br />
• Not reported because:<br />
▫ Offender was a close family member or friend (23.0%)<br />
▫ Afraid of offender (21.7%)<br />
▫ Believed the police could do nothing to help (11.1%)<br />
▫ Dealt with crime in another way (7.6%)<br />
▫ Did not want to involve the police (7.2%)<br />
▫ Incident was not important, minor offense (4.3%)<br />
• Other (25.1%)
Lifetime Rape Cont.<br />
Types of “Other” responses:<br />
• Very young<br />
• Didn’t realize was rape until after<br />
• Embarrassed /ashamed<br />
• Blamed self/thought I would be in trouble<br />
• No proof/Didn’t think would be believed<br />
• Different time, did not talk about this then<br />
• Parents didn't want to report<br />
• Told it was their fault<br />
• Boyfriend so didn’t think had case<br />
• Was intoxicated<br />
• I don't know/just didn’t
Rape 2008<br />
• 4 incidents and victims<br />
• 75% reported, 25% not reported<br />
▫ Not reported because:<br />
• Afraid of offender (100%)
Sexual Assault (not including rape)<br />
• Lifetime Attempted Rape: 732 incidents; 224 victims<br />
▫ Reported 8.7%; not reported 90.8%<br />
▫ 2008 attempted rape: 12 incidents/12 victims<br />
• Reported 0%; Not reported 100%<br />
• Lifetime Sexual Assault with Object: 84 incidents/37<br />
victims<br />
▫ Reported 7.1%; not reported 92.9%<br />
▫ 2008 Sexual Assault with Object: 2 victims<br />
• Reported 0%; Not reported 100%<br />
• Lifetime Forcible Fondling: 1767 incidents/303 victims<br />
▫ Reported 2.5%, not reported 96.3%<br />
▫ 2008 Forcible Fondling: 24 incidents/13 victims<br />
• Reported 0%; Not reported 100%
Sexual Assault Cont. (not including<br />
rape)<br />
• Reasons for not reporting (could choose more than<br />
one):<br />
▫ Dealt with crime in another way (24.1%)<br />
▫ Incident was not important, minor offense (20.1%)<br />
▫ Offender was a close family member or friend (12.5%)<br />
▫ Afraid of offender (9.3%)<br />
▫ Did not want to involve the police (8.3%)<br />
▫ Believed the police could do nothing to help (7.8%)<br />
• Other (44.6%)
Lifetime Sexual Assault Cont.<br />
Types of “Other” responses:<br />
• Too young/naïve<br />
• Didn’t know what to do<br />
• No one believed<br />
• Different era /people didn’t do it back then/didn’t have option back then<br />
• Didn’t realize what happened till over /drinking<br />
• Embarrassment/didn’t want to hurt parents<br />
• Didn't know I could /didn’t know was an option<br />
• Attacker ran away/didn’t know who did it/couldn’t identify<br />
• Told parents, parents didn’t report<br />
• Out of country /in another state/police far away<br />
• Thought it was her fault<br />
• Never thought about involving the police/never occurred to him<br />
• Fear /feared getting in trouble<br />
• Blamed for it at the time it happened<br />
• Don't know why
2008 Sexual Assault (not including<br />
rape)<br />
• Reasons for not reporting (could choose more<br />
than one):<br />
▫ Incident was not important, minor offense<br />
(42.3%)<br />
▫ Offender was a close family member or friend<br />
(19.2%)<br />
▫ Dealt with crime in another way (15.4%)<br />
▫ Believed the police could do nothing to help<br />
(15.4%)<br />
▫ Afraid of offender (7.7%)<br />
▫ Did not want to involve the police (3.8%)
Sexual Assault Victim Characteristics<br />
Reported<br />
• Rural<br />
• Less than 12 th and HS<br />
grad*<br />
• Employed full/part-time*<br />
• Living with partner,<br />
separated, divorced*<br />
• Less than$75,000*<br />
• Females*<br />
• Hispanic*<br />
• 18 to 45*<br />
• Race, no difference<br />
Not reported<br />
• Urban<br />
• Some college and college<br />
degree*<br />
• Not employed, homemaker,<br />
retired*<br />
• Married, single, widowed*<br />
• $75,000 and up*<br />
• Males*<br />
• Non-Hispanic*<br />
• 46 and up*<br />
• Race, no difference<br />
*Significant Difference
Lifetime Emotional Domestic Violence<br />
• 3868 incidents/436 victims<br />
• Reported 8.7%; not reported 89.8%<br />
• Not reported because (could answer more than one):<br />
▫ Incident was not important, minor offense (23.2%)<br />
▫ Dealt with crime in another way (22.9%)<br />
▫ Afraid of offender (16.1%)<br />
▫ Believed the police couldn’t or wouldn’t do anything to<br />
help (14.9%)<br />
▫ Offender was a close family member or friend (14.9%)<br />
▫ Did not want to involve the police (13.8%)<br />
▫ Other (25.2%)
Lifetime Emotional Domestic Violence<br />
Types of “Other” responses:<br />
• Never occurred to her/thought part of being married/seemed normal<br />
• Shame/embarrassment<br />
• Police wouldn’t have done anything back then<br />
• Very young and immature/too young to know better<br />
• Trying to make things work/try to make marriage work<br />
• Thought the person would change<br />
• The abuser was policeman/would ruin career<br />
• Felt like deserved it, was her fault<br />
• Was manipulative/brainwashed by relationship<br />
• Didn't want to embarrass children<br />
• Unsure /just didn’t go<br />
• Frustration<br />
• Drunk<br />
• In the military<br />
• Fear spouse would be deported
Emotional Domestic Violence: 2008<br />
• 542 incidents/62 victims<br />
• 3.0% reported; 97.0% not reported<br />
• Reasons for not reporting (could answer more than<br />
one):<br />
▫ It was a private matter (30.9%)<br />
▫ The abuse wasn’t that bad (27.3%)<br />
▫ The police wouldn’t or couldn’t do anything to help<br />
(18.2%)<br />
▫ The abuse would get worse (14.5%)<br />
▫ It might endanger the children (5.5%)<br />
▫ The offender wouldn’t allow a report (3.6%)<br />
▫ Other (23.6%)
Emotional Domestic Violence: 2008<br />
Types of “Other” Responses:<br />
• Afraid<br />
• “Can’t quantify”<br />
• Relationship ended<br />
• Trust issues<br />
• Didn’t feel it was appropriate<br />
• Political reasons<br />
• Marital spat<br />
• Shame<br />
• Just didn’t care to
Lifetime Physical Domestic Violence<br />
• 1942 incidents/351 victims<br />
• Reported 18.3%; Not reported 81.7%<br />
• Not reported because:<br />
▫ Dealt with crime in another way (23.6%)<br />
▫ Afraid of offender (18.2%)<br />
▫ Offender was close family member or friend (13.9%)<br />
▫ Incident was not important, minor offense (12.3%)<br />
▫ Did not want to involve the police (10.0%)<br />
▫ Believed the police could do nothing to help (7.7%)<br />
• Other (21.1%)
Lifetime Physical Domestic Violence<br />
Types of “Other” responses:<br />
• Shame/embarrassment<br />
• Young/stupid<br />
• Women just didn't report back then<br />
• Felt deserved it/both at fault<br />
• Offender was in military /police officer/deputy sheriff<br />
• Hoped it would stop on its own<br />
• Didn’t realize was illegal<br />
• Didn't want to split home/lose marriage<br />
• Didn't want the abuser prosecuted<br />
• Taught to not say anything<br />
• Offender was drinking alcohol<br />
• Unsure /just didn’t/no reason
Physical Domestic Violence: 2008<br />
• 82 incidents/20 victims<br />
• 9.8% reported, 90.2% not reported<br />
• Not reported because:<br />
▫ The abuse wasn’t that bad (25.0%)<br />
▫ It was a private matter (15.0%)<br />
▫ Dealt with it in another way (10.0%)<br />
▫ The abuse would get worse (5.0%)<br />
▫ The police wouldn’t do anything (5.0%)
Domestic Violence Victim Characteristics<br />
Reported<br />
• Rural<br />
• Less than HS, HS grad,<br />
associates*<br />
• Employed full, part time*<br />
• Living with partner*<br />
• Females*<br />
• Hispanic<br />
• Race no difference<br />
• Under 45*<br />
• Under $44,000<br />
Not reported<br />
• Urban<br />
• Bachelor’s, Masters<br />
degree*<br />
• Not employed, retired*<br />
• Married*<br />
• Males*<br />
• Non-hispanic<br />
• Race no difference<br />
• Over 60*<br />
• Over $45,000<br />
*Significant Difference
Conclusions:<br />
• Reporting of crime is dependant upon the<br />
severity of the crime and characteristics of the<br />
victim.<br />
• Need to keep examining reasons why crime is<br />
not reported to have a better understanding of<br />
how and why victims utilize the criminal justice<br />
system.<br />
▫ Top two reasons given for not reporting crime:<br />
was a minor offense or the victim dealt with the<br />
situation in another way.
Thank You!<br />
• For questions concerning this research, please<br />
contact:<br />
Janeena Wing<br />
<strong>Idaho</strong> State Police<br />
Principal Research Analyst<br />
Janeena.Wing@isp.idaho.gov