Automated Industrial Load Measurement System - AU Journal
Automated Industrial Load Measurement System - AU Journal
Automated Industrial Load Measurement System - AU Journal

Create successful ePaper yourself
Turn your PDF publications into a flip-book with our unique Google optimized e-Paper software.
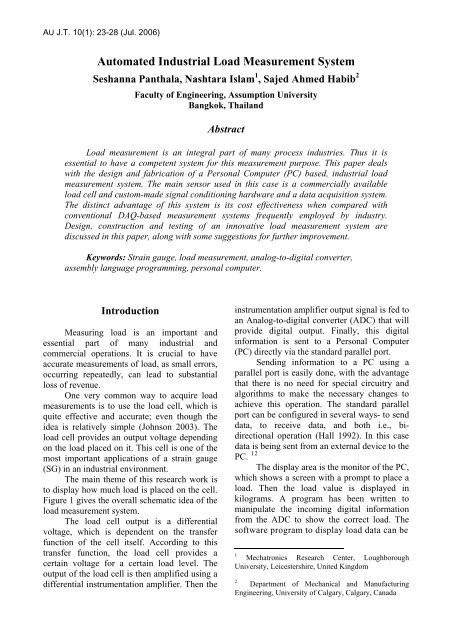
<strong>AU</strong> J.T. 10(1): 23-28 (Jul. 2006)<br />
<strong>Automated</strong> <strong>Industrial</strong> <strong>Load</strong> <strong>Measurement</strong> <strong>System</strong><br />
Seshanna Panthala, Nashtara Islam 1 , Sajed Ahmed Habib 2<br />
Faculty of Engineering, Assumption University<br />
Bangkok, Thailand<br />
Abstract<br />
<strong>Load</strong> measurement is an integral part of many process industries. Thus it is<br />
essential to have a competent system for this measurement purpose. This paper deals<br />
with the design and fabrication of a Personal Computer (PC) based, industrial load<br />
measurement system. The main sensor used in this case is a commercially available<br />
load cell and custom-made signal conditioning hardware and a data acquisition system.<br />
The distinct advantage of this system is its cost effectiveness when compared with<br />
conventional DAQ-based measurement systems frequently employed by industry.<br />
Design, construction and testing of an innovative load measurement system are<br />
discussed in this paper, along with some suggestions for further improvement.<br />
Keywords: Strain gauge, load measurement, analog-to-digital converter,<br />
assembly language programming, personal computer.<br />
Introduction<br />
Measuring load is an important and<br />
essential part of many industrial and<br />
commercial operations. It is crucial to have<br />
accurate measurements of load, as small errors,<br />
occurring repeatedly, can lead to substantial<br />
loss of revenue.<br />
One very common way to acquire load<br />
measurements is to use the load cell, which is<br />
quite effective and accurate; even though the<br />
idea is relatively simple (Johnson 2003). The<br />
load cell provides an output voltage depending<br />
on the load placed on it. This cell is one of the<br />
most important applications of a strain gauge<br />
(SG) in an industrial environment.<br />
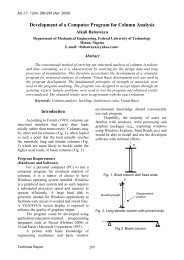
The main theme of this research work is<br />
to display how much load is placed on the cell.<br />
Figure 1 gives the overall schematic idea of the<br />
load measurement system.<br />
The load cell output is a differential<br />
voltage, which is dependent on the transfer<br />
function of the cell itself. According to this<br />
transfer function, the load cell provides a<br />
certain voltage for a certain load level. The<br />
output of the load cell is then amplified using a<br />
differential instrumentation amplifier. Then the<br />
instrumentation amplifier output signal is fed to<br />
an Analog-to-digital converter (ADC) that will<br />
provide digital output. Finally, this digital<br />
information is sent to a Personal Computer<br />
(PC) directly via the standard parallel port.<br />
Sending information to a PC using a<br />
parallel port is easily done, with the advantage<br />
that there is no need for special circuitry and<br />
algorithms to make the necessary changes to<br />
achieve this operation. The standard parallel<br />
port can be configured in several ways- to send<br />
data, to receive data, and both i.e., bidirectional<br />
operation (Hall 1992). In this case<br />
data is being sent from an external device to the<br />
PC. 1 2 The display area is the monitor of the PC,<br />
which shows a screen with a prompt to place a<br />
load. Then the load value is displayed in<br />
kilograms. A program has been written to<br />
manipulate the incoming digital information<br />
from the ADC to show the correct load. The<br />
software program to display load data can be<br />
1<br />
Mechatronics Research Center, Loughborough<br />
University, Leicestershire, United Kingdom<br />
2<br />
Department of Mechanical and Manufacturing<br />
Engineering, University of Calgary, Calgary, Canada
Fig. 1 Theoretical approach to the measurement idea<br />
written in various languages (e.g., C, C++,<br />
FORTRAN, Assembly etc.). In this case,<br />
assembly language has been chosen for its<br />
capability of having greater control over the<br />
machine, i.e., the PC (Abel 2001) and for the<br />
familiarity of the authors with this language.<br />
Hardware<br />
The main hardware components of the<br />
system are discussed in considerable detail in<br />
this section.<br />
Strain Gauge (SG)<br />
As discussed in the introductory part of<br />
this paper, load cell is the main sensor used for<br />
the measurement system. The load cell is<br />
primarily made up of strain gauges.<br />
V ref<br />
R<br />
R<br />
R D<br />
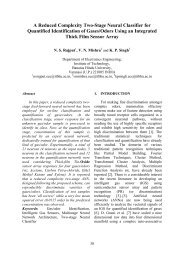
Fig. 2. Construction of a strain gauge (Johnson<br />
2003)<br />
Construction of strain gauge is shown in<br />
Fig.2. It basically consists of resistive elements<br />
in a Wheatstone bridge configuration.<br />
R<br />
The nominal values of the resistances are<br />
equal under no-load conditions. Thus the<br />
voltage output from the circuit is zero in this<br />
setup. The resistance of R D changes in a linear<br />
manner with the force acting on it.<br />
The sensitivity of this bridge to strain can<br />
be found by considering the equation for bridge<br />
offset voltage. Suppose R 1 = R 2 = R D = R,<br />
which is the nominal (unstrained) gauge<br />
resistance. Then the active strain gauge<br />
resistance will be given by (Johnson 2003):<br />
R A = R (1+ΔR/R)<br />
And the bridge off-null voltage will be<br />
given by:<br />
ΔV = V S [R D /(R D +R 1 ) – R A /(R A +R 2 )]<br />
Finally, the expression of output voltage<br />
is given in terms of strain as below:<br />
ΔV = - (V S /4) GF (Δl/l)<br />
This voltage is the output, which is fed to<br />
an instrumentation amplifier for signal<br />
amplification.<br />
Instrumentation Operational Amplifier<br />
There are many instances in<br />
measurement and control systems in which the<br />
difference between two voltages needs to be<br />
24
conditioned. A good example is the<br />
Wheatstone bridge where the offset voltage ΔV<br />
= V a – V b is the quantity of interest.<br />
Since the load cell is working with the<br />
same principle as the Wheatstone bridge, the<br />
ideal approach was to feed the load cell voltage<br />
output to a differential instrumentation<br />
amplifier.<br />
An ideal differential amplifier will<br />
provide output voltage with respect to ground<br />
that is some gain times the difference between<br />
two input voltages (Boylestad and Nashelsky<br />
1999).<br />
V out = G (V a –V b )<br />
where, G is the differential gain and both V a<br />
and V b are voltages with respect to ground.<br />
Such an amplifier provides useful operation in<br />
control and measurement.<br />
There are a number of op-amp circuits<br />
for a differential amplifier. The circuit uses two<br />
pairs of matched resistors. But if the resistors<br />
are not well matched, the Common Mode<br />
Rejection (CMR) will be poor. Normally the<br />
input impedance for such circuits is not very<br />
high and it is not the same for two inputs.<br />
For this reason, voltage followers are<br />
often used on the input to provide high input<br />
impedance. Such a device is called a<br />
differential instrumentation amplifier. It is just<br />
a differential amplifier with high input<br />
impedance and low output impedance. Many<br />
IC manufacturers package instrumentation<br />
amplifiers in a single IC.<br />
Instrumentation amplifier IC INA125P<br />
from Burr Brown was used for this purpose, as<br />
it offers all the aforementioned advantages.<br />
V X = V ref (a 1 2 -1 + a 2 2 -2 + a 3 2 -3 + …….+ a n 2 -n )<br />
where, V ref is the ADC reference voltage, V X is<br />
the input analog voltage and n is the number of<br />
bits.<br />
In this case, the 8-bit ADC 0804 IC has<br />
been used. This 8 bit digital information will be<br />
sent to a PC for conversion to weight or a load<br />
value using the appropriate software.<br />
It is noteworthy that there is an inherent<br />
uncertainly in the input voltage producing a<br />
given ADC output, and this uncertainty is<br />
given by:<br />
ΔV = V ref 2 -n<br />
Therefore, it is very important to take this<br />
into account when using an ADC in industrial<br />
instrumentation and control systems, and in<br />
defense sector applications, where 100%<br />
accuracy is required.<br />
PC Parallel Port Interface<br />
The parallel port is the most commonly<br />
used port for interfacing applications involving<br />
data transfer to and from the PC (Hall 1992).<br />
This port allows the input of up to 9 bits or the<br />
output of 12 bits at any given time, thus<br />
requiring minimal external circuitry to<br />
implement many simpler tasks.<br />
Analog-to-digital Converter (ADC)<br />
An analog to digital converter or ADC is<br />
the next stage after the instrumentation<br />
amplifier. An ADC takes analog voltage as an<br />
input and provides a digital output. This digital<br />
information is in binary format consisting of 0s<br />
and 1s only. The ADC finds a fractional binary<br />
number that gives the closest approximation to<br />
the fraction formed by the input voltage and<br />
reference. The following is the conversion<br />
equation (Boylestad and Nashelsky 1999):<br />
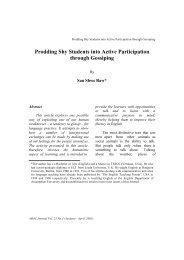
Fig. 3. LPT port connection diagram<br />
The port is composed of 4 control lines, 5<br />
status lines and 8 data lines. It is on the back of<br />
a PC as a D-Type 25 Pin female connector.<br />
25
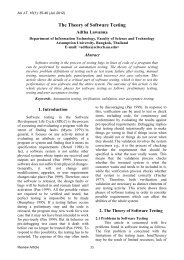
The complete hardware interface diagram<br />
is shown above in figure 5. A 74LS244 line<br />
driver IC has been additionally used between<br />
the LPT port of the PC and the ADC. This<br />
setup has been implemented to electronically<br />
isolate the two devices from any disturbances<br />
in the connection (e.g., short circuit).<br />
Although() not a necessity, it is always a good<br />
practice to include such a buffer in the system.<br />
Fig. 4. Complete hardware interface diagram<br />
Software<br />
The main tasks of the software were to –<br />
1. Drive the parallel port for obtaining data<br />
from the ADC.<br />
2. Convert the digital data to an analog form<br />
to provide the measurement value.<br />
3. Provide an user interface for running the<br />
program and manipulating the<br />
measurement information.<br />
To accomplish these tasks, an algorithm<br />
was devised according to the flow chart shown<br />
in figure 5.<br />
Each process within the measurement<br />
setup (e.g., convert ASCII to Decimal)<br />
comprises a complex algorithm. Due to space<br />
constraints, they are not discussed in detail in<br />
this paper.<br />
Fig. 5. Flow chart for load measurement system<br />
26
Fig 6<br />
Screen shot of the user interface<br />
The user interface of the measurement<br />
system looks like the one in figure 6. A few<br />
options have been provided for the user of the<br />
system.<br />
The first option can be selected if the<br />
user wants to perform only a single<br />
measurement using the system.<br />
Option 2 can be used to carry out a<br />
succession of measurements with the help of<br />
the system. The cumulative measurement value<br />
will be displayed in the console when the user<br />
decides to end the measurement session.<br />
The third option allows setting a predetermined<br />
limit for the measurements to be<br />
carried out. If the user decides to measure up to<br />
a certain weight (e.g., 1,000 kg), then the<br />
program will warn the user, both with the help<br />
of a text message, as well as an alarm sound<br />
once that limit has been reached. This function<br />
is extremely useful in packaging industries,<br />
where each bag or sack has to be filled up to a<br />
certain weight.<br />
Discussion<br />
A common method of acquiring load<br />
measurement data from the load cell is using a<br />
microcontroller. This setup ensures that the<br />
system footprint is small and portable. The<br />
acquired data is usually displayed in an LCD<br />
display.<br />
While this is a fairly straightforward way<br />
of achieving the goal of load measurement, it is<br />
not free of certain drawbacks. Firstly, the<br />
measured data cannot be stored in a convenient<br />
location (e.g., a hard drive) for future referral.<br />
Secondly, the system can hardly be made an<br />
interactive one, as demonstrated by the system<br />
in this paper. And, finally, a microcontrollerbased<br />
system cannot be easily reconfigured by<br />
the user.<br />
As mentioned earlier, various DAQ<br />
products are being used in industries for<br />
measurement purposes. The hardware can be<br />
connected via PCI slots or the USB port of a<br />
PC. The corresponding software is supplied<br />
with the product or can be downloaded from<br />
the internet. They are excellent in terms of ease<br />
of use and robustness. However, cost analysis<br />
(National Instruments 2006) shows that these<br />
attributes come at a very high cost and can be<br />
beyond the reach of small scale businesses.<br />
This proposed measurement scheme can<br />
be implemented in almost all industrial PCs<br />
without the need for expensive hardware.<br />
Although it doesn’t exactly offer the portability<br />
of a microcontroller-based system, it can<br />
certainly overcome all the aforesaid<br />
constraints.<br />
27
Further Work<br />
A complete design of an automated load<br />
measurement setup has been proposed,<br />
describing both hardware and software.<br />
However, it is possible to enhance the system<br />
further. The following suggestions are made for<br />
the improvement of the system–<br />
1. A wireless method can be interfaced with<br />
the measurement setup to realize remote<br />
measurement schemes. Readily available<br />
Bluetooth or ZigBee transceiver operating<br />
in the ISM band can be used for this<br />
purpose (Egan 2005).<br />
2. Analog-to-digital converters with higher<br />
resolution (e.g., 16 bit devices) can be used<br />
to increase the accuracy of the<br />
measurement system.<br />
3. A Graphical User Interface (GUI) can be<br />
developed to further enhance user<br />
experience.<br />
Conclusion<br />
The research work discussed in this paper<br />
has contributed to the development of a PCbased<br />
load measurement system. A software<br />
user interface along with the signal<br />
conditioning and data acquisition hardware has<br />
been fabricated. The system has been<br />
successfully trialed to obtain various load<br />
measurements. A few suggestions have also<br />
been drawn up for the improvement of the<br />
system.<br />
As the system is easily customizable, its<br />
seamless integration is always possible in a<br />
highly automated industry. Thus, there is a<br />
great potential for this system to be used in<br />
numerous industries, where load measurement<br />
forms a part of the process line.<br />
References<br />
Abel, P. 2001. IBM® PC Assembly Language<br />
and Programming. 5 th ed. Prentice-Hall,<br />
Englewood Cliff, NJ, USA.<br />
Boylestad, R.L., Nashelsky, L.. 1999.<br />
Electronic Devices and Circuit Theory. 7 th<br />
ed. Prentice-Hall, Englewood Cliff, NJ,<br />
USA.<br />
Egan, D. 2005. The Emergence of ZigBee. IEE<br />
Comp. Control Engin. Mag.. April - May<br />
2005, pp: 14 - 19.<br />
Hall, D.V. 1992. Microprocessors and<br />
Interfacing - Programming and Hardware.<br />
2 nd ed.. Macmillan/McGraw-Hill,<br />
Singapore:.<br />
Johnson, C.D. 2003. Process Control<br />
Instrumentation Technology. 7 th edi.<br />
Prentice-Hall, Englewood Cliff, NJ, USA.<br />
National Instruments, 2006. UK Price List.<br />
http://www.ni.com/pdf/branches/price_list_<br />
uk.pdf<br />
28