GASB 2001 - Joseph Badger Local Schools
GASB 2001 - Joseph Badger Local Schools
GASB 2001 - Joseph Badger Local Schools

You also want an ePaper? Increase the reach of your titles
YUMPU automatically turns print PDFs into web optimized ePapers that Google loves.
Dedicated to those who are dedicated to<br />
the children of Our District
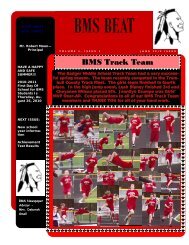
This section will introduce you to a new/old<br />
business located here in Hartford Township. The<br />
Blaney Family has purchased and renovated the<br />
Sharon Speedway that has been a proud part of<br />
our past and we know some great races are in<br />
store for the future
<strong>Joseph</strong> <strong>Badger</strong> <strong>Local</strong><br />
School District<br />
Kinsman, Ohio<br />
Comprehensive Annual Financial Report<br />
For the Fiscal Year Ended June 30, <strong>2001</strong><br />
Issued by:<br />
Treasurer’s Office<br />
William A. Johnson<br />
- i -
<strong>Joseph</strong> <strong>Badger</strong> <strong>Local</strong> School District<br />
Comprehensive Annual Financial Report<br />
For the Fiscal Year Ended June 30, <strong>2001</strong><br />
Table of Contents<br />
I. Introductory Section Page<br />
Title Page .......................................................................................................................................... i<br />
Table of Contents.............................................................................................................................ii<br />
Letter of Transmittal ........................................................................................................................ v<br />
List of Principal Officials...............................................................................................................xii<br />
Organizational Chart.....................................................................................................................xiii<br />
GFOA Certificate of Achievement ............................................................................................... xiv<br />
II.<br />
Financial Section<br />
Independent Accountant’s Report.................................................................................................... 1<br />
Management’s Discussion and Analysis.......................................................................................... 3<br />
Basic Financial Statements:<br />
Government-wide Financial Statements:<br />
Statement of Net Assets............................................................................................. 13<br />
Statement of Activities............................................................................................... 14<br />
Fund Financial Statements:<br />
Balance Sheet-Governmental Funds........................................................................... 16<br />
Statement of Revenues, Expenditures and Changes in Fund<br />
Balances-Governmental Funds ................................................................................. 18<br />
Statement of Revenues, Expenditures and Changes in Fund Balance-<br />
Budget (Non-GAAP Basis) and Actual:<br />
General Fund......................................................................................................... 20<br />
Statement of Net Assets-Enterprise Fund ................................................................... 22<br />
Statement of Revenues, Expenses and Changes in Fund<br />
Net Assets- Enterprise Fund ..................................................................................... 23<br />
Statement of Cash Flows – Enterprise Fund............................................................... 24<br />
Statement of Fiduciary Net Assets- Fiduciary Funds ................................................. 26<br />
Statement of Changes in Fiduciary Net Assets – Fiduciary Fund .............................. 27<br />
Notes to the Basic Financial Statements.......................................................................... 28<br />
- ii -
<strong>Joseph</strong> <strong>Badger</strong> <strong>Local</strong> School District<br />
Comprehensive Annual Financial Report<br />
For the Fiscal Year Ended June 30, <strong>2001</strong><br />
Table of Contents (continued)<br />
Combining Statements and Individual Fund Schedules:<br />
Combining Statements – Nonmajor Funds:<br />
Fund Descriptions................................................................................................... 54<br />
Combining Balance Sheet – Nonmajor Governmental Funds................................ 56<br />
Combining Statement of Revenues, Expenditures and<br />
Changes in Fund Balances – Nonmajor Governmental Funds.............................. 57<br />
Combining Balance Sheet – Nonmajor Special Revenue Funds............................ 58<br />
Combining Statement of Revenues, Expenditures and Changes in<br />
Fund Balances – Nonmajor Special Revenue Funds............................................ 61<br />
Combining Balance Sheet – Nonmajor Capital Projects Funds ............................. 64<br />
Combining Statement of Revenues, Expenditures and Changes in<br />
Fund Balances – Nonmajor Capital Projects Funds ............................................. 65<br />
Individual Fund Schedules of Revenues, Expenditures/Expenses and Changes in<br />
Fund Balance – Budget (Non-GAAP Basis) and Actual:<br />
General Fund .......................................................................................................... 66<br />
Principal’s Fund ..................................................................................................... 70<br />
Professional Development Fund............................................................................. 71<br />
Auxiliary Services Fund......................................................................................... 72<br />
Educational Management Information Systems Fund............................................ 73<br />
District Managed Student Activity Fund................................................................ 74<br />
Disadvantaged Pupil Fund...................................................................................... 75<br />
School Net Professional Development Fund.......................................................... 76<br />
Summer Intervention Fund..................................................................................... 77<br />
Safe <strong>Schools</strong> Fund.................................................................................................. 78<br />
Title VIB Fund ....................................................................................................... 79<br />
Title I Fund............................................................................................................. 80<br />
Title VI Fund.......................................................................................................... 81<br />
Title VIR Fund ....................................................................................................... 82<br />
Drug Free Fund ...................................................................................................... 83<br />
Eisenhower Fund.................................................................................................... 84<br />
Debt Service Fund .................................................................................................. 85<br />
Permanent Improvement Fund ............................................................................... 86<br />
School Net Fund..................................................................................................... 87<br />
Tech Equity Fund ................................................................................................... 88<br />
Food Service Fund.................................................................................................. 89<br />
Scholarship Trust Fund .......................................................................................... 90<br />
- iii -
<strong>Joseph</strong> <strong>Badger</strong> <strong>Local</strong> School District<br />
Comprehensive Annual Financial Report<br />
For the Fiscal Year Ended June 30, <strong>2001</strong><br />
Table of Contents (continued)<br />
III.<br />
Statistical Section<br />
General Governmental Revenues by Source and Expenses/Expenditures<br />
by Function--Last Ten Fiscal Years.............................................................................................S2<br />
Property Tax Levies and Collections--Last Seven Calendar Years ...............................................S4<br />
Assessed and Estimated Actual Value of Taxable<br />
Property--Last Ten Calendar Years ..............................................................................................S5<br />
Property Tax Rates--Direct and Overlapping<br />
Governments--Last Ten Calendar Years.......................................................................................S6<br />
Ratio of Net General Obligation Bonded Debt to Assessed Value<br />
and Net Bonded Debt Per Capita--Last Ten Years .......................................................................S7<br />
Computation of Legal Debt Margin...............................................................................................S8<br />
Computation of Direct and Overlapping<br />
General Obligation Bonded Debt..................................................................................................S9<br />
Ratio of Annual Debt Service Expenditures for General Obligation<br />
Bonded Debt to Total General Governmental Expenditures--Last Ten Fiscal Years.................S10<br />
Demographic Statistics--Last Ten Years .....................................................................................S11<br />
Property Value and Financial Institution Deposits--Last TenYears ............................................S12<br />
Principal Taxpayers:<br />
Real Estate Tax ...............................................................................................................S13<br />
Tangible Personal Property Tax .....................................................................................S14<br />
Public Utilities Tax .........................................................................................................S15<br />
Per Pupil Cost--Last Ten Fiscal Years.........................................................................................S16<br />
Teacher Education and Experience..............................................................................................S17<br />
- iv -
December 20, <strong>2001</strong><br />
Board of Education Members<br />
<strong>Joseph</strong> <strong>Badger</strong> <strong>Local</strong> School District<br />
We are pleased to submit to you the second Comprehensive Annual Financial Report (CAFR) of the <strong>Joseph</strong><br />
<strong>Badger</strong> <strong>Local</strong> School District. This report discloses information for the fiscal year ended June 30, <strong>2001</strong>. This<br />
CAFR, which includes an opinion from the Auditor of the State of Ohio, conforms to generally accepted<br />
accounting principles as applicable to governmental entities. Responsibility for the accuracy of the data<br />
presented and the completeness and fairness of the presentation, including all disclosures, rests with the<br />
School District. To the best of our knowledge and belief, the enclosed data are accurate in all material respects<br />
and are reported in a manner designed to present fairly the financial position and results of operations of the<br />
School District. This report will provide the taxpayers of the <strong>Joseph</strong> <strong>Badger</strong> <strong>Local</strong> School District with<br />
comprehensive financial data in a format that will enable them to gain an understanding of the School<br />
District's financial affairs. Copies will be made available to the Trumbull County Public Library, major<br />
taxpayers, financial rating services and other interested parties.<br />
The comprehensive annual financial report is presented in three sections as follows:<br />
1. The Introductory Section, which contains a Table of Contents, Letter of Transmittal, List of Principal<br />
Officials, an Organizational Chart of the School District and a GFOA Certificate of Achievement.<br />
2. The Financial Section which begins with the Report of Independent Accountants, and includes<br />
Management’s Discussion and Analysis, the Basic Financial Statements and Notes that provide an<br />
overview of the School District's financial position and operating results, the Combining Statements<br />
for nonmajor funds and other schedules that provide detailed information relative to the Basic<br />
Financial Statements.<br />
3. The Statistical Section which presents social and economic data, financial trends and the fiscal<br />
capacity of the <strong>Joseph</strong> <strong>Badger</strong> <strong>Local</strong> School District.<br />
-v-
School District Organization<br />
The <strong>Joseph</strong> <strong>Badger</strong> <strong>Local</strong> School District is located in the northeast quadrant of Trumbull County and is<br />
one of 612 school districts in the State of Ohio. The District’s territory includes the townships of<br />
Gustavus, Hartford, Kinsman and Vernon.<br />
The School District came into being as a result of a consolidation of the four K-12 township schools on<br />
January 2, 1960. Subsequent to the consolidation, enrollment increased and with it the need for new<br />
facilities became evident. An addition was made to the 1936 Kinsman Building to house the overflow.<br />
Since that time, enrollment has declined steadily. There are still four “very old” township schools in the<br />
District; one high school, one middle school and two elementary schools. Recently our facilities were<br />
evaluated by the State of Ohio. We have discovered that we have the 5 th and 9 th worst buildings for safety<br />
in the entire State, however, Ohio has still not funded our district’s re-building plans.<br />
The <strong>2001</strong> fiscal year student count was 1,191. That represented an increase of forty-three students over<br />
the fiscal year 2000 enrollment. The average class size for fiscal year <strong>2001</strong> was twenty-five students, and<br />
the pupil/teacher ratio was 16.1 to 1. The School District has one hundred twenty-seven employees.<br />
Statutorily, the School District operates under the standards prescribed by the Ohio State Board of<br />
Education as provided in division (D) of Section 3301.07 and Section 119.01 of the Ohio Revised Code, to<br />
provide education services prescribed by State and Federal agencies.<br />
Reporting Entity<br />
The <strong>Joseph</strong> <strong>Badger</strong> <strong>Local</strong> School District has reviewed its operating entity definition in order to insure<br />
conformance with the Governmental Accounting Standards Board Statement No. 14, "The Financial<br />
Reporting Entity." In evaluating how to define the School District for financial reporting purposes,<br />
management has considered all agencies, departments and organizations making up the <strong>Joseph</strong> <strong>Badger</strong><br />
<strong>Local</strong> School District (the primary government) and its potential component units.<br />
The Trumbull Career and Technical Center, the Northeast Ohio Management Information Network, the<br />
Northeast Ohio Instructional Media Center, the Trumbull Student Assistance Consortium, the Northeast<br />
Ohio Special Education Regional Resource Center and the Region 12 Professional Development Center<br />
are jointly governed organizations. The School District participates in the Ohio School Boards<br />
Association Worker’s Compensation Group Rating Program and the Trumbull County <strong>Schools</strong> Employee<br />
Insurance Benefits Consortium, which are public entity risk pools. The Kinsman Public Library is a<br />
related organization.<br />
A complete discussion of the School District's reporting entity is provided in Note 1 to the basic financial<br />
statements.<br />
Economic Condition and Outlook<br />
Commercial growth within the School District has been very slow since consolidation, however, since<br />
January of 1997, Class II valuation has increased 24.4 percent. Total assessed value, based primarily on<br />
agricultural values and new single-family residential construction has increased approximately thirty-nine<br />
percent in the past five years while student enrollment has remained almost level. The large increases<br />
were due mainly to re-valuation of the District’s properties. The funding structure of public education in<br />
Ohio as structured by the State legislature is such that school districts receive very little revenue growth as<br />
a result of inflationary increases in their tax base. As a result, districts throughout Ohio must seek local<br />
funds by placing levies on the ballot to receive significant revenue growth. The School District passed<br />
five-year renewals on each of its two emergency operating levies on the November 4, 1997 and November<br />
3, 1998 ballots. It is projected that the School District will return to the ballot when these levies are due to<br />
expire.<br />
-vi-
Major Initiatives<br />
SchoolNet<br />
The statewide SchoolNet initiative helped <strong>Joseph</strong> <strong>Badger</strong> achieve its technology goals. SchoolNet funds<br />
provided the wiring infrastructure within each building. Each office, media center, and classroom in the<br />
<strong>Joseph</strong> <strong>Badger</strong> School District is wired and has the capability to reach the Internet and thus the outside<br />
world. T-1 lines have been installed to all District buildings to handle the increased volume of traffic.<br />
Technology Training<br />
Teacher training is a very important component of successful utilization of technology and Internet usage.<br />
Seventy-nine percent of our seventy-four teachers have participated in at least a four-day technology inservice.<br />
Seventy-one percent of the staff has been Novice certified and there are currently six teachers who<br />
have obtained Practitioner level as certified by the Ohio Department of Education’s SchoolNet office.<br />
<strong>Joseph</strong> <strong>Badger</strong>’s technology mentors have been trained as trainers and can conduct individual instructional<br />
sessions. As we enter the 2000-<strong>2001</strong> school year, there are fifty-one certificates awarded for information<br />
skills, fifty-one for productivity tools, seven for multimedia/hypermedia and seven for networking. Staff<br />
training leading to novice certification will be offered to our five new teachers this year and training<br />
leading to practitioner certification will be available to anyone interested. Providing the opportunity for<br />
extensive technology training has always been a high concern of the School District. This is evidenced by<br />
its inclusion in our previous technology plans as well as the School District’s continuous improvement<br />
plan.<br />
InfoOhio<br />
All four <strong>Joseph</strong> <strong>Badger</strong> buildings are now active participants in the InfoOhio Media Network. In fact,<br />
<strong>Joseph</strong> <strong>Badger</strong> was one of the original seven districts to apply for and receive a grant to bring the District’s<br />
libraries on line. <strong>Joseph</strong> <strong>Badger</strong> was the second of those districts to utilize InfoOhio through the<br />
NorthEast Ohio Information Management Network. The use of this network has helped our media centers<br />
become modern information resource centers. InfoOhio, a partner in Ohio’s library network, ensures the<br />
free delivery, quality, format, and equality of information for learners and educators by embracing<br />
appropriate, emerging technologies used in school, home and community. InfoOhio’s recent initiatives<br />
have been to provide electronic resources for all Ohio K-12 schools. Students can now access information<br />
from specific databases, using computers connected to the Internet, from our school library media centers<br />
and classrooms.<br />
Curriculum and Instruction<br />
While the curriculum remained unchanged during the past year, much was accomplished concerning the<br />
delivery of services to the District’s students. The 2000-<strong>2001</strong> school year saw the continued refinement of<br />
the role of the teaching assistants, a new position created to assist teachers in a variety of aspects. They<br />
continued to relieve the classroom teachers of some of their supervisory duties while working directly with<br />
at-risk children in the classroom as well as pulling them out to meet with them in small groups. This<br />
remediation should provide a long term positive impact on proficiency scores.<br />
-vii-
Last year saw the addition of librarian/media specialists in our two elementary schools. These positions<br />
provided, for the first time in anyone’s memory, a paid person to oversee the elementary libraries and<br />
computer labs. These individuals will also utilize these facilities to provide additional remediation to<br />
selected students. While it is possible for them to work with Title I and Special Education eligible<br />
students, their primary contact will be with at-risk students. The positions originated through the<br />
Continuous Improvement Process and were a part of the State Required “Continuous Improvement Plan”.<br />
The further refinement of the elementary guidance counselor position and the additional classroom<br />
teaching position funded through Title VI-R that were added two years ago, also highlighted the 2000-<br />
<strong>2001</strong> school year. These positions were created for providing better services to our younger children.<br />
District-wide nursing services to the District’s four buildings were increased during the year. This<br />
position was eliminated during the early part of the last decade when the District was having financial<br />
problems created by multiple levy failures.<br />
Special Education<br />
The addition of a second special education teacher at <strong>Badger</strong> High School provided additional instruction for<br />
those identified in this area, thus reducing the caseload on the other instructor. The overall quality of<br />
instruction improved through this refinement.<br />
Proficiency Testing<br />
The Ohio Department of Education again distributed the Ohio Report Cards last spring to the home of every<br />
student. Of the twenty-seven standards <strong>Joseph</strong> <strong>Badger</strong> met eighteen during the 1999-2000 school year.<br />
<strong>Joseph</strong> <strong>Badger</strong> met or exceeded seventeen of the State standards during the 2000-<strong>2001</strong> school year. While the<br />
number decreased slightly, the passage rate showed continuous improvement. The missed standards were<br />
concentrated in sixth grade and math. The ninth and twelfth graders met all standards. It is obvious that the<br />
longer a student attends our District, the better their performance on the proficiency test. The District also<br />
met the attendance standard of ninety-three percent.<br />
Summer School<br />
The <strong>Joseph</strong> <strong>Badger</strong> School District held summer school classes for the second time during August 2000. In<br />
accordance with the Ohio Revised Code there were classes held for students entering grades three, four, and<br />
six. The classes consisted of thirty hours over a two-week period. Attendance was disappointing.<br />
Financial Information<br />
Internal Accounting and Budgetary Control In developing the School District’s accounting system much<br />
consideration was given to the adequacy of internal accounting controls. Internal accounting controls are<br />
designed to provide reasonable, but not absolute assurance regarding the safeguarding of assets against loss<br />
from unauthorized use or disposition and the reliability of financial records for preparing financial statements<br />
and maintaining accountability for assets. The concept of reasonable assurance is based on the assumption<br />
that the cost of internal accounting controls should not exceed the benefits expected to be derived from their<br />
implementation.<br />
The School District utilizes a fully automated accounting system as well as an automated system of control<br />
for fixed assets and payroll. These systems, coupled with the manual auditing of each voucher prior to<br />
payment, ensure that the financial information generated is both accurate and reliable.<br />
-viii-
At the beginning of each fiscal year, the Board of Education adopts either a temporary appropriation measure<br />
or a permanent appropriation measure for that fiscal year. If a temporary appropriation measure is first<br />
adopted, the permanent appropriation measure must be adopted upon receipt from the County Auditor of an<br />
amended certificate of estimated resources based on final assessed values and tax rates, which is usually<br />
within the first three months of the fiscal year.<br />
Annual appropriations may not exceed the County Budget Commission's official estimate of resources. The<br />
County Auditor must certify that the Board of Education's appropriation measures, including any supplements<br />
or amendments, do not exceed the amount set forth in the latest of those official estimates.<br />
All disbursements and transfers of cash between funds require appropriation authority from the<br />
Board. Budgets are controlled at the object account level within a function and fund. All purchase order<br />
requests must be approved by either the Superintendent or his designees and certified by the Treasurer;<br />
necessary funds are then encumbered and purchase orders released to vendors. Those requests that exceed the<br />
available appropriations are rejected until additional appropriations are secured.<br />
The accounting system used by the School District provides interim financial reports which detail year-to-date<br />
expenditures and encumbrances versus the original appropriation plus any additional appropriations made to<br />
date.<br />
If requested by the Superintendent, every school principal is furnished reports showing the status of the<br />
budget accounts for which they are responsible. In addition, an on line inquiry system is currently under<br />
development at each school building. As an additional safeguard, a blanket bond covers all employees who<br />
handle money, and a separate, higher limit bond covers the Treasurer of the Board of Education.<br />
The basis of accounting and the various funds and account groups utilized by the <strong>Joseph</strong> <strong>Badger</strong> <strong>Local</strong><br />
<strong>Schools</strong> are fully described in Note 2 of the financial statements. Additional information on the School<br />
District's budgetary accounting can also be found in Note 2.<br />
Financial Condition This is the second year the School District has prepared financial statements following<br />
<strong>GASB</strong> Statement 34, “Basic Financial Statements-and Management’s Discussion and Analysis-for State and<br />
<strong>Local</strong> Governments.” <strong>GASB</strong> 34 creates new basic financial statements for reporting on the School District’s<br />
financial activities as follows:<br />
Government-wide financial statements These statements are prepared on an accrual basis of<br />
accounting which is similar to the basis of accounting followed by many businesses. The government<br />
-wide statements distinguish between those activities of the School District that are governmental and<br />
those that are considered business-type activities.<br />
Fund financial statements These statements present information for individual major funds rather<br />
than by fund type. Nonmajor funds are presented in total in one column. Governmental funds use the<br />
modified accrual basis of accounting and include a reconciliation to the governmental activities<br />
accrual information presented in the government-wide financial statements. Proprietary and fiduciary<br />
funds use the accrual basis of accounting.<br />
Statements of budgetary comparisons These statements present comparisons of actual information to<br />
the legally adopted budget. The budgetary basis as provided by law is based upon accounting for<br />
certain transactions on a basis of cash receipts, disbursements and encumbrances.<br />
As part of this new reporting model, management is responsible for preparing a Management Discussion and<br />
Analysis of the School District. This discussion follows this letter of transmittal, providing an assessment of<br />
the School District finances for <strong>2001</strong> and facts that will influence future finances.<br />
-ix-
Financial Highlights - Fiduciary Fund. The trust fund carried on the financial records of the School District<br />
is a private purpose trust fund that has assets totaling $15,927. Information regarding the major governmental<br />
and proprietary funds is presented in Management’s Discussion and Analysis.<br />
Cash Management<br />
The Board has implemented an aggressive cash management program by expediting the receipt of revenues<br />
and prudently depositing and investing available cash balances. The cash management program is beneficial<br />
because of access to daily balances, which enables the Board to maintain minimum balance accounts and<br />
invest to the maximum extent. The total amount of interest earned was $160,291 for the year ended June 30,<br />
<strong>2001</strong>, $157,845 being credited to the general fund.<br />
Protection of the School District's deposits is provided by the federal deposit insurance corporation as well as<br />
by qualified securities pledged by the institution holding the assets. By law, financial institutions may<br />
establish a collateral pool to cover all public deposits. The face value of the pooled collateral must equal at<br />
least 110 percent of public funds deposited. Trustees including the Federal Reserve Bank and designated third<br />
party trustees of the financial institutions hold collateral.<br />
During fiscal year <strong>2001</strong>, investments were limited to STAR Ohio, an investment pool managed by the State<br />
Treasurer, and Certificates of Deposit.<br />
Risk Management<br />
The School District participates in a shared risk pool for hospital/medical benefits for its employees. The<br />
Trumbull County School Employee Insurance Benefits Consortium (the Consortium)“pool” is comprised of<br />
sixteen Trumbull County school districts. All risk is transferred to the Consortium and claims are paid<br />
through a common fund controlled by the Consortium. The Consortium purchases stop-loss coverage.<br />
The School District provides no deductible liability coverage for all employees in the amounts of $1,000,000<br />
for each occurrence and $5,000,000 in the aggregate. The District contracts annually for property and<br />
casualty insurance with a $500 deductible and a 90 percent coinsurance. Fleet insurance is also contracted<br />
annually which provides liability coverage of $500,000 each person and a $1,000,000 each occurrence.<br />
Collision coverage is at actual cash value less $250 deductible. Periodic RFPs ensure that the School District<br />
will receive favorable rates and appropriate coverage.<br />
Independent Audit<br />
State statutes require the School District to be subjected to an annual examination by an independent auditor.<br />
Independent auditor Jim Petro, Auditor of State, was selected to render an opinion on the School District's<br />
financial statements as of and for the year ended June 30, <strong>2001</strong>. An annual audit serves to maintain and<br />
strengthen the School District’s accounting and budgetary controls.<br />
Pursuant to statute, the State prescribed a uniform accounting system to standardize accounting classification<br />
and financial reporting for all governments in Ohio. The School District adopted and has been in<br />
conformance with that system beginning with its financial report for the 1979 year.<br />
Awards<br />
GFOA Certificate of Achievement The Government Finance Officers Association of the United States and<br />
Canada (GFOA) awarded a Certificate of Achievement for Excellence in Financial Reporting to <strong>Joseph</strong><br />
<strong>Badger</strong> <strong>Local</strong> School District for its comprehensive annual financial report for the fiscal year ended June 30,<br />
2000. The Certificate of Achievement is the highest form of recognition in the area of governmental financial<br />
reporting.<br />
-x-
In order to be awarded a Certificate of Achievement, a government unit must publish an easily readable and<br />
efficiently organized Comprehensive Annual Financial Report, whose contents conform to program standards.<br />
Such a report must satisfy both generally accepted accounting principles and applicable legal requirements.<br />
A Certificate of Achievement is valid for a period of one year only. We believe our current report continues<br />
to conform to the Certificate of Achievement program requirements, and we are submitting it to GFOA.<br />
Acknowledgments<br />
The publication of this report is a significant step toward making the <strong>Joseph</strong> <strong>Badger</strong> <strong>Local</strong> School District's<br />
financial reporting more professional. The goal is to continuously improve our financial accountability to our<br />
citizens.<br />
The preparation of this report would not have been possible without the assistance and support of the staff of<br />
the Treasurer's office, various administrators and staff members of the School District. Assistance from the<br />
County Auditor's staff and outside agencies made possible the fair presentation of statistical data.<br />
Special appreciation is expressed to the <strong>Local</strong> Government Services Division of State Auditor Jim Petro’s<br />
office for assistance in planning, designing and reviewing this financial report.<br />
Finally, sincere appreciation is extended to the Board of Education for their support for this project.<br />
Respectfully submitted,<br />
William A. Johnson, Treasurer<br />
Richard A. Pachuk, Superintendent<br />
-xi-
<strong>Joseph</strong> <strong>Badger</strong> <strong>Local</strong> School District<br />
Principal Officials<br />
June 30, <strong>2001</strong><br />
Board of Education<br />
Mr. John Stanhope................................................................... President<br />
Mrs. Kimberly Bonar .............................................................. Vice-President<br />
Mr. David Hardman ................................................................ Member<br />
Mr. <strong>Joseph</strong> Logan ................................................................... Member<br />
Mr. Joe Toth ............................................................................ Member<br />
Administration<br />
Mr. William Johnson .............................................................. Treasurer<br />
Mr. Richard Pachuk ................................................................ Superintendent<br />
Mr. Ronald Gordon ................................................................. Principal, Gustavus Elementary<br />
Mr. Alan Harris ....................................................................... Principal, <strong>Badger</strong> High School<br />
Mr. Kenneth Kashner .............................................................. Principal, Hartford Elementary<br />
Mr. Robert Moon..................................................................... Principal, <strong>Badger</strong> Middle School<br />
-xii-
Organizational Chart of the <strong>Joseph</strong> <strong>Badger</strong> <strong>Local</strong> School District<br />
Residents of The <strong>Joseph</strong> <strong>Badger</strong> <strong>Local</strong> School District<br />
Board of Education<br />
William A. Johnson<br />
Treasurer<br />
Richard A. Pachuk<br />
Superintendent<br />
County ESC Personnel<br />
Superintendent<br />
-xiii -<br />
Carol Johnson<br />
Financial Accountant<br />
Barb Obermiyer<br />
Payroll Accountant<br />
Karl Brest<br />
Transportation/<br />
Operations Director<br />
Cheryl Wildman<br />
Administrative Secretary<br />
Drivers<br />
Trina Kocab<br />
Registered Nurse<br />
Ryan Catcott<br />
Technology Coordinator<br />
Ron Gordon<br />
Gustavus Principal<br />
Ken Kashner<br />
Hartford Principal<br />
Bob Moon<br />
<strong>Badger</strong> Middle Principal<br />
Al Harris<br />
<strong>Badger</strong> High Principal<br />
Custodial Staff Teaching Staff Secretarial Staff Cafeteria Staff
Voinovich Government Center<br />
242 Federal Plaza West<br />
Suite 302<br />
Youngstown, Ohio 44503<br />
Telephone 330-797-9900<br />
800-443-9271<br />
Facsimile 330-797-9949<br />
www.auditor.state.oh.us<br />
REPORT OF INDEPENDENT ACCOUNTANTS<br />
<strong>Joseph</strong> <strong>Badger</strong> <strong>Local</strong> School District<br />
Trumbull County<br />
8317 Main Street<br />
Kinsman, Ohio 44428<br />
We have audited the accompanying basic financial statements of the <strong>Joseph</strong> <strong>Badger</strong> <strong>Local</strong> School District,<br />
Trumbull County, (the District) as of and for the year ended June 30, <strong>2001</strong>, as listed in the table of contents.<br />
These basic financial statements are the responsibility of the District’s management. Our responsibility is<br />
to express an opinion on these basic financial statements based on our audit.<br />
We conducted our audit in accordance with auditing standards generally accepted in the United States of<br />
America and the standards applicable to financial audits contained in Government Auditing Standards,<br />
issued by the Comptroller General of the United States. Those standards require that we plan and perform<br />
the audit to obtain reasonable assurance about whether the financial statements are free of material<br />
misstatement. An audit includes examining, on a test basis, evidence supporting the amounts and<br />
disclosures in the financial statements. An audit also includes assessing the accounting principles used and<br />
significant estimates made by management, as well as evaluating the overall financial statement<br />
presentation. We believe that our audit provides a reasonable basis for our opinion.<br />
In our opinion, the basic financial statements referred to above present fairly, in all material respects, the<br />
financial position of the <strong>Joseph</strong> <strong>Badger</strong> <strong>Local</strong> School District, Trumbull County, as of June 30, <strong>2001</strong>, and the<br />
results of its operations and the cash flows of its business type activities for the year then ended in<br />
conformity with accounting principles generally accepted in the United States of America.<br />
In accordance with Government Auditing Standards, we have also issued our report dated December 20,<br />
<strong>2001</strong> on our consideration of the District’s internal control over financial reporting and our tests of its<br />
compliance with certain provisions of laws, regulations, contracts and grants. That report is an integral part<br />
of an audit performed in accordance with Government Auditing Standards and should be read in conjunction<br />
with this report in considering the results of our audit.<br />
Management’s Discussion and Analysis is not a required part of the basic financial statements, but is<br />
supplementary information the Governmental Accounting Standards Board requires. We applied certain<br />
limited procedures, consisting principally of inquiries of management regarding the methods of<br />
measurement and presentation of the supplementary information. We did not audit the information and<br />
express no opinion thereon.<br />
We performed our audit to form an opinion on the basic financial statements of the District, taken as a whole.<br />
The combining and individual fund statements and schedules listed in the table of contents are presented<br />
for additional analysis and are not a required part of the basic financial statements. We subjected this<br />
information to the auditing procedures applied in the audit of the basic financial statements and, in our<br />
opinion, is fairly presented in all material respects, in relation to the basic financial statements taken as a<br />
whole.<br />
1
<strong>Joseph</strong> <strong>Badger</strong> <strong>Local</strong> School District<br />
Trumbull County<br />
Report of Independent Accountants<br />
Page 2<br />
We did not audit the data included in the introductory and statistical sections of this report and therefore<br />
express no opinion thereon.<br />
Jim Petro<br />
Auditor of State<br />
December 20, <strong>2001</strong><br />
2
<strong>Joseph</strong> <strong>Badger</strong> <strong>Local</strong> School District<br />
Management’s Discussion and Analysis<br />
For the Fiscal Year Ended June 30, <strong>2001</strong><br />
Unaudited<br />
It is again an honor to present the financial discussion and analysis of <strong>Joseph</strong> <strong>Badger</strong> <strong>Local</strong> School District.<br />
Here in these next few paragraphs, tables and graphic illustrations are the management’s view of how our<br />
school district is currently performing and how facts may change that performance in the future. This is<br />
intended to be a clear presentation to our taxpayers and all others who may be interested in our School<br />
District. Please use our comments along with the accompanying transmittal letter; financial statements and<br />
notes to better understand our School District’s finances<br />
FINANCIAL HIGHLIGHTS<br />
¤ The School District’s total net assets increased from $3,392,012 to $3,681,379 for a gain of<br />
$289,367 during this year’s operations. The net assets of Governmental activities increased 8.9<br />
percent. Business-type activities showed a decrease in net assets of ($9,276) or (28.5) percent.<br />
¤ Total governmental activities revenues of $7,512,972 were comprised of General revenues in the<br />
amount of $7,054,037 and program revenues totaling $458,935. Program revenues are grants, fees<br />
and donations; general (non-program) revenue is Foundation from the State of Ohio and <strong>Local</strong><br />
Taxes charged to residents of the school district. In table 3 below, you will find the detailed cost of<br />
each program to our District.<br />
¤ The School District’s business type activities showed program revenue of $309,567 compared to<br />
$301,037 last fiscal year. This equates to a 2.83 percent increase in revenue. Business type<br />
expenses were $319,127 in comparison to last year’s $297,844 for an increase of 7.15 percent.<br />
¤ In November of 1998, the <strong>Joseph</strong> <strong>Badger</strong> Board of Education transferred General Fund dollars into<br />
the Debt Service Fund. This was done to reduce taxes in appreciation of the passage of three<br />
consecutive renewal levies. This action enabled the Board to purchase investments sufficient to<br />
retire all remaining principal and interest as it came due. It also allowed the Board to stop<br />
collection of taxes associated with Debt Service. This year, the final principal and interest payment<br />
was made leaving <strong>Joseph</strong> <strong>Badger</strong> <strong>Local</strong> <strong>Schools</strong> debt-free.<br />
¤ Our new administrative offices began last year as Construction in Progress. It can now be seen as<br />
Buildings and Improvements. This accounts for most of the increase in the Investment in Capital<br />
Assets portion of Net Assets, which increased from $1,948,164 at the end of fiscal 2000 to<br />
$2,304,145 at the end of fiscal <strong>2001</strong>.<br />
USING THIS ANNUAL REPORT<br />
This annual report consists a series of financial statements. The Statement of Net Assets and the Statement<br />
of Activities (on pages 13 and 14-15) provide information about the activities of the District as a whole and<br />
present a longer-term view of the District’s finances. Fund financial statements start on page 16. For<br />
governmental activities, these statements tell how these services were financed in the short term as well as<br />
what remains for future spending. Fund financial statements also report the District’s operations in more<br />
detail than the government-wide statements by providing information about the District’s most significant<br />
funds. The remaining statements provide financial information about activities for which the District acts<br />
solely as a trustee or agent for the benefit of those outside the government.<br />
- 3 -
<strong>Joseph</strong> <strong>Badger</strong> <strong>Local</strong> School District<br />
Management’s Discussion and Analysis<br />
For the Fiscal Year Ended June 30, <strong>2001</strong><br />
Unaudited<br />
Reporting the School District as a Whole (district-wide)<br />
The only two reports that display district-wide finances are the Statement of Net Assets and the Statement of<br />
Activities. Within these statements, we show the School District divided into two kinds of activities:<br />
¤ Governmental Activities – All of the School District’s instructional activities are reported here.<br />
Property Taxes, State and Federal Grants and fees finance the majority of activity in this group.<br />
¤ Business-Type Activities – If the Board of Education sets a fee designed to offset the cost of<br />
operating a program, then this defines a business-type activity. The School District’s school lunch<br />
program is reported here.<br />
Analysis of the School District as a whole begins on page 5. One of the most important issues when<br />
analyzing any business entity is “Are you better off today than you were one year ago?” The two districtwide<br />
documents try to state and support the answer to this quandary. These statements include all assets and<br />
liabilities using the accrual basis of accounting, which is similar to the accounting used by most privatesector<br />
companies. The most important aspect of accrual accounting is that all of the year’s revenues and<br />
expenses are reported regardless of when cash is received or paid out.<br />
These statements also display the net assets of the School District and note any changes that occurred during<br />
the year. Net assets are the difference between assets and liabilities and they tend to be the lead indicator of<br />
financial health. Please investigate other factors such as changes in property tax values, tax levies and<br />
renewals or state funding issues before reaching a final conclusion about our School District’s financial<br />
status. Please also look at the individual fund conditions to show the composition of the changes.<br />
Reporting the School District’s Most Significant Funds (fund financials<br />
Analysis of the School District’s major funds begins on page 8. The fund financial statements begin on<br />
page 16 and provide detailed information about each significant fund in contrast to the previously described<br />
district-wide reporting. Most of the funds are required to be established by State law. Using strict<br />
definitions the District did not have any major Governmental funds other than the General Fund but the<br />
District treasurer chose to present Debt Service and Permanent Improvement as major Governmental Funds.<br />
Governmental funds – Most of the School District’s funds are reported as governmental funds. These<br />
reports focus on how resources flow into and out of these funds and the balances left at year-end that are<br />
available for spending. These reports are done on a modified accrual basis, which measures cash and all<br />
other financial assets that can be readily converted into cash. The governmental fund statements provide a<br />
detailed short-term view of the School District’s general government operations and the basic services it<br />
provides. There are differences between governmental funds (as reported in this section) and Governmental<br />
Activities as reported in the Statement of Net Assets and the Statement of Activities. These differences are<br />
reconciled in the financial statements.<br />
Proprietary funds – The Board of Education charges students a fee for school lunch. The money collected<br />
locally combined with State and Federal reimbursements, is intended to defray all expenses necessary to<br />
operate the food service program. Each month the Board reviews cash projections to see if the lunch fund<br />
will negatively impact the general fund. This is the School District’s only proprietary fund. Proprietary<br />
funds utilize the same form of accounting as business-type activities; therefore these statements match those<br />
found in the district-wide statements.<br />
- 4 -
<strong>Joseph</strong> <strong>Badger</strong> <strong>Local</strong> School District<br />
Management’s Discussion and Analysis<br />
For the Fiscal Year Ended June 30, <strong>2001</strong><br />
Unaudited<br />
The School District as a Trustee<br />
The School District is a trustee or fiduciary for a single fund. This fund holds and invests the principal<br />
amount and provides the earnings in the form of a scholarship for a graduating senior. There is no School<br />
District related activity occurring within this fund.<br />
THE SCHOOL DISTRICT AS A WHOLE<br />
The Statement of Net Assets looks at the District as a whole. The School District’s total net assets were up<br />
from a year ago. Table 1, shows an increase to $3,681,378 from $3,388,710. The increase in Net Assets<br />
indicates that the School District was able to improve on an already healthy picture. Capital Assets jumped<br />
mainly due to the completion of the Central Office addition to the <strong>Badger</strong> High School Building. You will<br />
see this fact presented in a graph and a table during discussion of the change in net assets. The State of Ohio<br />
also lifted most of the restrictions on the Budget Reserve set aside causing restricted assets to decline.<br />
(Table 1)<br />
Net Assets<br />
Governmental Activities Business-Type Activities Total<br />
<strong>2001</strong> 2000 <strong>2001</strong> 2000 <strong>2001</strong> 2000<br />
Assets<br />
Current and Other Assets $5,331,338 $5,197,404 $22,601 $33,248 $5,353,939 $5,230,652<br />
Capital Assets 2,304,145 1,948,164 37,588 36,499 2,341,733 1,984,663<br />
Total Assets 7,635,483 7,145,568 60,189 69,747 7,695,672 7,215,315<br />
Liabilities<br />
Long-Term Liabilities (551,730) (549,721) (3,842) (4,991) (555,572) (554,712)<br />
Other Liabilities (3,425,606) (3,239,645) (33,115) (32,248) (3,458,721) (3,271,893)<br />
Total Liabilities (3,977,336) (3,789,366) (36,957) (37,239) (4,014,293) (3,826,605)<br />
Net Assets<br />
Invested In Capital<br />
Assets 2,304,145 1,928,164 37,588 36,499 2,341,733 1,964,663<br />
Restricted 117,258 152,549 0 0 117,258 152,549<br />
Unrestricted (Deficit) 1,236,743 1,275,489 (14,356) (3,991) 1,222,388 1,271,498<br />
Total Net Assets $3,658,146 $3,356,202 $23,232 $32,508 $3,681,379 $3,388,710<br />
Current and Other Assets increased due to revenue exceeding expenses during the current year, which<br />
increased cash by $96,984.<br />
Capital Assets were added in the gross amount of $876,201. Most of the increase is from the completion<br />
and furnishing of the Central Office. To arrive at the net increase in Capital Assets, you must subtract this<br />
year’s depreciation expense of $214,235.<br />
The net assets of our food service business-type activity decreased from $32,508 to $23,232. This<br />
represents a decline in fiscal health despite last year’s increase in lunch prices. Management will need to<br />
either raise prices again or cut personnel if the lunch program is to remain in the black. The Board could<br />
- 5 -
<strong>Joseph</strong> <strong>Badger</strong> <strong>Local</strong> School District<br />
Management’s Discussion and Analysis<br />
For the Fiscal Year Ended June 30, <strong>2001</strong><br />
Unaudited<br />
also opt to accept that the general fund would need to transfer cash to the food service fund. Projections<br />
show that this would be on a continuing basis and would grow rapidly in the future.<br />
Table 2 highlights the District’s revenues and expenses. These two main components are subtracted to yield<br />
the change in net assets. This table utilizes the full accrual method of accounting.<br />
Expenses are shown in programs that are easily identifiable utilizing the current Uniform School<br />
Accounting System (USAS) coding structure.<br />
This is the second year the School District has prepared financial statements following <strong>GASB</strong> Statement 34,<br />
so revenue and expense comparisons to fiscal year 2000 are presented along side the current fiscal year.<br />
This will enable the reader to draw further conclusions about this District’s financial status.<br />
(Chart 1)<br />
Governmental (Only) Revenue and Program Expenses<br />
Fiscal <strong>2001</strong> and Fiscal 2000<br />
Other<br />
2.63%<br />
Program and General Revenues<br />
Fiscal <strong>2001</strong><br />
Charges for<br />
Services<br />
1.11%<br />
Operating<br />
Grants<br />
3.93%<br />
Capital Grants<br />
1.06%<br />
Other<br />
3.55%<br />
Program and General Revenues<br />
Fiscal 2000<br />
Charges for<br />
Services<br />
0.73%<br />
Operating Grants<br />
4.11%<br />
Capital Grants<br />
0.45%<br />
Grants and<br />
Entitlements<br />
57.24%<br />
Property Taxes<br />
34.02%<br />
Grants and<br />
Entitlements<br />
56.19%<br />
Property Taxes<br />
34.97%<br />
Services Provided Fiscal <strong>2001</strong><br />
Services Provided Fiscal 2000<br />
Operation /<br />
Maintenance of<br />
Plant<br />
8.37%<br />
Pupil<br />
Transportation<br />
8.03%<br />
Extracurricular<br />
Activities / Other<br />
2.56%<br />
Operation /<br />
Maintenance of<br />
Plant<br />
8.58%<br />
Pupil<br />
Transportation<br />
8.46%<br />
Extracurricular<br />
Activities / Other<br />
2.60%<br />
Board /<br />
Administration /<br />
Central<br />
16.51%<br />
Instruction<br />
58.55%<br />
Board /<br />
Administration /<br />
Central<br />
14.44%<br />
Instruction<br />
60.00%<br />
Health / Media /<br />
Guidance<br />
5.98%<br />
Health / Media /<br />
Guidance<br />
5.93%<br />
- 6 -
<strong>Joseph</strong> <strong>Badger</strong> <strong>Local</strong> School District<br />
Management’s Discussion and Analysis<br />
For the Fiscal Year Ended June 30, <strong>2001</strong><br />
Unaudited<br />
(Table 2)<br />
Program Revenues and Expenses<br />
Governmental Governmental Business-<br />
Type<br />
Business-<br />
Type<br />
Activities Activities Activities Activities Total Total<br />
<strong>2001</strong> 2000 <strong>2001</strong> 2000 <strong>2001</strong> 2000<br />
Revenues<br />
Program Revenues:<br />
Charges for Services $83,505 $53,581 $192,145 $173,907 $275,650 $227,488<br />
Operating Grants 295,623 302,526 117,422 120,762 413,045 423,288<br />
Capital Grants 79,807 32,851 0 6,368 79,807 39,219<br />
General Revenue:<br />
Property Taxes 2,556,186 2,572,442 0 0 2,556,186 2,572,442<br />
Grants and Entitlements 4,300,266 4,133,565 0 0 4,300,267 4,133,565<br />
Other 197,585 261,492 284 901 197,869 262,393<br />
Total Revenues $7,512,972 $7,356,457 $309,851 $301,938 $7,822,824 $7,658,395<br />
Program Expenses<br />
Instruction:<br />
Regular $3,578,852 $3,369,166 $0 $0 $3,582,154 $3,369,166<br />
Special 587,040 371,262 0 0 587,040 371,262<br />
Vocational 50,628 51,646 0 0 50,628 51,646<br />
Support Services:<br />
Pupils 264,410 252,287 0 0 264,410 252,287<br />
Instructional Staff 168,253 122,148 0 0 168,253 122,148<br />
Board of Education 136,730 73,278 0 0 136,730 73,278<br />
Administration 764,260 663,633 0 0 764,260 663,633<br />
Fiscal 235,506 162,282 0 0 235,506 162,282<br />
Business 0 13,312 0 0 0 13,312<br />
Operation and Maintenance of Plant 606,097 542,027 0 0 606,097 542,027<br />
Pupil Transportation 581,336 534,694 0 0 581,336 534,694<br />
Central 58,765 59,176 0 0 58,765 59,176<br />
Operation of Non-Instructional<br />
Services 384 5,917 0 0 384 5,917<br />
Extracurricular Activities 178,163 164,067 0 0 178,163 164,067<br />
Debt Service:<br />
Principal Retirement<br />
Interest and Fiscal Charges 604 2,054 0 0 604 2,054<br />
Food Service 0 0 319,127 297,844 319,127 297,844<br />
Total Expenses $7,211,028 $6,386,949 $319,127 $297,844 $7,533,457 $6,684,793<br />
Increase (Decrease) in Net Assets $301,944 $969,508 ($9,276) $4,094 $289,367 $973,602<br />
- 7 -
<strong>Joseph</strong> <strong>Badger</strong> <strong>Local</strong> School District<br />
Management’s Discussion and Analysis<br />
For the Fiscal Year Ended June 30, <strong>2001</strong><br />
Unaudited<br />
Analysis of overall financial position and results of operations<br />
The financial position of the <strong>Joseph</strong> <strong>Badger</strong> <strong>Local</strong> School District has improved over the past fiscal year.<br />
Net Assets continue to increase showing improving fiscal health. The results of operations were excellent<br />
and within parameters established at the beginning of the fiscal year. Management was able to make<br />
improvements in services for children by spending more on Regular and Special Instruction, health and<br />
guidance services. The District’s Capital Assets were also enhanced significantly this reporting period.<br />
Though spending was increased, cash balances were preserved and even improved slightly. The district<br />
enjoyed a successful financial year and operations improved.<br />
With the planning, building, furnishing and equipping of a new office, Board of Education, Administration<br />
and Fiscal programs increased substantially over last year. It is known that these programs will be<br />
decreased next year.<br />
In table 3 below the total cost of services column contains all costs related to the programs and the net cost<br />
column shows how much of the total amount is not covered by program revenues. The net costs are<br />
program costs that must be covered by unrestricted state aid (State Foundation) or local taxes. The<br />
difference in these two columns would represent restricted grants, fees and donations.<br />
(Table 3)<br />
Governmental Activities<br />
Total Cost<br />
of<br />
Total Cost<br />
of<br />
Net Cost<br />
of<br />
Net Cost<br />
of<br />
Programs Services Services Services Services<br />
<strong>2001</strong> 2000 <strong>2001</strong> 2000<br />
Instruction $4,219,822 $3,792,074 $3,860,864 $3,461,674<br />
Support Services:<br />
Pupils and Instructional Staff 432,663 374,435 428,163 371,985<br />
Board of Education, Administration,<br />
Fiscal and Business Services 1,136,496 912,505 1,114,779 912,505<br />
Operation and Maintenance of Plant 606,097 542,027 603,328 542,027<br />
Pupil Transportation 581,336 534,694 578,914 534,694<br />
Central 58,765 59,176 58,454 59,176<br />
Operation of Non-Instructional Services 384 5,917 384 5,492<br />
Extracurricular Activities 178,163 164,067 109,905 107,923<br />
Interest and Fiscal Charges 604 2,054 604 2,296<br />
Total Expenses $7,214,330 $6,386,949 $6,755,395 $5,997,772<br />
THE DISTRICT’S FUNDS<br />
As previously stated, these funds are accounted for using the modified accrual basis of accounting. All<br />
Governmental funds had total revenues of $7,643,828 and expenditures of $7,568,330. A slight increase to<br />
cash was realized.<br />
- 8 -
<strong>Joseph</strong> <strong>Badger</strong> <strong>Local</strong> School District<br />
Management’s Discussion and Analysis<br />
For the Fiscal Year Ended June 30, <strong>2001</strong><br />
Unaudited<br />
General Fund Financial Activity<br />
The most significant Governmental Fund is the General Fund. The fund balance of the General Fund<br />
increased by $31,023. Though both State Foundation Revenue and Tax Revenue increased, expenditures<br />
associated with construction of the central office offset the cash increase.<br />
General Fund Budgetary Highlights<br />
In this fund, the forecasted receipts and expenditures presented to the <strong>Joseph</strong> <strong>Badger</strong> Board of Education in<br />
September finished the reporting period within expectations. The general fund receipts were estimated<br />
within one percent of actual revenue and actual expenditures exceeded the estimate by two percentage<br />
points. This meant that it was not necessary to revise the associated five-year forecast required by the State<br />
of Ohio. It is this District’s year-end policy to request an amended certificate of estimated resources that<br />
equals actual revenues and to pass an appropriation resolution whose amounts equal actual expenditures and<br />
encumbrances in the majority of accounts at year-end.<br />
CAPITAL ASSETS<br />
The following table shows ending balances of capital assets invested in various categories. Notice that we<br />
are showing a total increase of $587,908 less the depreciation expense. You may discern that the value of<br />
the bus fleet dropped during this fiscal year. A new bus was planned and ordered but did not arrive for<br />
inclusion into the fixed assets this fiscal year. The fleet of vehicles should show a depreciated value of<br />
over $500,000 to indicate that it is in top condition. Next fiscal year we will report this bus and also one<br />
more new bus will be ordered to bring the fleet back up to a higher standard. Capital assets were improved<br />
not only by a building addition but also through additions and replacements to computer resources. New<br />
classroom furniture was again a welcome addition to our furniture assets. The new Central Office required<br />
furnishing and this added to our furniture and equipment assets. We also improved our textbook resources.<br />
Capital Assets<br />
(Table 4)<br />
Capital Assets at June 30<br />
(Net of Depreciation)<br />
Governmental Activities Business-Type Activities Total<br />
<strong>2001</strong> 2000 <strong>2001</strong> 2000 <strong>2001</strong> 2000<br />
Land $119,500 $119,500 $0 $0 $119,500 $119,500<br />
Land Improvements 56,370 60,070 0 0 56,370 60,070<br />
Buildings and Improvements 758,617 505,442 0 0 758,617 505,442<br />
Furniture and Equipment 761,137 617,528 37,588 36,499 798,725 654,027<br />
Vehicles 432,376 505,490 0 0 432,376 505,490<br />
Textbooks 176,145 122,442 0 0 176,145 122,442<br />
Construction in Progress 0 20,994 0 0 0 20,994<br />
Totals $2,304,145 $1,951,466 $37,588 $36,499 $2,341,733 $1,987,965<br />
- 9 -
<strong>Joseph</strong> <strong>Badger</strong> <strong>Local</strong> School District<br />
Management’s Discussion and Analysis<br />
For the Fiscal Year Ended June 30, <strong>2001</strong><br />
Unaudited<br />
$<br />
800,000<br />
700,000<br />
600,000<br />
500,000<br />
(Chart 2)<br />
Change in Net Assets<br />
The graph at the left shows the<br />
category and net worth of our<br />
School District’s assets. It is<br />
interesting to note that <strong>Joseph</strong><br />
<strong>Badger</strong> <strong>Local</strong> occupies 100<br />
square miles and as previously<br />
mentioned requires fleet of<br />
vehicles with a net worth of one<br />
half million dollars. Vehicles<br />
slid below this number but<br />
management will correct this<br />
during the upcoming year.<br />
400,000<br />
300,000<br />
200,000<br />
100,000<br />
0<br />
Land<br />
Land Improvements<br />
Buildings<br />
Furniture and Equipment<br />
Vehicles<br />
Textbooks<br />
Construction in Progress<br />
<strong>2001</strong><br />
2000<br />
The four buildings comprising<br />
the School District are all over<br />
sixty years old and technically<br />
could be fully depreciated.<br />
Since these buildings are<br />
currently still in use, they are<br />
shown with a value indicating<br />
that they will be used for four<br />
more years. The new addition<br />
was brought on and is reflected<br />
here. Construction in progress<br />
dropped to zero with the<br />
completion of the project.<br />
DEBT<br />
At June 30 th <strong>2001</strong> <strong>Joseph</strong> <strong>Badger</strong> was debt-free. This year we did not issue any new debt and we paid<br />
$20,000 in principal and $2,175 in interest.<br />
(Table 5)<br />
Outstanding Debt, at June 30<br />
Governmental Governmental<br />
Activities Activities<br />
<strong>2001</strong> 2000<br />
General Obligation Bonds:<br />
1980 Addition to High School $0 $20,000<br />
- 10 -
<strong>Joseph</strong> <strong>Badger</strong> <strong>Local</strong> School District<br />
Management’s Discussion and Analysis<br />
For the Fiscal Year Ended June 30, <strong>2001</strong><br />
Unaudited<br />
As of June 30, <strong>2001</strong> the School District’s legal debt margin was $8,243,123 with an unvoted debt margin of<br />
$91,590. Neither Moody’s nor Standard & Poor’s currently rate the <strong>Joseph</strong> <strong>Badger</strong> <strong>Local</strong> School District.<br />
About the Future<br />
<strong>Joseph</strong> <strong>Badger</strong> <strong>Local</strong> School District is presently financially strong and trending toward additional fiscal<br />
health. Management is optimistic about the future for this School District, however the following facts<br />
could change this outlook for the better or worse.<br />
The School District’s four buildings, continue to be a source of current and future concern. Management is<br />
proceeding with plans to find and secure real estate central in our district with specifications matching those<br />
required by the Ohio School Facilities Commission. Management has employed an architect and formed a<br />
site selection committee to narrow the search to a small number of land parcels with the appropriate<br />
specifications. The Board is determined to purchase land in the near future and subsequently to build a<br />
school complex on that single parcel and to demolish or sell the four existing properties. The purchase of<br />
property will be a Board responsibility and will be expenditure charged to the General Fund.<br />
The most recently filed five-year forecast shows that this School District will not require the passage of any<br />
new additional operating mills in the near term. Renewal of two emergency levies in November of 2002<br />
and 2003 will be required to ensure a solid future. Failure of either or both of these levies could have<br />
disastrous consequences on School District finances. These levies bring a combined one million dollars per<br />
year to this District. Five-year emergency levies are precarious because they must be renewed, however,<br />
past Boards and Administrators were not successful in passing continuing levies. The Board has discussed<br />
several alternative tax strategies. Management will attempt to replace emergency millage with continuing<br />
millage at some point in the future.<br />
We are dependent on outside factors for our future success. The Ohio School Funding Formula provides<br />
most of the revenue for <strong>Joseph</strong> <strong>Badger</strong> <strong>Local</strong> <strong>Schools</strong>. The legislators in Ohio have been working diligently<br />
on the Formula to provide equitable and adequate education for children throughout our State. Their efforts<br />
added some revenue to the <strong>Joseph</strong> <strong>Badger</strong> <strong>Local</strong> <strong>Schools</strong>; however, much of the new revenue has<br />
restrictions that could cause a decrease in spending on regular instruction. While a significant increase in<br />
the State’s financial efforts would be welcome, our forecasts do not take this possibility into account. We<br />
only anticipate a small increase in State revenue each year.<br />
All insurance premiums and in particular health care premiums are slated to increase drastically. The<br />
insurance consortium to which <strong>Joseph</strong> <strong>Badger</strong> belongs has increased the premium rates 40 percent. This<br />
will cost the District an additional $200,000 per year. Health care cost containment has become a large<br />
issue for the future. Management negotiated a contract that will require new teaching employees to switch<br />
to managed care and away from traditional programs.<br />
<strong>Joseph</strong> <strong>Badger</strong> <strong>Local</strong> has thirteen teachers approaching retirement. Often if a senior teacher retires, they are<br />
replaced at a much lower cost. This could have a positive affect on District finances.<br />
Important Business Ratios<br />
This year we have tried to display some important business ratios for our District. These ratios reveal some<br />
of the key financial components of our business. In this chart we take a look at issues such as Financial<br />
Position, Liquidity, Solvency and Fiscal Capacity. Many readers will be familiar with these facts as they are<br />
often presented in the private sector.<br />
- 11 -
<strong>Joseph</strong> <strong>Badger</strong> <strong>Local</strong> School District<br />
Management’s Discussion and Analysis<br />
For the Fiscal Year Ended June 30, <strong>2001</strong><br />
Unaudited<br />
Financial Position shows assets or fund balances and how they relate to total revenue or total expenses.<br />
Liquidity looks at Assets or Cash compared to Liabilities. Solvency is the reverse picture that attempts to<br />
disclose how liabilities stack up to resources. Solvency also discloses how significant debt service<br />
requirements are relative to overall expenditures. Fiscal capacity ratios try to indicate how difficult it is to<br />
meet your obligations and if it is feasible to attach more liability or debt to the population.<br />
(Table 6)<br />
Business Ratios<br />
Dividend<br />
Divisors<br />
Actual Ratio Dividend<br />
Divisors<br />
Actual<br />
Financial Position<br />
Net Assets to: $3,658,147 Fund Balance to: $ 1,824,499<br />
Total Revenue 7,054,037 0.5186 Total Revenue 7,643,828 0.2387<br />
Total Expenses 7,211,028 0.5073 Total Expenses 7,568,330 0.2411<br />
Change in Net Assets to: $ 301,944 Unreserved Fund Balance to: 1,380,823<br />
Total Revenue 7,054,037 0.0428 Total Revenue 7,643,828 0.1806<br />
Total Expenses 7,211,028 0.0419 Total Expenses 7,568,330 0.1824<br />
Liquidity<br />
Current Assets to: $ 5,331,337 Cash and Investments to: $ 2,282,142<br />
Current Liabilities 3,425,606 1.5563 Current Liabilities 3,425,606 0.6662<br />
Solvency<br />
Total Liabilities to: $ 3,977,336 Total Liabilities to: $3,977,336<br />
Total Assets 7,635,482 0.5209 Net Assets 3,658,146 1.0873<br />
Total Liabilities to: $3,977,336 Debt Service to: $20,000<br />
Total Revenues 7,054,037 0.5638 Total Expenditures 7,211,028 0.0028<br />
Fiscal Capacity<br />
Total Liabilities x 100 $ 397,733,600 Total Liabilities to: $ 3,977,336<br />
Total Assessed Property Value 91,590,252 4.3425 Population 7,066 562.8837<br />
Property Tax Revenues x 100 to: $ 255,618,600 Property Tax Revenues to: $ 2,556,186<br />
Total Assessed Property Value 91,590,252 2.7909 Population 7,066 361.7585<br />
Ratio<br />
Contacting the School District’s Financial Management<br />
These financial reports and discussions are designed to provide our students, citizens, taxpayers, investors<br />
and creditors with a complete disclosure of the School District’s finances and to demonstrate a high<br />
degree of accountability for the public dollars entrusted to us. If you have questions about this report or<br />
need additional financial information, please write William A. Johnson, Treasurer at <strong>Joseph</strong> <strong>Badger</strong> <strong>Local</strong><br />
School District, 8317 Main Street, Kinsman, Ohio 44428 or call (330) 876-1051 or E-mail<br />
William.Johnson@Neomin.Org.<br />
- 12 -
<strong>Joseph</strong> <strong>Badger</strong> <strong>Local</strong> School District<br />
Statement of Net Assets<br />
June 30, <strong>2001</strong><br />
Assets:<br />
Governmental Business Type<br />
Activities Activities Total<br />
Equity in Pooled Cash and<br />
Cash Equivalents $2,282,142 $16,351 $2,298,493<br />
Receivables:<br />
Accrued Interest 9,550 0 9,550<br />
Intergovernmental 138 0 138<br />
Taxes 2,745,415 0 2,745,415<br />
Inventory Held for Resale 0 5,257 5,257<br />
Materials and Supplies<br />
Inventory 27,015 993 28,008<br />
Restricted Assets 267,077 0 267,077<br />
Land 119,500 0 119,500<br />
Depreciable Capital Assets, Net of Depreciation 2,184,645 37,588 2,222,233<br />
Total Assets 7,635,482 60,189 7,695,671<br />
Liabilities:<br />
Accounts Payable 6,378 0 6,378<br />
Contracts Payable 6,496 0 6,496<br />
Accrued Wages 583,439 19,336 602,775<br />
Intergovernmental Payable 169,236 11,375 180,611<br />
Deferred Revenue 2,660,057 2,404 2,662,461<br />
Long Term Liabilities<br />
Due In More Than One Year 551,730 3,842 555,572<br />
Total Liabilities 3,977,336 36,957 4,014,293<br />
Net Assets:<br />
Investment in Capital Assets 2,304,145 37,588 2,341,733<br />
Restricted for:<br />
Capital Projects 47,312 0 47,312<br />
Debt Service 1,254 0 1,254<br />
Other Purposes 68,692 0 68,692<br />
Unrestricted (Deficit) 1,236,743 (14,356) 1,222,387<br />
Total Net Assets $3,658,146 $23,232 $3,681,378<br />
See accompanying notes to the basic financial statement<br />
- 13 -
<strong>Joseph</strong> <strong>Badger</strong> <strong>Local</strong> School District<br />
Statement of Activities<br />
For the Fiscal Year Ended June 30, <strong>2001</strong><br />
Program Revenues<br />
Governmental Activities<br />
Charges for Operating Grants Capital Grants<br />
Expenses Services and Sales and Contributions and Contributions<br />
Instruction:<br />
Regular $3,578,852 $15,736 $85,853 $78,871<br />
Special 587,040 1,835 176,317 105<br />
Vocational 50,628 228 0 13<br />
Support Services:<br />
Pupils 264,410 1,177 2,433 68<br />
Instructional Staff 168,253 777 0 45<br />
Board of Education 136,730 616 0 35<br />
Administration 764,260 4,910 5,328 282<br />
Fiscal 235,506 1,066 9,419 61<br />
Operation and Maintenance of P 606,097 2,619 0 150<br />
Pupil Transportation 581,336 2,291 0 131<br />
Central 58,765 294 0 17<br />
Operation of Non-Instructional<br />
Services 384 0 0 0<br />
Extracurricular Activities 178,163 51,956 16,273 29<br />
Interest and Fiscal Charges 604 0 0 0<br />
Total Governmental Activites 7,211,028 83,505 295,623 79,807<br />
Business-Type Activity<br />
Food Service 319,127 192,145 117,422 0<br />
Totals $7,530,155 $275,650 $413,045 $79,807<br />
General Revenues<br />
Property Taxes Levied for:<br />
General Purposes<br />
Capital Outlay<br />
Grants and Entitlements not Restricted to Specific Programs<br />
Investment Earnings<br />
Miscellaneous<br />
Total General Revenues<br />
Changes in Net Assets<br />
Net Assets Beginning of Year<br />
Net Assets End of Year<br />
See accompanying notes to the basic financial statements<br />
- 14 -
Net (Expense) Revenue<br />
and Changes in Net Assets<br />
Governmental Business Type<br />
Activities Activity Total<br />
($3,398,392) $0 ($3,398,392)<br />
(408,783) 0 (408,783)<br />
(50,387) 0 (50,387)<br />
(260,732) 0 (260,732)<br />
(167,431) 0 (167,431)<br />
(136,079) 0 (136,079)<br />
(753,740) 0 (753,740)<br />
(224,960) 0 (224,960)<br />
(603,328) 0 (603,328)<br />
(578,914) 0 (578,914)<br />
(58,454) 0 (58,454)<br />
(384) 0 (384)<br />
(109,905) 0 (109,905)<br />
(604) 0 (604)<br />
(6,752,093) 0 (6,752,093)<br />
0 (9,560) (9,560)<br />
(6,752,093) (9,560) (6,761,653)<br />
2,503,817 0 2,503,817<br />
52,369 0 52,369<br />
4,300,266 0 4,300,266<br />
159,079 284 159,363<br />
38,506 0 38,506<br />
7,054,037 284 7,054,321<br />
301,944 (9,276) 292,668<br />
3,356,202 32,508 3,388,710<br />
$3,658,146 $23,232 $3,681,378<br />
- 15 -
<strong>Joseph</strong> <strong>Badger</strong> <strong>Local</strong> School District<br />
Balance Sheet<br />
Governmental Funds<br />
June 30, <strong>2001</strong><br />
Permanent Other<br />
Improvement Governmental<br />
General Capital Projects Funds<br />
Assets<br />
Equity in Pooled Cash and Cash Equivalents $2,282,142 $75,517 $99,387<br />
Restricted Assets:<br />
Equity in Pooled Cash and Cash Equivalents 33,356 0 0<br />
Receivables:<br />
Taxes 2,745,415 58,817 0<br />
Intergovernmental 138 0 0<br />
Accrued Interest 9,550 0 0<br />
Materials and Supplies Inventory 27,015 0 0<br />
Total Assets $5,097,616 $134,334 $99,387<br />
Liabilities and Fund Balances<br />
Liabilities<br />
Accounts Payable $6,378 $0 $0<br />
Contracts Payable 946 5,550 0<br />
Accrued Wages 570,363 0 13,076<br />
Intergovernmental Payable 120,733 0 2,145<br />
Deferred Revenue 2,729,180 58,467 0<br />
Total Liabilities 3,427,600 64,017 15,221<br />
Fund Balances<br />
Reserved for Encumbrances 211,708 15,051 36,910<br />
Reserved for Inventory 27,015 0 0<br />
Reserved for Unclaimed Monies 879 0 0<br />
Reserved for Property Taxes 16,235 350 0<br />
Reserved for Budget Stabilization 33,356 0 0<br />
Unreserved, Undesignated, Reported in:<br />
General Fund 1,380,823 0 0<br />
Special Revenue Funds 0 0 60,793<br />
Capital Projects Funds (Deficit) 0 54,916 (13,537)<br />
Total Fund Balances 1,670,016 70,317 84,166<br />
Total Liabilities and Fund Balances $5,097,616 $134,334 $99,387<br />
See accompanying notes to the basic financial statements<br />
- 16 -
<strong>Joseph</strong> <strong>Badger</strong> <strong>Local</strong> School<br />
Reconciliation of Total Governmental Fund Balance to<br />
Net Assets of Governmental Activities<br />
June 30,<strong>2001</strong><br />
Total Total Governmental Fund Balances $1,824,499<br />
Governmental<br />
Funds<br />
Amounts reported for governmental activities in the<br />
statement of net assets are different because<br />
$2,457,046 Capital assets used in governmental activities are not financial<br />
resources and therefore are not reported in the funds. 2,304,145<br />
33,356<br />
Other long-term assets are not available to pay for current-<br />
2,804,232 period expenditures and therefore are deferred in the funds.<br />
138 Delinquent Property Taxes 127,590<br />
9,550<br />
27,015<br />
Long-term liabilities, including bonds payable and accrued interest,<br />
$5,331,337 are not due and payable in the current period and therefore<br />
are not reported in the funds<br />
Compensated Absences (551,730)<br />
Pension Obligations (46,358)<br />
(598,088)<br />
$6,378 Net Assets of Governmental Activities $3,658,146<br />
6,496<br />
583,439<br />
122,878<br />
2,787,647<br />
3,506,838<br />
263,669<br />
27,015<br />
879<br />
16,585<br />
33,356<br />
1,380,823<br />
60,793<br />
41,379<br />
1,824,499<br />
$5,331,337<br />
- 17 -
<strong>Joseph</strong> <strong>Badger</strong> <strong>Local</strong> School District<br />
Statement of Revenues, Expenditures and Changes in Fund Balances<br />
Governmental Funds<br />
For the Fiscal Year Ended June 30, <strong>2001</strong><br />
Permanent<br />
Debt Improvement G<br />
General Service Capital Projects<br />
Revenues<br />
Taxes $2,604,821 $0 $57,221<br />
Intergovernmental 4,294,537 0 5,730<br />
Interest 157,845 503 0<br />
Tuition and Fees 30,594 0 0<br />
Extracurricular Activities 0 0 0<br />
Charges for Services 1,455 0 0<br />
Contributions and Donations 1,839 0 0<br />
Miscellaneous 38,506 0 0<br />
Total Revenues 7,129,597 503 62,951<br />
Expenditures<br />
Current:<br />
Instruction:<br />
Regular 3,471,026 0 0<br />
Special 407,083 0 0<br />
Vocational 50,628 0 0<br />
Support Services:<br />
Pupil 261,027 0 0<br />
Instructional Staff 171,924 0 0<br />
Board of Education 136,730 0 0<br />
Administration 750,233 0 0<br />
Fiscal 236,470 0 0<br />
Operation and Maintenance of Plant 582,599 0 0<br />
Pupil Transportation 511,125 0 0<br />
Central 65,241 0 0<br />
Extracurricular Activities 111,477 0 0<br />
Capital Outlay 336,027 0 12,660<br />
Debt Service:<br />
Principal Retirement 0 20,000 0<br />
Interest and Fiscal Charges 0 725 0<br />
Total Expenditures 7,091,590 20,725 12,660<br />
Excess of Revenues Over (Under) Expenditures 38,007 (20,222) 50,291<br />
Other Financing Sources (Uses)<br />
Transfers In 828 0 0<br />
Transfers Out (13,000) (828) 0<br />
Total Other Financing Sources (Uses) (12,172) (828) 0<br />
Net Change in Fund Balance 25,835 (21,050) 50,291<br />
Fund Balances Beginning of Year 1,638,993 21,050 20,026<br />
Increase in Reserve for Inventory 5,188 0 0<br />
Fund Balances End of Year $1,670,016 $0 $70,317<br />
See accompanying notes to the basic financial statements<br />
- 18 -
<strong>Joseph</strong> <strong>Badger</strong> <strong>Local</strong> School District<br />
Reconciliation of the Statement of Revenues, Expenditures and Changes<br />
in Fund Balances of Governmental Funds to the Statement of Activities<br />
For the Fiscal Year Ended June 30, <strong>2001</strong><br />
Other Total<br />
Governmental Governmental Net Change in Fund Balances - Total Governmental Funds $75,498<br />
Funds Funds<br />
Amounts reported for governmental activities in the<br />
$0 $2,662,042 statement of activities are different because<br />
382,317 4,682,584<br />
731 159,079 Governmental funds report capital outlays as expenditures.<br />
0 30,594 However, in the statement of activities, the cost of those<br />
60,198 60,198 assets is allocated over their estimated useful lives as<br />
0 1,455 depreciation expense. This is the amount by which capital<br />
7,531 9,370 outlays exceeded depreciation in the current period.<br />
0 38,506 Capital Outlay 570,216<br />
Depreciation Expense (214,235)<br />
450,777 7,643,828 355,981<br />
Revenues in the statement of activities that do not provide<br />
current financial resources are not reported as revenues<br />
in the funds.<br />
95,059 3,566,085 Taxes Revenue (105,856)<br />
177,287 584,370 Intergovernmental Receivable (25,000)<br />
0 50,628 (130,856)<br />
3,124 264,151 Repayment of bond principal is an expenditure in the<br />
0 171,924 governmental funds, but the repayment reduces long-term<br />
0 136,730 liabilities in the statement of net assets. 20,000<br />
5,988 756,221<br />
9,946 246,416 Some expenses reported in the statement of activities<br />
0 582,599 such as compensated absences and intergovernmental<br />
0 511,125 payable which represents contractually required pension<br />
0 65,241 contributions, do not require the use of current financial<br />
66,389 177,866 resources and therefore are not reported as expenditures<br />
85,562 434,249 in governmental funds.<br />
Compensated Absences (21,888)<br />
0 20,000 Intergovernmental Payable (1,979)<br />
0 725 Inventory 5,188<br />
(18,679)<br />
443,355 7,568,330<br />
Change in Net Assets of Governmental Activities $301,944<br />
7,422 75,498<br />
13,000 13,828<br />
0 (13,828)<br />
13,000 0<br />
20,422 75,498<br />
63,744 1,743,813<br />
0 5,188<br />
$84,166 $1,824,499<br />
- 19 -
<strong>Joseph</strong> <strong>Badger</strong> <strong>Local</strong> School District<br />
Statement of Revenues, Expenditures and Changes<br />
In Fund Balance - Budget (Non-GAAP Basis) and Actual<br />
General Fund<br />
For the Fiscal Year Ended June 30, <strong>2001</strong><br />
Variance With<br />
Budgeted Amounts<br />
Final Budget<br />
Favorable<br />
Original Final Actual (Unfavorable)<br />
Revenues<br />
Taxes $2,835,579 $2,594,692 $2,594,692 $0<br />
Intergovernmental 4,230,000 4,296,807 4,296,807 0<br />
Interest 170,000 163,390 163,390 0<br />
Tuition and Fees 40,000 30,594 30,594 0<br />
Charges for Services 2,000 1,455 1,455 0<br />
Contributions and Donations 22,846 1,839 1,839 0<br />
Miscellaneous 55,254 38,482 38,506 24<br />
Total Revenues 7,355,679 7,127,259 7,127,283 24<br />
Expenditures<br />
Current:<br />
Instruction:<br />
Regular 3,636,999 3,523,597 3,523,597 0<br />
Special 253,679 442,901 442,901 0<br />
Vocational 34,218 43,996 43,996 0<br />
Support Services:<br />
Pupils 233,828 268,144 268,144 0<br />
Instructional Staff 183,015 173,354 173,354 0<br />
Board of Education 135,725 138,834 138,834 0<br />
Administration 682,895 749,999 749,999 0<br />
Fiscal 200,591 211,049 211,049 0<br />
Operation and Maintenance of Plant 579,430 600,544 600,544 0<br />
Pupil Transportation 486,811 581,943 581,212 731<br />
Central 63,277 65,204 65,204 0<br />
Extracurricular Activities 105,075 110,465 110,465 0<br />
Capital Outlay 643,298 364,498 364,498 0<br />
Total Expenditures 7,238,841 7,274,528 7,273,797 731<br />
Excess of Revenues Over (Under) Expenditures $116,838 ($147,269) ($146,514) $755<br />
(continued)<br />
- 20 -
<strong>Joseph</strong> <strong>Badger</strong> <strong>Local</strong> School District<br />
Statement of Revenues, Expenditures and Changes<br />
In Fund Balance - Budget (Non-GAAP Basis) and Actual<br />
General Fund (continued)<br />
For the Fiscal Year Ended June 30, <strong>2001</strong><br />
Variance With<br />
Budgeted Amounts<br />
Final Budget<br />
Favorable<br />
Original Final Actual (Unfavorable)<br />
Other Financing Uses<br />
Operating Transfers In $0 $828 $828 $0<br />
Operating Transfers Out (5,000) (13,000) (13,000) 0<br />
Net Change in Fund Balance 111,838 (159,441) (158,686) 755<br />
Fund Balance Beginning of Year 1,742,401 1,742,401 1,742,401 0<br />
Prior Year Encumbrances Appropriated 511,471 511,471 511,471 0<br />
Fund Balance End of Year $2,365,710 $2,094,431 $2,095,186 $755<br />
See accompanying notes to the basic financial statements<br />
- 21 -
<strong>Joseph</strong> <strong>Badger</strong> <strong>Local</strong> School District<br />
Statement of Net Assets<br />
Enterprise Fund<br />
June 30, <strong>2001</strong><br />
Food<br />
Service<br />
Assets<br />
Equity in Pooled Cash and Cash Equivalents $16,351<br />
Inventory Held for Resale 5,257<br />
Materials and Supplies Inventory 993<br />
Total Current Assets 22,601<br />
Capital Assets, Net 37,588<br />
Total Assets 60,189<br />
Liabilities<br />
Accrued Wages 19,336<br />
Intergovernmental Payable 11,375<br />
Deferred Revenue 2,404<br />
Total Current Liabilities 33,115<br />
Long-Term Liabilities:<br />
Compensated Absences Payable 3,842<br />
Total Liabilities 36,957<br />
Net Assets<br />
Invested in Capital Assets 37,588<br />
Unrestricted (Deficit) (14,356)<br />
Total Net Assets $23,232<br />
See accompanying notes to the basic financial statements<br />
- 22 -
<strong>Joseph</strong> <strong>Badger</strong> <strong>Local</strong> School District<br />
Statement of Revenues,<br />
Expenses and Changes in Fund Net Assets<br />
Enterprise Fund<br />
For the Fiscal Year Ended June 30, <strong>2001</strong><br />
Food<br />
Service<br />
Operating Revenues<br />
Sales $192,145<br />
Operating Expenses<br />
Salaries 92,571<br />
Fringe Benefits 74,256<br />
Purchased Services 13,087<br />
Cost of Sales 135,313<br />
Depreciation 3,224<br />
Other 676<br />
Total Operating Expenses 319,127<br />
Operating Loss (126,982)<br />
Non-Operating Revenues<br />
Donated Commodities 22,137<br />
Interest 284<br />
Operating Grants 95,285<br />
Total Non-Operating Revenues 117,706<br />
Change in Net Assets (9,276)<br />
Net Assets Beginning of Year 32,508<br />
Net Assets End of Year $23,232<br />
See accompanying notes to the basic financial statements<br />
- 23 -
<strong>Joseph</strong> <strong>Badger</strong> <strong>Local</strong> School District<br />
Statement of Cash Flows<br />
Enterprise Fund<br />
For the Fiscal Year Ended June 30, <strong>2001</strong><br />
Food Service<br />
Increase (Decrease) in Cash and Cash Equivalents<br />
Cash Flows from Operating Activities:<br />
Cash Received from Customers $192,145<br />
Cash Payments to Employees for Services (96,691)<br />
Cash Payments for Employee Benefits (71,322)<br />
Cash Payments to Suppliers for Goods and Services (126,728)<br />
Other Cash Payments (676)<br />
Net Cash Used for Operating Activities (103,272)<br />
Cash Flows from Noncapital Financing Activities<br />
Operating Grants Received 95,285<br />
Cash Flows from Capital and Related Financing Activities<br />
Payments for Capital Acquisitions (4,313)<br />
Cash Flows from Investing Activities<br />
Interest on Investments 284<br />
Net Decrease in Cash and Cash Equivalents (12,016)<br />
Cash and Cash Equivalents Beginning of Year 28,367<br />
Cash and Cash Equivalents End of Year $16,351<br />
(continued)<br />
- 24 -
<strong>Joseph</strong> <strong>Badger</strong> <strong>Local</strong> School District<br />
Statement of Cash Flows<br />
Enterprise Fund (continued)<br />
For the Fiscal Year Ended June 30, <strong>2001</strong><br />
Food Service<br />
Reconciliation of Operating Loss to Net<br />
Cash Used for Operating Activities<br />
Operating Loss ($126,982)<br />
Adjustments to Reconcile Operating<br />
Loss to Net Cash Used for Operating Activities:<br />
Depreciation 3,224<br />
Donated Commodities Used During Year 22,137<br />
(Increase)/Decrease in Assets:<br />
Inventory Held for Resale (1,048)<br />
Materials and Supplies Inventory (321)<br />
Increase/(Decrease) in Liabilities:<br />
Accrued Wages 871<br />
Compensated Absences Payable (1,149)<br />
Intergovernmental Payable (908)<br />
Deferred Revenue 904<br />
Total Adjustments 23,710<br />
Net Cash Used for Operating Activities ($103,272)<br />
See accompanying notes to the basic financial statements<br />
- 25 -
<strong>Joseph</strong> <strong>Badger</strong> <strong>Local</strong> School District<br />
Statement of Fiduciary Net Assets<br />
Fiduciary Funds<br />
June 30, <strong>2001</strong><br />
Private Purpose<br />
Trust<br />
Scholarship Agency<br />
Assets<br />
Equity in Pooled Cash and Cash Equivalents $15,873 $17,347<br />
Receivables:<br />
Accrued Interest 54 0<br />
Total Assets 15,927 $17,347<br />
Liabilities<br />
Due to Students 0 $17,347<br />
Total Liabilities 0 $17,347<br />
Net Assets<br />
Held in Trust for Scholarships 15,927<br />
Total Net Assets $15,927<br />
See accompanying notes to the basic financial statements<br />
- 26 -
<strong>Joseph</strong> <strong>Badger</strong> <strong>Local</strong> School District<br />
Statement of Changes in Fiduciary Net Assets<br />
Fiduciary Fund<br />
For the Fiscal Year Ended June 30, <strong>2001</strong><br />
Private Purpose<br />
Trust<br />
Scholarship<br />
Additions<br />
Interest $928<br />
Deductions<br />
Operation of Non-Instructional Services<br />
Other 876<br />
Change in Net Assets 52<br />
Net Assets Beginning of Year 15,875<br />
Net Assets End of Year $15,927<br />
See accompanying notes to the basic financial statements<br />
- 27 -
<strong>Joseph</strong> <strong>Badger</strong> <strong>Local</strong> School District<br />
Notes to the Basic Financial Statements<br />
For the Fiscal Year Ended June 30, <strong>2001</strong><br />
Note 1 - Description of the School District and Reporting Entity<br />
<strong>Joseph</strong> <strong>Badger</strong> <strong>Local</strong> School District is a body politic and corporate established for the purpose of<br />
exercising the rights and privileges conveyed to it by the constitution and laws of the State of Ohio.<br />
The School District operates under a locally-elected five-member Board form of government and<br />
provides educational services as mandated by the State and/or federal agencies. This Board of Education<br />
controls the School District's four instructional/support facilities staffed by forty-six classified employees,<br />
seventy-three certificated full-time teaching personnel, and six administrators who provide services to<br />
1,191 students and other community members.<br />
Reporting Entity<br />
A reporting entity is comprised of the primary government, component units and other organizations that<br />
are included to ensure the financial statements are not misleading. The primary government of the School<br />
District consists of all funds, departments, boards and agencies that are not legally separate from the<br />
School District. For <strong>Joseph</strong> <strong>Badger</strong> <strong>Local</strong> School District, this includes general operations, food service<br />
and student related activities of the School District.<br />
Component units are legally separate organizations for which the School District is financially<br />
accountable. Component units may also include organizations that are fiscally dependent on the School<br />
District in that the School District approves their budget, the issuance of their debt or the levying of their<br />
taxes. The School District has no component units.<br />
The School District is associated with six jointly governed organizations, two public entity risk pools and<br />
a related organization. These organizations are presented in Notes 16, 17 and 18 to the financial<br />
statements. These organizations are:<br />
Jointly Governed Organizations:<br />
Trumbull County Career and Technical Center<br />
Northeast Ohio Management Information Network<br />
Northeast Ohio Instructional Media Center<br />
Trumbull Student Assistance Consortium<br />
Northeast Ohio Special Education Regional Resource Center<br />
Region 12 Professional Development Center<br />
Public Entity Risk Pools:<br />
Ohio School Boards Association Workers’ Compensation Group Rating Program<br />
Trumbull County <strong>Schools</strong> Employee Insurance Benefits Consortium<br />
Related Organization<br />
Kinsman Public Library<br />
Note 2 - Summary of Significant Accounting Policies<br />
The financial statements of <strong>Joseph</strong> <strong>Badger</strong> <strong>Local</strong> School District have been prepared in conformity with<br />
generally accepted accounting principles (GAAP) as applied to local governmental units. The<br />
Governmental Accounting Standards Board (<strong>GASB</strong>) is the accepted standard-setting body for<br />
establishing governmental accounting and financial reporting principles. The School District also applies<br />
- 28 -
<strong>Joseph</strong> <strong>Badger</strong> <strong>Local</strong> School District<br />
Notes to the Basic Financial Statements<br />
For the Fiscal Year Ended June 30, <strong>2001</strong><br />
Financial Accounting Standards Board (FASB) Statements and Interpretations issued on or before<br />
November 30, 1989, to its governmental and business-type activities and to its proprietary funds provided<br />
they do not conflict with or contradict <strong>GASB</strong> pronouncements. The most significant of the School<br />
District’s accounting policies are described below.<br />
A. Basis of Presentation<br />
The School District’s basic financial statements consist of government-wide statements, including a<br />
statement of net assets and a statement of activities, and fund financial statements which provide a more<br />
detailed level of financial information.<br />
Government-wide Financial Statements The statement of net assets and the statement of activities<br />
display information about the School District as a whole. These statements include the financial activities<br />
of the primary government, except for fiduciary funds. The statements distinguish between those<br />
activities of the School District that are governmental (primarily supported by taxes and<br />
intergovernmental revenues) and those that are considered business-type activities (primarily supported<br />
by fees and charges).<br />
The statement of net assets presents the financial condition of the governmental and business-type<br />
activities of the School District at year-end. The statement of activities presents a comparison between<br />
direct expenses and program revenues for each program or function of the School District’s governmental<br />
activities and for the single business-type activity of the School District. Direct expenses are those that are<br />
specifically associated with a service, program or department and therefore clearly identifiable to a<br />
particular function. Program revenues include charges paid by the recipient of the goods or services<br />
offered by the program, grants and contributions that are restricted to meeting the operational or capital<br />
requirements of a particular program and interest earned on grants that is required to be used to support a<br />
particular program. Revenues which are not classified as program revenues are presented as general<br />
revenues of the School District. The comparison of direct expenses with program revenues identifies the<br />
extent to which each business segment or governmental function is self-financing or draws from the<br />
general revenues of the School District.<br />
Fund Financial Statements During the year, the School District segregates transactions related to certain<br />
School District functions or activities in separate funds in order to aid financial management and to<br />
demonstrate legal compliance. Fund financial statements are designed to present financial information of<br />
the School District at this more detailed level. The focus of governmental and enterprise fund financial<br />
statements is on major funds. Each major fund is presented in a separate column. Nonmajor funds are<br />
aggregated and presented in a single column. Fiduciary funds are reported by type.<br />
B. Fund Accounting<br />
The School District uses funds to maintain its financial records during the fiscal year. A fund is defined<br />
as a fiscal and accounting entity with a self-balancing set of accounts. There are three categories of<br />
funds: governmental, proprietary and fiduciary.<br />
Governmental Funds Governmental funds are those through which most governmental functions<br />
typically are financed. Governmental fund reporting focuses on the sources, uses and balances of current<br />
financial resources. Expendable assets are assigned to the various governmental funds according to the<br />
purposes for which they may or must be used. Current liabilities are assigned to the fund from which<br />
- 29 -
<strong>Joseph</strong> <strong>Badger</strong> <strong>Local</strong> School District<br />
Notes to the Basic Financial Statements<br />
For the Fiscal Year Ended June 30, <strong>2001</strong><br />
they will be paid. The difference between governmental fund assets and liabilities is reported as fund<br />
balance. The following are the School District’s major governmental funds:<br />
General Fund The general fund accounts for all financial resources except those required to be<br />
accounted for in another fund. The general fund balance is available to the School District for<br />
any purpose provided it is expended or transferred according to the general laws of Ohio.<br />
Debt Service Fund The debt service fund is used to account for the accumulation of property<br />
taxes for the payment of general long-term bond principal, interest and related costs for an<br />
addition to the School District’s high school.<br />
Permanent Improvement Capital Projects Fund The permanent improvement capital projects<br />
fund accumulates property tax revenues to be used for the acquisition, construction, or<br />
improvement of major capital facilities other than those financed by proprietary funds.<br />
The other governmental funds of the School District account for grants and other resources whose<br />
use is restricted to a particular purpose.<br />
Proprietary Funds Proprietary fund reporting focuses on the determination of operating income, changes<br />
in net assets, financial position and cash flows. Proprietary funds are classified as enterprise or internal<br />
service; the School District has no internal service funds.<br />
Enterprise Fund Enterprise funds may be used to account for any activity for which a fee is<br />
charged to external users for goods or services. The only enterprise fund of the School District<br />
accounts for the financial transactions related to the food service operations of the School<br />
District.<br />
Fiduciary Funds Fiduciary fund reporting focuses on net assets and changes in net assets. The fiduciary<br />
fund category is split into four classifications: pension trust funds, investment trust funds, private-purpose<br />
trust funds and agency funds. Trust funds are used to account for assets held by the School District under<br />
a trust agreement for individuals, private organizations, or other governments and are therefore not<br />
available to support the School District’s own programs. The School District’s only trust fund is a<br />
private purpose trust which accounts for a scholarship program for students. Agency funds are custodial<br />
in nature (assets equal liabilities) and do not involve measurement of results of operations. The School<br />
District’s agency fund accounts for student managed activities.<br />
C. Measurement Focus<br />
Government-wide Financial Statements The government-wide financial statements are prepared using<br />
the economic resources measurement focus. All assets and all liabilities associated with the operation of<br />
the School District are included on the statement of net assets.<br />
Fund Financial Statements All governmental funds are accounted for using a flow of current financial<br />
resources measurement focus. With this measurement focus, only current assets and current liabilities<br />
generally are included on the balance sheet. The statement of revenues, expenditures and changes in fund<br />
balances reports on the sources (i.e., revenues and other financing sources) and uses (i.e., expenditures<br />
and other financing uses) of current financial resources. This approach differs from the manner in which<br />
the governmental activities of the government-wide financial statements are prepared. Governmental<br />
fund financial statements therefore include reconciliation with brief explanations to better identify the<br />
relationship between the government-wide statements and the statements for governmental funds.<br />
- 30 -
<strong>Joseph</strong> <strong>Badger</strong> <strong>Local</strong> School District<br />
Notes to the Basic Financial Statements<br />
For the Fiscal Year Ended June 30, <strong>2001</strong><br />
Like the government-wide statements, the enterprise fund is accounted for on a flow of economic<br />
resources measurement focus. All assets and all liabilities associated with the operation of this fund are<br />
included on the statement of net assets. The statement of changes in fund net assets presents increases<br />
(i.e., revenues) and decreases (i.e., expenses) in net total assets. The statement of cash flows provides<br />
information about how the School District finances and meets the cash flow needs of its enterprise fund.<br />
The private purpose trust fund is reported using the economic resources measurement focus.<br />
D. Basis of Accounting<br />
Basis of accounting determines when transactions are recorded in the financial records and reported on<br />
the financial statements. Government-wide financial statements are prepared using the accrual basis of<br />
accounting. Governmental funds use the modified accrual basis of accounting. Proprietary and fiduciary<br />
funds also use the accrual basis of accounting. Differences in the accrual and modified accrual bases of<br />
accounting arise in the recognition of revenue, the recording of deferred revenue and in the presentation<br />
of expenses versus expenditures.<br />
Revenues - Exchange and Non-exchange Transactions Revenue resulting from exchange transactions,<br />
in which each party gives and receives essentially equal value, is recorded on the accrual basis when the<br />
exchange takes place. On a modified accrual basis, revenue is recorded in the fiscal year in which the<br />
resources are measurable and become available. Available means that the resources will be collected<br />
within the current fiscal year or are expected to be collected soon enough thereafter to be used to pay<br />
liabilities of the current fiscal year. For the School District, available means expected to be received<br />
within sixty days of fiscal year-end.<br />
Nonexchange transactions, in which the School District receives value without directly giving equal value<br />
in return, include property taxes, grants, entitlements and donations. On an accrual basis, revenue from<br />
property taxes is recognized in the fiscal year for which the taxes are levied. (See Note 6.) Revenue from<br />
grants, entitlements and donations is recognized in the fiscal year in which all eligibility requirements<br />
have been satisfied. Eligibility requirements include timing requirements, which specify the year when<br />
the resources are required to be used or the fiscal year when use is first permitted, matching requirements,<br />
in which the School District must provide local resources to be used for a specified purpose, and<br />
expenditure requirements, in which the resources are provided to the School District on a reimbursement<br />
basis. On a modified accrual basis, revenue from nonexchange transactions must also be available before<br />
it can be recognized.<br />
Under the modified accrual basis, the following revenue sources are considered to be both measurable and<br />
available at fiscal year-end: property taxes available as an advance, interest, tuition, grants, student fees<br />
and rentals.<br />
Deferred Revenue Deferred revenue arises when assets are recognized before revenue recognition<br />
criteria have been satisfied.<br />
Property taxes for which there is an enforceable legal claim as of June 30, <strong>2001</strong>, but which were levied to<br />
finance fiscal year 2002 operations, have been recorded as deferred revenue. Grants and entitlements<br />
received before the eligibility requirements are met are also recorded as deferred revenue.<br />
On governmental fund financial statements, receivables that will not be collected within the available<br />
period have also been reported as deferred revenue.<br />
- 31 -
<strong>Joseph</strong> <strong>Badger</strong> <strong>Local</strong> School District<br />
Notes to the Basic Financial Statements<br />
For the Fiscal Year Ended June 30, <strong>2001</strong><br />
Expenses/Expenditures On the accrual basis of accounting, expenses are recognized at the time they are<br />
incurred. The fair value of donated commodities used during the year is reported in the operating<br />
statement as an expense with a like amount reported as donated commodities revenue. Unused donated<br />
commodities are reported as deferred revenue.<br />
The measurement focus of governmental fund accounting is on decreases in net financial resources<br />
(expenditures) rather than expenses. Expenditures are generally recognized in the accounting period in<br />
which the related fund liability is incurred, if measurable. Allocations of cost, such as depreciation and<br />
amortization, are not recognized in governmental funds.<br />
D. Cash and Cash Equivalents<br />
Cash received by the School District is pooled for investment purposes. Monies for all funds, including<br />
proprietary funds, are maintained in this pool. Individual fund integrity is maintained through the School<br />
District’s records. Each fund’s interest in the pool is presented as "equity in pooled cash and cash<br />
equivalents" on the financial statements. During fiscal year <strong>2001</strong>, investments were limited to nonnegotiable<br />
Certificates of Deposit, which are reported at cost, and the State Treasury Asset Reserve of<br />
Ohio (STAR Ohio). STAR Ohio is an investment pool managed by the State Treasurer’s Office, which<br />
allows governments within the State to pool their funds for investment purposes. STAR Ohio is not<br />
registered with the SEC as an investment company but does operate in a manner consistent with Rule2a7<br />
of the Investment Company Act of 1940. Investments in STAR Ohio are valued at STAR Ohio’s share<br />
price, which is the price the investment could be sold for on June 30, <strong>2001</strong>.<br />
Following Ohio statutes, the Board of Education has, by resolution, specified the funds to receive an<br />
allocation of interest earnings. Interest revenue credited to the general fund during fiscal year <strong>2001</strong><br />
amounted to $157,845 includes $11,432 assigned from other School District funds.<br />
For presentation on the financial statements, investments of the cash management pool and investments<br />
with an original maturity of three months or less at the time they are purchased by the School District are<br />
considered to be cash equivalents. Investments with an initial maturity of more than three months that are<br />
not purchased from the pool are reported as investments.<br />
E. Restricted Assets<br />
Assets are reported as restricted when restrictions on their use change the normal understanding of the<br />
availability of the asset. Such constraints are either imposed by creditors, contributors, grantors, or laws<br />
of other governments or imposed by enabling legislation. Restricted assets in the general fund represent<br />
cash and cash equivalents required by statute to be set-aside by the School District for the acquisition or<br />
construction of capital assets and the creation of a reserve for budget stabilization. See Note 19 for<br />
additional information regarding set-asides.<br />
F. Inventory<br />
On government-wide financial statements, inventories are presented at the lower of cost or market on a<br />
first-in, first-out basis and are expensed when used.<br />
On fund financial statements, inventories of governmental funds are stated at cost while inventories of<br />
proprietary funds are stated at the lower of cost or market. For all funds, cost is determined on a first-in,<br />
first-out basis. Inventory in governmental funds consists of expendable supplies held for consumption.<br />
- 32 -
<strong>Joseph</strong> <strong>Badger</strong> <strong>Local</strong> School District<br />
Notes to the Basic Financial Statements<br />
For the Fiscal Year Ended June 30, <strong>2001</strong><br />
The cost of inventory items is recorded as an expenditure in the governmental fund types when<br />
purchased. Inventories of proprietary funds consist of donated food, purchased food, and school supplies<br />
held for resale and are expensed when used.<br />
G. Capital Assets<br />
General capital assets are those assets not specifically related to activities reported in the proprietary<br />
funds. These assets generally result from expenditures in the governmental funds. These assets are<br />
reported in the governmental activities column of the government-wide statement of net assets but are not<br />
reported in the fund financial statements. Capital assets utilized by the enterprise fund are reported both<br />
in the business-type activities column of the government-wide statement of net assets and in the fund.<br />
All capital assets are capitalized at cost (or estimated historical cost) and updated for additions and<br />
retirements during the year. Donated fixed assets are recorded at their fair market values as of the date<br />
received. The School District maintains a capitalization threshold of five hundred dollars. The School<br />
District does not possess any infrastructure. Improvements are capitalized; the costs of normal<br />
maintenance and repairs that do not add to the value of the asset or materially extend an asset’s life are<br />
not. Interest incurred during the construction of capital assets utilized by the enterprise fund is also<br />
capitalized.<br />
All reported capital assets except land are depreciated. Improvements are depreciated over the remaining<br />
useful lives of the related capital assets. Depreciation is computed using the straight-line method over the<br />
following useful lives:<br />
Governmental Business-Type<br />
Activities<br />
Activities<br />
Description Estimated Lives Estimated Lives<br />
Land N/A N/A<br />
Land Improvements 50 years N/A<br />
Buildings and Improvements 50 years N/A<br />
Furniture and Equipment 8-20 years 8-20 years<br />
Vehicles 10 years N/A<br />
Textbooks 5 years N/A<br />
H. Interfund Balances<br />
On fund financial statements, receivables and payables resulting from short-term interfund loans are<br />
classified as "interfund receivables/payables." These amounts are eliminated in the governmental and<br />
business-type activities columns of the statement of net assets, except for the net residual amounts due<br />
between governmental and business-type activities, which are presented as internal balances.<br />
I. Compensated Absences<br />
The School District reports compensated absences in accordance with the provisions of <strong>GASB</strong> Statement<br />
No. 16, "Accounting for Compensated Absences." Vacation benefits are accrued as a liability as the<br />
benefits are earned if the employees’ rights to receive compensation are attributable to services already<br />
rendered and it is probable that the School District will compensate the employees for the benefits<br />
through paid time off or some other means. The School District records a liability for accumulated<br />
unused vacation time when earned for all employees with more than one year of service.<br />
- 33 -
<strong>Joseph</strong> <strong>Badger</strong> <strong>Local</strong> School District<br />
Notes to the Basic Financial Statements<br />
For the Fiscal Year Ended June 30, <strong>2001</strong><br />
Sick leave benefits are accrued as a liability using the vesting method. The liability includes the<br />
employees who are currently eligible to receive termination benefits and those that the School District has<br />
identified as probable of receiving payment in the future. The amount is based on accumulated sick leave<br />
and employee wage rates at fiscal year end taking into consideration any limits specified in the School<br />
District’s termination policy.<br />
The entire compensated absence liability is reported on the government-wide financial statements.<br />
For governmental funds, the current portion of unpaid compensated absences is the amount that is<br />
normally expected to be paid using expendable available financial resources. These amounts are recorded<br />
in the account “compensated absences payable” in the fund from which the employees who have<br />
accumulated leave are paid. The noncurrent portion of the liability is not reported. In proprietary funds,<br />
the entire amount of compensated absences is reported as a fund liability.<br />
J. Accrued Liabilities and Long-term Obligations<br />
All payables, accrued liabilities and long-term obligations are reported in the government-wide financial<br />
statements, and all payables, accrued liabilities and long-term obligations payable from the enterprise<br />
fund are reported on the enterprise fund financial statements.<br />
In general, governmental fund payables and accrued liabilities that, once incurred, are paid in a timely<br />
manner and in full from current financial resources, are reported as obligations of the funds. However,<br />
claims and judgements, compensated absences, special termination benefits and contractually required<br />
pension contributions that will be paid from governmental funds are reported as a liability in the fund<br />
financial statements only to the extent that they are due for payment during the current year. Bonds,<br />
capital leases and long term loans are recognized as a liability on the fund financial statements when due.<br />
K. Fund Balance Reserves<br />
The School District reserves those portions of fund equity which are legally segregated for a specific<br />
future use or which do not represent available expendable resources and therefore are not available for<br />
appropriation or expenditure. Unreserved fund balance indicates that portion of fund equity which is<br />
available for appropriation in future periods. Fund equity reserves have been established for<br />
encumbrances, inventories of supplies and materials, property taxes, unclaimed monies, and budget<br />
stabilization.<br />
The reserve for property taxes represents taxes recognized as revenue under generally accepted<br />
accounting principles but not available for appropriation under State statute. The reserve for unclaimed<br />
monies represents cash that, under Ohio law, must remain unclaimed for five years before it becomes<br />
available for appropriation. The reserve for budget stabilization represents money required to be set-aside<br />
by statute to protect against cyclical changes in revenues and expenditures.<br />
L. Net Assets<br />
Net assets represent the difference between assets and liabilities. Net assets invested in capital assets, net<br />
of related debt consists of capital assets, net of accumulated depreciation, reduced by the outstanding<br />
balances of any borrowings used for the acquisition, construction or improvement of those assets. The<br />
School District has no related debt outstanding as of June 30, <strong>2001</strong>. Net assets are reported as restricted<br />
when there are limitations imposed on their use either through the enabling legislation adopted by the<br />
School District or through external restrictions imposed by creditors, grantors or laws or regulations of<br />
other governments.<br />
- 34 -
<strong>Joseph</strong> <strong>Badger</strong> <strong>Local</strong> School District<br />
Notes to the Basic Financial Statements<br />
For the Fiscal Year Ended June 30, <strong>2001</strong><br />
The School District applies restricted resources when an expense is incurred for purposes for which both<br />
restricted and unrestricted net assets are available.<br />
M. Operating Revenues and Expenses<br />
Operating revenues are those revenues that are generated directly from the primary activity of the<br />
proprietary funds. For the School District, these revenues are sales for food service. Operating expenses<br />
are necessary costs incurred to provide the good or service that is the primary activity of the fund.<br />
N. Contributions of Capital<br />
Contributions of capital in proprietary fund financial statements arise from outside contributions of fixed<br />
assets, or from grants or outside contributions of resources restricted to capital acquisition and<br />
construction.<br />
O. Interfund Activity<br />
Transfers between governmental and business-type activities on the government-wide statements are<br />
reported in the same manner as general revenues.<br />
Exchange transactions between funds are reported as revenues in the seller funds and as<br />
expenditures/expenses in the purchaser funds. Flows of cash or goods from one fund to another without a<br />
requirement for repayment are reported as interfund transfers. Interfund transfers are reported as other<br />
financing sources/uses in governmental funds and after nonoperating revenues/expenses in proprietary<br />
funds. Repayments from funds responsible for particular expenditures/expenses to the funds that initially<br />
paid for them are not presented on the financial statements.<br />
P. Extraordinary and Special Items<br />
Extraordinary items are transactions or events that are both unusual in nature and infrequent in<br />
occurrence. Special items are transactions or events that are within the control of the Board of Education<br />
and that are either unusual in nature or infrequent in occurrence. Neither type of transaction occurred<br />
during fiscal year <strong>2001</strong>.<br />
Q. Estimates<br />
The preparation of the financial statements in conformity with generally accepted accounting principles<br />
requires management to make estimates and assumptions that affect the amounts reported in the financial<br />
statements and accompanying notes. Actual results may differ from those estimates.<br />
R. Budgetary Data<br />
The budgetary process is prescribed by provisions of the Ohio Revised Code and entails the preparation<br />
of budgetary documents within an established timetable. The major documents prepared are the tax<br />
budget, the certificate of estimated resources, and the appropriation resolution, all of which are prepared<br />
on the budgetary basis of accounting. The certificate of estimated resources and the appropriation<br />
resolution are subject to amendment throughout the year with the legal restriction that appropriations<br />
cannot exceed estimated resources, as certified. All funds, other than agency funds, are legally required<br />
to be budgeted and appropriated. The legal level of budgetary control has been established by the Board<br />
of Education at the object level within each fund and function. Any budgetary modifications at this level<br />
may only be made by resolution of the Board of Education. At year end, expenditures plus encumbrances<br />
- 35 -
<strong>Joseph</strong> <strong>Badger</strong> <strong>Local</strong> School District<br />
Notes to the Basic Financial Statements<br />
For the Fiscal Year Ended June 30, <strong>2001</strong><br />
may not exceed appropriations at any level of control.<br />
All funds, other than agency funds, are legally required to be budgeted and appropriated. The major<br />
documents prepared are the tax budget, the appropriation resolution and the certificate of estimated<br />
resources, which are prepared on the budgetary basis of accounting. The tax budget demonstrates a need<br />
for existing or increased tax rates. The certificate of estimated resources establishes a time limit on the<br />
amounts that the Board of Education may appropriate. The appropriation resolution is the Board’s<br />
authorization to spend resources and sets annual limits on expenditures plus encumbrances at a level of<br />
control selected by the Board. The legal level of control has been established by the Board of Education<br />
at the object level within each fund and function.<br />
The certificate of estimated resources may be amended during the year if projected increases or decreases<br />
in revenue are identified by the School District Treasurer. The amounts reported as the original budgeted<br />
amounts in the budgetary statements reflect the amounts in the certificate when the original appropriations<br />
were adopted. The amounts reported as the final budgeted amounts in the budgetary statements reflect<br />
the amounts in the final amended certificated issued during fiscal year <strong>2001</strong>.<br />
The appropriation resolution is subject to amendment by the Board throughout the year with the<br />
restriction that appropriations may not exceed estimated revenues. The amounts reported as the original<br />
budgeted amounts reflect the first appropriation for that fund that covered the entire fiscal year, including<br />
amounts automatically carried over from prior years. The amounts reported as the final budgeted<br />
amounts represent the final appropriation amounts passed by the Board during the year. Prior to fiscal<br />
year-end, the School District passed an amended appropriation resolution, which matched appropriations<br />
to expenditures plus encumbrances in the majority of categories.<br />
Note 3 – Changes in Accounting Principles<br />
Changes in Accounting Principles For fiscal year <strong>2001</strong>, the School District has implemented <strong>GASB</strong><br />
Statement No. 36, “Receipt Reporting for Certain Shared Nonexchange Revenues”, <strong>GASB</strong> Statement No.<br />
37, “Basic Financial Statements for State and <strong>Local</strong> Governments: Omnibus” and <strong>GASB</strong> Statement No.<br />
38, “Certain Financial Statement Note Disclosures”. At June 30, 2000, there was no effect on fund<br />
balance as a result of implementing <strong>GASB</strong> Statements 36, 37 and 38.<br />
Note 4 - Budgetary Basis of Accounting<br />
While the School District is reporting financial position, results of operations and changes in fund balance<br />
on the basis of generally accepted accounting principles (GAAP), the budgetary basis as provided by law<br />
is based upon accounting for certain transactions on a basis of cash receipts, disbursements and<br />
encumbrances. The Statement of Revenues, Expenditures and Changes in Fund Balance - Budget (Non-<br />
GAAP Basis) and Actual presented for the general fund is presented on the budgetary basis to provide a<br />
meaningful comparison of actual results with the budget. The major differences between the budget basis<br />
and GAAP basis are as follows:<br />
1. Revenues are recorded when received in cash (budget) as opposed to when<br />
susceptible to accrual (GAAP).<br />
2. Expenditures are recorded when paid in cash (budget) as opposed to when the<br />
fund liability is incurred (GAAP).<br />
- 36 -
<strong>Joseph</strong> <strong>Badger</strong> <strong>Local</strong> School District<br />
Notes to the Basic Financial Statements<br />
For the Fiscal Year Ended June 30, <strong>2001</strong><br />
3. Encumbrances are treated as expenditures (budget) rather than as a reservation of<br />
fund balance (GAAP).<br />
The following table summarizes the adjustments necessary to reconcile the GAAP basis statements to the<br />
budgetary basis statements for the general fund.<br />
Net Change in Fund Balance<br />
General Fund<br />
GAAP Basis $25,835<br />
Net Adjustment for<br />
Revenue Accruals (2,314)<br />
Net Adjustment for<br />
Expenditure Accrual 38,105<br />
Adjustment for<br />
Encumbrances (220,312)<br />
Budget Basis ($158,686)<br />
Note 5 - Deposits and Investments<br />
State statutes classify monies held by the School District into three categories.<br />
Active deposits are public deposits necessary to meet current demands on the treasury. Such monies must<br />
be maintained either as cash in the School District Treasury, in commercial accounts payable or<br />
withdrawable on demand, including negotiable order of withdrawal (NOW) accounts, or in money market<br />
deposit accounts.<br />
Inactive monies are public deposits that the Board of Education has identified as not required for use<br />
within the current two year period of designation of depositories. Inactive deposits must either be<br />
evidenced by certificates of deposit maturing not later than the end of the current period of designation of<br />
depositories, or by savings or deposit accounts including, but not limited to, passbook accounts.<br />
Interim deposits are deposits of interim monies. Interim monies are those monies which are not needed<br />
for immediate use but which will be needed before the end of the current period of designation of<br />
depositories. Interim monies must be evidenced by time certificates of deposit maturing not more than<br />
one year from the date of deposit or by savings or deposit accounts including passbook accounts.<br />
Protection of the School District’s deposits is provided by the Federal Deposit Insurance Corporation<br />
(FDIC), by eligible securities pledged by the financial institution as security for repayment, by surety<br />
company bonds deposited with the treasurer by the financial institution or by a single collateral pool<br />
established by the financial institution to secure the repayment of all public monies deposited with the<br />
institution.<br />
- 37 -
<strong>Joseph</strong> <strong>Badger</strong> <strong>Local</strong> School District<br />
Notes to the Basic Financial Statements<br />
For the Fiscal Year Ended June 30, <strong>2001</strong><br />
Interim monies are to be deposited or invested in the following securities:<br />
1. United States treasury notes, bills, bonds, or any other obligation or security issued by the<br />
United States treasury or any other obligation guaranteed as to principal and interest by<br />
the United States;<br />
2. Bonds, notes, debentures, or any other obligations or securities issued by any federal<br />
government agency or instrumentality, including but not limited to, the federal national<br />
mortgage association, federal home loan bank, federal farm credit bank, federal home<br />
loan mortgage corporation, government national mortgage association, and student loan<br />
marketing association. All federal agency securities shall be direct issuances of federal<br />
government agencies or instrumentalities;<br />
3. Written repurchase agreements in the securities listed above provided that the market<br />
value of the securities subject to the repurchase agreement must exceed the principal<br />
value of the agreement by at least two percent and be marked to market daily, and that the<br />
term of the agreement must not exceed thirty days;<br />
4. Bonds and other obligations of the State of Ohio;<br />
5. No-load money market mutual funds consisting exclusively of obligations described in<br />
division (1) or (2) of this section and repurchase agreements secured by such obligations,<br />
provided that investments in securities described in this division are made only through<br />
eligible institutions;<br />
6. The State Treasurer's investment pool (STAR Ohio);<br />
7. Certain bankers' acceptances and commercial paper notes for a period not to exceed one<br />
hundred eighty days from the purchase date in an amount not to exceed twenty-five<br />
percent of the interim monies available for investment at any one time; and,<br />
8. Under limited circumstances, corporate debt interests rated in either of the two highest<br />
rating classifications by at least two nationally recognized rating agencies.<br />
Investments in stripped principal or interest obligations, reverse repurchase agreements and derivatives<br />
are prohibited. The issuance of taxable notes for the purpose of arbitrage, the use of leverage and short<br />
selling are also prohibited. An investment must mature within five years from the date of purchase unless<br />
matched to a specific obligation or debt of the School District, and must be purchased with the<br />
expectation it will be held to maturity. Investments may only be made through specified dealers and<br />
institutions. Payment for investments may be made only upon delivery of the securities representing the<br />
investments to the treasurer or, if the securities are not represented by a certificate, upon receipt of<br />
confirmation of transfer from the custodian.<br />
The following information classifies deposits and investments by categories of risk as defined in <strong>GASB</strong><br />
Statement 3, “Deposits with Financial Institutions, Investments and Reverse Repurchase Agreements”.<br />
Deposits At year-end, the carrying amount of the School District's deposits was $53,552 and the bank<br />
balance was $206,857. $100,000 of the bank balance was covered by federal depository insurance and<br />
$106,857 was uninsured and uncollateralized. Although all state statutory requirements for the deposit of<br />
money had been followed, noncompliance with federal requirements could potentially subject the School<br />
District to a successful claim by the Federal Deposit Insurance Corporation.<br />
- 38 -
<strong>Joseph</strong> <strong>Badger</strong> <strong>Local</strong> School District<br />
Notes to the Basic Financial Statements<br />
For the Fiscal Year Ended June 30, <strong>2001</strong><br />
Investments The School District’s investments are required to be categorized to give an indication of the<br />
level of risk assumed by the School District at year end. Category 1 includes investments that are insured<br />
or registered or for which the securities are held by the School District or its agent in the School District’s<br />
name. Category 2 includes uninsured and unregistered investments for which securities are held by the<br />
counterparty’s trust department or an agent in the School District’s name. Category 3 includes uninsured<br />
and unregistered investments for which the securities are held by the counterparty, or by its trust<br />
department or agent but not in the School District’s name. Investments in STAR Ohio are unclassified<br />
investments since they are not evidenced by securities that exist in physical or book entry form.<br />
Fair<br />
Value<br />
Investment in State<br />
Treasurer’s Investment Pool $2,486,421<br />
The classification of cash and cash equivalents, and investments on the basic financial statements is based<br />
on criteria set forth in <strong>GASB</strong> Statement No. 9. A reconciliation between the classifications of cash and<br />
investments on the basic financial statements and the classification per <strong>GASB</strong> Statement No. 3 is as<br />
follows:<br />
Cash and Cash<br />
Equivalents/<br />
Deposits<br />
Investments<br />
<strong>GASB</strong> Statement 9 $2,539,973 $0<br />
Investments which are part of<br />
a cash management pool:<br />
Investment in State Treasurer’s<br />
Investment Pool (2,486,421) 2,486,421<br />
<strong>GASB</strong> Statement 3 $53,552 $2,486,421<br />
Note 6- Property Taxes<br />
Property taxes are levied and assessed on a calendar year basis while the school district fiscal year runs<br />
from July through June. First half tax collections are received by the school district in the second half of<br />
the fiscal year. Second half tax distributions occur in the first half of the following fiscal year. Property<br />
taxes include amounts levied against all real, public utility and tangible personal property located in the<br />
School District. Property tax revenue received during calendar <strong>2001</strong> for real and public utility property<br />
taxes represents collections of calendar 2000 taxes. Property tax payments received during calendar <strong>2001</strong><br />
for tangible personal property (other than public utility property) is for calendar <strong>2001</strong> taxes.<br />
<strong>2001</strong> real property taxes are levied after April 1, <strong>2001</strong>, on the assessed value as of January 1, <strong>2001</strong>, the<br />
lien date. Assessed values are established by State law at thirty-five percent of appraised market value.<br />
Public utility tangible personal property currently is assessed at varying percentages of true value; public<br />
utility real property is assessed at thirty-five percent of true value. <strong>2001</strong> public utility property taxes<br />
became a lien December 31, 2000, are levied after April 1, <strong>2001</strong> and are collected in 2002 with real<br />
property taxes. <strong>2001</strong> tangible personal property taxes are levied after April 1, 2000, on the value as of<br />
December 31, 2000. Collections are made in <strong>2001</strong>. Tangible personal property assessments are twentyfive<br />
percent of true value.<br />
- 39 -
<strong>Joseph</strong> <strong>Badger</strong> <strong>Local</strong> School District<br />
Notes to the Basic Financial Statements<br />
For the Fiscal Year Ended June 30, <strong>2001</strong><br />
The assessed values upon which the fiscal year <strong>2001</strong> taxes were collected are:<br />
2000 Second-<br />
Half Collections<br />
<strong>2001</strong> First-<br />
Half Collections<br />
Amount Percent Amount Percent<br />
Agricultural /Residential<br />
and Other Real Estate $76,319,190 85.03% $77,973,410 85.13%<br />
Public Utility Personal 6,930,500 7.72 5,726,310 6.25<br />
Tangible Personal<br />
Property 6,509,919 7.25 7,890,532 8.62<br />
Total $89,759,609 100.00% $91,590,252 100.00%<br />
Tax rate per $1,000 of<br />
assessed valuation $38.41 $38.40<br />
Real property taxes are payable annually or semiannually. If paid annually, payment is due December 31;<br />
if paid semiannually, the first payment is due December 31 with the remainder payable by June 20.<br />
Under certain circumstances, State statute permits later payment dates to be established.<br />
Tangible personal property taxes paid by multi-county taxpayers are due September 20. Single county<br />
taxpayers may pay annually or semiannually. If paid annually, payment is due April 30; if paid<br />
semiannually, the first payment is due April 30, with the remainder payable by September 20. Tangible<br />
personal property taxes paid by April 30 are usually received by the School District prior to June 30.<br />
The School District receives property taxes from Trumbull County. The County Auditor periodically<br />
advances to the School District its portion of the taxes collected. Second-half real property tax payments<br />
collected by the county by June 30, <strong>2001</strong>, are available to finance fiscal year <strong>2001</strong> operations. The<br />
amount available to be advanced can vary based on the date the tax bills are sent.<br />
Accrued property taxes receivable represent delinquent taxes outstanding, the late settlement of personal<br />
property taxes and real property, personal property and public utility taxes which are measurable as of<br />
June 30, <strong>2001</strong> and for which there is an enforceable legal claim. Although total property tax collections<br />
for the next fiscal year are measurable, only the delayed settlement of personal property tax and the<br />
amount of real property taxes available as an advance at June 30 were levied to finance current fiscal year<br />
operations. The receivable is therefore offset by a credit to deferred revenue for that portion not levied to<br />
finance current year operations. The amount available as an advance at June 30 is recognized as revenue.<br />
At June 30, <strong>2001</strong>, $16,235 was available as an advance to the general fund and $350 was available to the<br />
permanent improvement capital projects fund.<br />
Note 7 - Receivables<br />
Receivables at June 30, <strong>2001</strong>, consisted of taxes, accounts (rent and student fees), intergovernmental<br />
grants and interest. All receivables are considered collectible in full due to the ability to foreclose for the<br />
nonpayment of taxes, the stable condition of State programs, and the current year guarantee of federal<br />
funds.<br />
- 40 -
<strong>Joseph</strong> <strong>Badger</strong> <strong>Local</strong> School District<br />
Notes to the Basic Financial Statements<br />
For the Fiscal Year Ended June 30, <strong>2001</strong><br />
The general fund had intergovernmental receivables in the amount of $138 for township reimbursement.<br />
Note 8 - Capital Assets<br />
Capital asset activity for the fiscal year ended June 30, <strong>2001</strong>, was as follows:<br />
Balance<br />
Balance<br />
6/30/00 Additions Deductions 6/30/01<br />
Governmental Activities<br />
Capital Assets not being depreciated:<br />
Land $119,500 $0 $0 $119,500<br />
Capital Assets being depreciated:<br />
Land Improvements 121,856 0 0 121,856<br />
Buildings and Improvements 1,929,948 284,991 0 2,214,939<br />
Furniture and Equipment 1,340,408 214,323 (17,109) 1,537,622<br />
Vehicles 988,310 5,500 0 993,810<br />
Textbooks 255,295 86,396 0 341,691<br />
Construction in Progress 20,994 284,991 (305,985) 0<br />
Total Capital Assets being depreciated 4,656,811 876,201 (323,094) 5,209,918<br />
Less Accumulated Depreciation:<br />
Land Improvements (61,786) (3,700) 0 (65,486)<br />
Buildings and Improvements (1,424,506) (31,816) 0 (1,456,322)<br />
Furniture and Equipment (726,182) (67,412) 17,109 (776,485)<br />
Vehicles (482,820) (78,614) 0 (561,434)<br />
Textbooks (132,853) (32,693) 0 (165,546)<br />
Total Accumulated Depreciation (2,828,147) (214,235) * 17,109 (3,025,273)<br />
Total Capital Assets being depreciated 1,828,664 661,966 (305,985) 2,184,645<br />
Governmental Activities Capital<br />
Assets, Net $1,948,164 $661,966 ($305,985) $2,304,145<br />
Business-Type Activities<br />
Furniture and Equipment $149,449 $4,313 $0 $153,762<br />
Less Accumulated Depreciation (112,950) (3,224) 0 (116,174)<br />
Business-Type Activities<br />
Capital Assets, Net $36,499 $1,089 $0 $37,588<br />
- 41 -
<strong>Joseph</strong> <strong>Badger</strong> <strong>Local</strong> School District<br />
Notes to the Basic Financial Statements<br />
For the Fiscal Year Ended June 30, <strong>2001</strong><br />
* Depreciation expense was charged to governmental functions as follows:<br />
Instruction:<br />
Regular $82,642<br />
Special 2,387<br />
Support Services:<br />
Pupil 259<br />
Instructional Staff 7,246<br />
Administration 2,192<br />
Fiscal 1,258<br />
Operation and Maintenance of Plant 37,272<br />
Pupil Transportation 78,614<br />
Operation of Non-Instructional Services 1,480<br />
Extracurricular Activities 885<br />
Total Depreciation Expense $214,235<br />
Note 9 - Risk Management<br />
A. Property and Liability<br />
The School District is exposed to various risks of loss related to torts; theft of, damage to, and destruction<br />
of assets; errors and omissions; injuries to employees and natural disasters. During fiscal year <strong>2001</strong>, the<br />
School District contracted with Nationwide Insurance for property and fleet insurance, liability insurance<br />
and inland marine coverage. Coverage provided by Nationwide Insurance is as follows:<br />
Building and Contents - Replacement Cost ($1,000 deductible) $15,196,400<br />
Inland Marine Coverage<br />
Musical ($100 deductible) 101,977<br />
Video ($100 deductible) 160,755<br />
EDP ($100 deductible) 17,500<br />
Boiler and Machinery ($1,000 deductible) 7,084,200<br />
Crime Insurance (no deductible) 1,000<br />
Automobile Liability (no deductible) 2,000,000<br />
Uninsured Motorists (no deductible) 2,000,000<br />
General Liability<br />
Per Occurrence 1,000,000<br />
Total Per Year 5,000,000<br />
Settled claims have not exceeded this commercial coverage in any of the past three years. There has not<br />
been a significant reduction in coverage from the prior year.<br />
B. Workers’ Compensation<br />
For fiscal year <strong>2001</strong>, the School District participated in the Ohio School Board Association Workers’<br />
Compensation Group Rating Program (GRP), an insurance purchasing pool. The intent of the GRP is to<br />
achieve the benefit of a reduced premium for the School District by virtue of its grouping and<br />
- 42 -
<strong>Joseph</strong> <strong>Badger</strong> <strong>Local</strong> School District<br />
Notes to the Basic Financial Statements<br />
For the Fiscal Year Ended June 30, <strong>2001</strong><br />
representation with other participants in the GRP. The workers’ compensation experience of the<br />
participating school districts is calculated as one experience and a common premium rate is applied to all<br />
school districts in the GRP. Each participant pays its workers’ compensation premium to the State based<br />
on the rate for the GRP rather than its individual rate. Total savings are then calculated and each<br />
participant’s individual performance is compared to the overall savings percentage of the GRP. A<br />
participant will then either receive money from or be required to contribute to the “equity pooling fund.”<br />
This “equity pooling” arrangement insures that each participant shares equally in the overall performance<br />
of the GRP. Participation in the GRP is limited to school districts that can meet the GRP’s selection<br />
criteria. The firm of Gates McDonald & Company provides administrative, cost control and actuarial<br />
services to the GRP.<br />
C. Employee Medical Benefits<br />
The School District has contracted with the Trumbull County <strong>Schools</strong> Employee Insurance Benefits<br />
Consortium to provide employee medical/surgical benefits. The Trumbull County <strong>Schools</strong> Employee<br />
Insurance Benefits Consortium is a shared risk pool comprised of sixteen Trumbull County school<br />
districts. Rates are set through an annual calculation process. The School District pays a monthly<br />
contribution, which is placed in a common fund from which claim payments are made for all participating<br />
school districts. Claims are paid for all participants regardless of claims flow. The board of directors has<br />
a right to return monies to a district subsequent to the settlement of all expenses and claims if a district<br />
withdraws from the pool.<br />
Note 10 - Defined Benefit Pension Plans<br />
A. School Employees Retirement System<br />
The School District contributes to the School Employees Retirement System (SERS), a cost-sharing<br />
multiple employer defined benefit pension plan. SERS provides retirement and disability benefits, annual<br />
cost-of-living adjustments, and death benefits to plan members and beneficiaries. Authority to establish<br />
and amend benefits is provided by State statute per Chapter 3309 of the Ohio Revised Code. SERS issues<br />
a publicly available, stand-alone financial report that includes financial statements and required<br />
supplementary information. That report may be obtained by writing to the School Employees Retirement<br />
System, 45 N. Fourth Street, Columbus, Ohio 43215-3634.<br />
Plan members are required to contribute 9 percent of their annual covered salary and the School District is<br />
required to contribute at an actuarially determined rate. The current School District rate is 14 percent of<br />
annual covered payroll. A portion of the School District’s contribution is used to fund pension<br />
obligations with the remainder being used to fund health care benefits; for fiscal year <strong>2001</strong>, 4.2 percent of<br />
annual covered salary was the portion used to fund pension obligations. For fiscal year 2000, 5.5 percent<br />
was used to fund pension obligations. The contribution requirements of plan members and employers are<br />
established and may be amended, up to a statutory maximum amount, by the SERS’ Retirement Board.<br />
The School District’s required contributions for pension obligations to SERS for the fiscal years ended<br />
June 30, <strong>2001</strong>, 2000, and 1999 were $33,212, $49,747 and $46,598, respectively; 39.05 percent has been<br />
contributed for fiscal year <strong>2001</strong> and 100 percent for fiscal years 2000 and 1999. $20,244, represents the<br />
unpaid contribution for fiscal year <strong>2001</strong>.<br />
B. State Teachers Retirement System<br />
The School District contributes to the State Teachers Retirement System of Ohio (STRS), a cost-sharing<br />
- 43 -
<strong>Joseph</strong> <strong>Badger</strong> <strong>Local</strong> School District<br />
Notes to the Basic Financial Statements<br />
For the Fiscal Year Ended June 30, <strong>2001</strong><br />
multiple employer public employee retirement system. STRS provides basic retirement and disability<br />
benefits, annual cost-of-living adjustments, and death and survivor benefits to members and beneficiaries.<br />
Benefits are established by Chapter 3307 of the Ohio Revised Code. STRS issues a publicly available,<br />
stand-alone financial report that includes financial statements and required supplementary information for<br />
STRS. That report may be obtained by writing to the State Teachers Retirement System, 275 East Broad<br />
Street, Columbus, Ohio 43215-3371.<br />
For the fiscal year ended June 30, <strong>2001</strong>, plan members were required to contribute 9.3 percent of their<br />
annual covered salaries. The School District was required to contribute 14 percent; 9.5 percent was the<br />
portion used to fund pension obligations. For fiscal year 2000, the portion used to fund pension<br />
obligations was 6.0 percent. Contribution rates are established by STRS, upon recommendations of its<br />
consulting actuary, not to exceed statutory maximum rates of 10 percent for members and 14 percent for<br />
employers. The School District’s required contributions for pension obligations to STRS for the fiscal<br />
years ended June 30, <strong>2001</strong>, 2000, and 1999 were $316,215, $196,908 and $180,295, respectively; 73.25<br />
percent has been contributed for fiscal year <strong>2001</strong> and 100 percent for fiscal years 2000 and 1999. $84,604<br />
represents the unpaid contribution for fiscal year <strong>2001</strong>.<br />
C. Social Security System<br />
Effective July 1, 1991, all employees not otherwise covered by the School Employees Retirement System<br />
or the State Teachers Retirement System have an option to choose Social Security or the School<br />
Employees Retirement System/State Teachers Retirement System. As of June 30, <strong>2001</strong>, three of the<br />
members of the Board of Education have elected Social Security. The Board’s liability is 6.2 percent of<br />
wages paid.<br />
Note 11 - Postemployment Benefits<br />
The School District provides comprehensive health care benefits to retired teachers and their dependents<br />
through the State Teachers Retirement System (STRS), and to retired non-certified employees and their<br />
dependents through the School Employees Retirement System (SERS). Benefits include hospitalization,<br />
physicians' fees, prescription drugs and reimbursement of monthly Medicare premiums. Benefit<br />
provisions and the obligations to contribute are established by the Systems based on authority granted by<br />
State statute. Both systems are on a pay-as-you-go basis.<br />
All STRS benefit recipients and sponsored dependents are eligible for health care coverage. The STRS<br />
Board has statutory authority over how much, if any, of the health care costs will be absorbed by STRS.<br />
Most benefit recipients pay a portion of the health care cost in the form of a monthly premium. By law,<br />
the cost of coverage paid from STRS funds is included in the employer contribution rate, currently 14<br />
percent of covered payroll. For the fiscal year ended June 30, <strong>2001</strong>, the STRS Board allocated employer<br />
contributions equal to 4.5 percent of covered payroll to the Health Care Reserve Fund. For the School<br />
District, this amount equaled $149,786 for fiscal year <strong>2001</strong>.<br />
STRS pays health care benefits from the Health Care Reserve Fund. At June 30, 2000, (the latest<br />
information available) the balance in the Fund was $3.419 billion. For the year ended June 30, 2000, net<br />
health care costs paid by STRS were $283,137,000 and STRS had 99,011 eligible benefit recipients.<br />
For SERS, coverage is made available to service retirees with ten or more fiscal years of qualifying<br />
service credit, and to disability and survivor benefit recipients. Members retiring on or after August 1,<br />
1989, with less than twenty-five years of service credit must pay a portion of their premium for health<br />
- 44 -
<strong>Joseph</strong> <strong>Badger</strong> <strong>Local</strong> School District<br />
Notes to the Basic Financial Statements<br />
For the Fiscal Year Ended June 30, <strong>2001</strong><br />
care. The portion is based on years of service up to a maximum of 75 percent of the premium.<br />
After the allocation for basic benefits, the remainder of the employer’s 14 percent contribution is<br />
allocated to providing health care benefits. For the fiscal year ended June 30, <strong>2001</strong>, employer<br />
contributions to fund health care benefits were 9.8 percent of covered payroll, an increase of 1.3 percent<br />
from fiscal year 2000. In addition, SERS levies a surcharge to fund health care benefits equal to 14<br />
percent of the difference between a minimum pay and the member’s pay, pro-rated for partial service<br />
credit. For fiscal year <strong>2001</strong>, the minimum pay was established at $12,400. For the School District, the<br />
amount contributed to fund health care benefits, including the surcharge, during the <strong>2001</strong> fiscal year<br />
equaled $77,494.<br />
The surcharge, added to the unallocated portion of the 14 percent employer contribution rate, provides for<br />
maintenance of the asset target level for the health care fund. The target level for the health care reserve<br />
is 150 percent of the annual health care expenses. Expenses for health care for the fiscal year ended June<br />
30, 2000 (the latest information available), were $140,696,340 and the target level was $211.0 million.<br />
At June 30, 2000, SERS had net assets available for payment of health care benefits of $252.3 million.<br />
SERS has approximately 50,000 participants currently receiving health care benefits.<br />
Note 12 - Other Employee Benefits<br />
A. Compensated Absences<br />
The criteria for determining vacation and sick leave benefits are derived from negotiated agreements and<br />
State laws. Classified employees earn ten to twenty five days of vacation per year, depending upon<br />
length of service. Accumulated unused vacation time is paid to classified employees upon termination of<br />
employment. Teachers do not earn vacation time.<br />
Each employee earns sick leave at the rate of one and one-fourth days per month. Sick leave may be<br />
accumulated with no maximum. Upon retirement, payment is made for one fourth of the total sick leave<br />
accumulation, up to a maximum accumulation of 80 days for both classified and certified employees. An<br />
employee receiving such payment must meet the retirement provisions set by STRS or SERS.<br />
B. Life Insurance<br />
The School District provides life insurance and accidental death and dismemberment insurance to most<br />
employees through the Trumbull County <strong>Schools</strong> Employee Insurance Benefits Consortium at a cost of<br />
$.125 per month per $1,000 in coverage. The coverages are provided as follows:<br />
Amount of<br />
Amount of<br />
Class Class Description Coverage Class Class Description Coverage<br />
I Full Time Certified $50,000 V Half Day Classified $12,500<br />
II Full Time Classified 25,000 VI Classified Cafeteria Aide 12,500<br />
III Part Time Certified 25,000 VII Half Day Custodial 12,500<br />
IV Treasurer 50,000 VIII Building Secretaries 25,000<br />
IX Administrators 50,000<br />
- 45 -
<strong>Joseph</strong> <strong>Badger</strong> <strong>Local</strong> School District<br />
Notes to the Basic Financial Statements<br />
For the Fiscal Year Ended June 30, <strong>2001</strong><br />
Note 13 - Long-Term Liabilities<br />
The changes in the School District’s long-term obligations during the year consist of the following:<br />
Governmental Activities<br />
Principal Principal Amounts<br />
Outstanding Outstanding Due in<br />
6/30/00 Additions Reductions 6/30/01 One Year<br />
General Obligation Bond:<br />
7.25% 1970 High School<br />
Renovation $20,000 $0 $20,000 $0 $0<br />
Compensated Absences 529,721 285,227 263,218 551,730 0<br />
Total Governmental<br />
Activities<br />
Long Term Liabilities $549,721 $285,227 $283,218 $5,517,300 $0<br />
Business-Type Activities<br />
Compensated Absences $4,991 $4,752 $5,901 $3,842 $0<br />
In 1970, the School District issued bonds for renovations at the high school in the amount of $475,000.<br />
These bonds were paid from the bond retirement fund. Compensated absences and the pension obligation<br />
will be paid from the general and the title I governmental funds.<br />
At June 30, <strong>2001</strong>, the School District’s overall legal debt margin was $8,243,123 with an unvoted debt<br />
margin of $91,590.<br />
Note 14 – Interfund Transfers<br />
Transfers made during the year ended June 30, <strong>2001</strong> were as follows:<br />
Fund Name<br />
Transfers<br />
In<br />
Transfers<br />
Out<br />
General Fund $828 $13,000<br />
Debt Service Fund 0 828<br />
All Other Governmental Funds 13,000 0<br />
Totals $13,828 13,828<br />
Transfers are made to move unrestricted balances to support programs and projects accounted for in other<br />
funds. The $828 transfer is a transfer to eliminate the remaining cash balance in the debt service fund.<br />
The District has no outstanding general obligation debt as of June 30, <strong>2001</strong>.<br />
- 46 -
<strong>Joseph</strong> <strong>Badger</strong> <strong>Local</strong> School District<br />
Notes to the Basic Financial Statements<br />
For the Fiscal Year Ended June 30, <strong>2001</strong><br />
Note 15 - Contingencies<br />
A. Grants<br />
The School District received financial assistance from federal and state agencies in the form of grants.<br />
The disbursement of funds received under these programs generally requires compliance with terms and<br />
conditions specified in the grant agreements and are subject to audit by the grantor agencies. Any<br />
disallowed claims resulting from such audits could become a liability of the general fund or other<br />
applicable funds. However, in the opinion of management, any such disallowed claims will not have a<br />
material adverse effect on the overall financial position of the School District at June 30, <strong>2001</strong>.<br />
B. Litigation<br />
<strong>Joseph</strong> <strong>Badger</strong> <strong>Local</strong> School District is not currently a party to any legal proceedings.<br />
Note 16 - Jointly Governed Organizations<br />
A. The Trumbull County Career and Technical Center<br />
The Trumbull County Career and Technical Center is a distinct political subdivision of the State of Ohio<br />
operated under the direction of a board consisting of one representative from each of the fifteen<br />
participating school districts. The board is responsible for approving its own budgets, appointing<br />
personnel, and accounting and finance related activities. <strong>Joseph</strong> <strong>Badger</strong> <strong>Local</strong> School District students<br />
may attend the vocational school. Each school district’s control is limited to its representation on the<br />
board. During fiscal year <strong>2001</strong>, no monies were paid to the vocational school. Financial information can<br />
be obtained from the Trumbull County Career and Technical Center, Treasurer, at 528 Educational<br />
Highway, Warren, Ohio, 44483.<br />
B. Northeast Ohio Management Information Network (NEOMIN)<br />
The Northeast Ohio Management Information Network (NEOMIN) is a jointly governed organization<br />
among thirty school districts in Trumbull and Ashtabula counties. The jointly governed organization was<br />
formed for the purpose of applying modern technology with the aid of computers and other electronic<br />
equipment to administrative and instructional functions among member districts. Each of the districts<br />
supports NEOMIN based upon a per pupil charge. The School District paid $23,037 to NEOMIN during<br />
fiscal year <strong>2001</strong>.<br />
Superintendents of the participating school districts are eligible to be voting members of the Governing<br />
Board which consists of ten members: the Trumbull and Ashtabula County superintendents (permanent<br />
members), three superintendents from Ashtabula County school districts, three superintendents from<br />
Trumbull County school districts, and a principal and treasurer (non-voting members who must be<br />
employed by a participating school district, the fiscal agent or NEOMIN). The School District was<br />
represented on the Governing Board during fiscal year <strong>2001</strong>. The degree of control exercised by any<br />
participating school district is limited to its representation on the Governing Board. Financial information<br />
can be obtained from the Trumbull County Educational Service Center, at 347 North Park Avenue,<br />
Warren, Ohio, 44481.<br />
- 47 -
<strong>Joseph</strong> <strong>Badger</strong> <strong>Local</strong> School District<br />
Notes to the Basic Financial Statements<br />
For the Fiscal Year Ended June 30, <strong>2001</strong><br />
C. The Northeast Ohio Instructional Media Center (NEOIMC)<br />
The Northeast Ohio Instructional Media Center (NEOIMC) is a jointly governed organization among<br />
forty-five school districts. The jointly governed organization was formed for the purpose of providing<br />
quality films and/or other media to support the educational curricula of the School District. Each member<br />
pays a monthly premium based on use of the media materials.<br />
NEOIMC is governed by an advisory committee made up of a member from a parochial school, a joint<br />
vocational school, one County Superintendent from each participating county, one city superintendent and<br />
two local superintendents rotating every two years. The degree of control exercised by any participating<br />
school district is limited to its representation on the Board. In fiscal year <strong>2001</strong>, the School District paid<br />
$78, which represents 1.71 percent of total contributions. Financial information can be obtained by<br />
contacting the treasurer at the Trumbull County Educational Service Center, at 347 North Park Avenue,<br />
Warren, Ohio, 44481.<br />
D. The Trumbull Student Assistance Consortium (TSAC)<br />
The Trumbull Student Assistance Consortium (TSAC) is a jointly governed organization among sixteen<br />
school districts. The jointly governed organization was formed for the purpose of aiding each<br />
participating district in establishing an effective comprehensive alcohol, tobacco and other drug<br />
prevention/intervention program that will help make schools drug free.<br />
TSAC is governed by an executive management council made up five superintendents of the participating<br />
districts whose term rotates every year. The degree of control exercised by any participating school<br />
district is limited to its representation on the Board. Financial information can be obtained by contacting<br />
the treasurer at the Trumbull County Educational Service Center, at 347 North Park Avenue, Warren,<br />
Ohio, 44481.<br />
E. The Northeast Ohio Special Education Regional Resource Center (NEO/SERRC)<br />
The Northeast Ohio Special Education Regional Resource Center (NEO/SERRC) is a special education<br />
service center which selects its own board, adopts its own budget and receives direct Federal and State<br />
grants for its operation. The jointly governed organization was formed for the purpose of initiating,<br />
expanding and improving special education programs and services for children with disabilities and their<br />
parents.<br />
NEO/SERRC is governed by a governing board of 39 members made up of representatives from 35<br />
superintendents of the participating districts, one non-public school, one county board of mental<br />
retardation and two parents whose term rotates every year. The degree of control exercised by any<br />
participating school district is limited to its representation on the Board. Financial information can be<br />
obtained by contacting the treasurer at the Mahoning County Educational Service Center, at 2801 Market<br />
Street, Youngstown, Ohio, 44507.<br />
F. Region 12 Professional Development Center (Center)<br />
The Region 12 Professional Development Center (Center) is a jointly governed organization among the<br />
school districts located in Trumbull, Mahoning and Columbiana Counties. The jointly governed<br />
organization was formed for the purpose of establishing an articulated, regional structure for professional<br />
development, in which school districts, the business community, higher education and other groups<br />
- 48 -
<strong>Joseph</strong> <strong>Badger</strong> <strong>Local</strong> School District<br />
Notes to the Basic Financial Statements<br />
For the Fiscal Year Ended June 30, <strong>2001</strong><br />
cooperatively plan and implement effective professional development activities that are tied directly to<br />
school improvement, and in particular, to improvements in instructional programs.<br />
The Center is governed by a governed by a governing board made up of nineteen representatives of the<br />
participating school districts, the business community, and Youngstown State University, whose term<br />
rotates every year. The degree of control exercised by any participating school district is limited to its<br />
representation on the Board. Financial information can be obtained by contacting the treasurer at the<br />
Trumbull County Educational Service Center, at 347 North Park Avenue, Warren, Ohio, 44481.<br />
Note 17 - Public Entity Risk Pools<br />
A. Insurance Purchasing Pool<br />
The School District participates in the Ohio School Boards Association Workers’ Compensation Group<br />
Rating Program (GRP), an insurance purchasing pool. The GRP’s business and affairs are conducted by a<br />
three member Board of directors consisting of the President, the President-Elect and the Immediate Past<br />
President of the OSBA. The Executive Director of the OSBA, or his designee, serves as coordinator of<br />
the program. Each year, the participating school districts pay an enrollment fee to the GRP to cover the<br />
costs of administering the program.<br />
B. Shared Risk Pool<br />
The School District participates in the Trumbull County <strong>Schools</strong> Employee Insurance Benefits<br />
Consortium. It is a shared risk pool comprised of sixteen Trumbull County School Districts. The<br />
Consortium is governed by an assembly which consists of one representative from each participating<br />
school district (usually the superintendent or designee). The assembly elects officers for one year terms<br />
to serve as the Board of Directors. The assembly exercises control over the operation of the Consortium.<br />
All Consortium revenue are generated from charges for services.<br />
Note 18 - Related Organization<br />
The Kinsman Public Library is a distinct political subdivision of the State of Ohio created under Chapter<br />
3375 of the Ohio Revised Code. The Library is governed by a Board of Trustees appointed by the <strong>Joseph</strong><br />
<strong>Badger</strong> <strong>Local</strong> School District Board of Education. The Board of Trustees possesses its own contracting<br />
and budgeting authority, hires and fires personnel and does not depend on the School District for<br />
operational subsidies. Although the School District does serve as the taxing authority and may issue tax<br />
related debt on behalf of the Library, its role is limited to a ministerial function. The determination to<br />
request approval of a tax, the rate and the purpose are discretionary decisions made solely by the Board of<br />
Trustees. Financial information can be obtained from the Kinsman Public Library, Martha L. Huscroft,<br />
Clerk/Treasurer, at 6420 Church Street, Kinsman, Ohio, 44428.<br />
Note 19 - Set-Aside Calculations<br />
The School District is required by State statute to annually set aside in the general fund an amount based<br />
on a statutory formula for the purchase of textbooks and other instructional materials and an equal amount<br />
for the acquisition and construction of capital improvements. Amounts not spent by year-end or offset by<br />
similarly restricted resources received during the year must be held in cash at year-end and carried<br />
forward to be used for the same purposes in future years. The School District is also required to set aside<br />
money for budget stabilization. The following cash basis information describes the change in the year-end<br />
- 49 -
<strong>Joseph</strong> <strong>Badger</strong> <strong>Local</strong> School District<br />
Notes to the Basic Financial Statements<br />
For the Fiscal Year Ended June 30, <strong>2001</strong><br />
set-aside amounts for textbooks, capital acquisition, and budget stabilization. Disclosure of this<br />
information is required by State statute.<br />
Capital Budget<br />
Textbooks Acquisition Stabilization<br />
Set-aside Reserve Balance as of June 30, 2000 ($117,808) $64,764 $138,342<br />
Current Year Set-aside Requirement 163,350 163,350 0<br />
Reduction Authorized by Legislative Revisions 0 0 (104,986)<br />
Qualifying Disbursements (310,518) (454,456) 0<br />
Totals ($264,976) ($226,342) $33,356<br />
Set-aside Balance Carried Forward to<br />
Future Fiscal Years ($264,976) ($226,342) $33,356<br />
Set-aside Reserve Balance as of June 30, <strong>2001</strong> $0 $0 $33,356<br />
The School District had qualifying disbursements during the fiscal year that reduced the textbook and<br />
capital acquisition set aside amounts to below zero. This extra amount may be used to reduce the setaside<br />
requirement of future years. The total reserve balance for the three set-asides at the end of the fiscal<br />
year was $33,356.<br />
Note 20 - Restricted Assets<br />
Restricted assets presented in the Governmental Activities column of the Statement of Net Assets are<br />
made up of the following:<br />
Cash and Cash Equivalents $174,904<br />
Taxes Receivable 58,817<br />
Restricted Cash 33,356<br />
Total Restricted Assets $267,077<br />
Note 21 – School Funding Decision<br />
On September 6, <strong>2001</strong>, the Ohio Supreme Court issued its latest opinion regarding the State’s school<br />
funding plan. The decision identified aspects of the current plan that require modifications if the plan is<br />
to be considered constitutional, including:<br />
1. A change in the school districts that are used as the basis for determining the base cost<br />
support amount. Any change in the amount of funds distributed to school districts as a<br />
result of this change must be retroactive to July 1, <strong>2001</strong>, although a time line for<br />
distribution is not specified.<br />
2. Fully funding parity aid no later than the beginning of fiscal year 2004 rather than fiscal<br />
year 2006.<br />
- 50 -
<strong>Joseph</strong> <strong>Badger</strong> <strong>Local</strong> School District<br />
Notes to the Basic Financial Statements<br />
For the Fiscal Year Ended June 30, <strong>2001</strong><br />
The Supreme Court relinquished jurisdiction over the case based on anticipated compliance with its order.<br />
In general, it is expected that the decision would result in an increase in State funding for most Ohio<br />
school districts. However, as of November 28, <strong>2001</strong>, the Ohio General Assembly is still analyzing the<br />
impact this Supreme Court decision will have on funding for individual school districts. Further, the<br />
State of Ohio, in a motion filed September 17, <strong>2001</strong>, asked the Court to reconsider and clarify the parts of<br />
the decision changing the school districts that are used as the basis for determining the base cost support<br />
amount and the requirement that changes be made retroactive to July 1, <strong>2001</strong>.<br />
On November 2, <strong>2001</strong>, the Court granted this motion for reconsideration. The Court may reexamine and<br />
re-determine any issue upon such reconsideration.<br />
As of the date of these financial statements, the School District is unable to determine what effect, if any,<br />
this decision and the reconsideration will have on its future State funding and on its financial operations.<br />
- 51 -
- 52 -
<strong>Joseph</strong> <strong>Badger</strong> <strong>Local</strong> School District<br />
Combining Statements and Individual Fund Schedules<br />
- 53 -
<strong>Joseph</strong> <strong>Badger</strong> <strong>Local</strong> School District<br />
Combining Statements- Nonmajor Funds<br />
Nonmajor Special Revenue Funds<br />
Special Revenue Funds are established to account for revenues from specific sources (other than expendable<br />
trusts, or for major capital projects) that are legally restricted to expenditures for specific purpose. Following<br />
is a description of the School District’s nonmajor special revenue funds:<br />
Principal’s Fund - This fund accounts for school site sales revenue and expenditures for field trips,<br />
assemblies, and other activity costs.<br />
Professional Development Fund - This fund accounts for State monies used to provide seminars and<br />
workshops for staff development.<br />
Auxiliary Services Fund - This fund accounts for funds which provide services and materials to pupils<br />
attending non-public schools within the School District.<br />
Educational Management Information Systems Fund (EMIS) - This fund accounts for State monies which<br />
support the development of hardware and software or other costs associated with the requirements of the<br />
management information system.<br />
District Managed Student Activity Fund - This fund accounts for gate receipts and other revenues from<br />
athletic events, all costs (except supplemental coaching contracts) of the School District’s athletic program<br />
and transportation of the band to and from athletic events.<br />
Disadvantaged Pupil Fund (DPPF)-This fund accounts for State monies received for disadvantaged pupils.<br />
School Net Professional Development Fund - This fund accounts for monies to be used for hands on training<br />
and other technology opportunities for school administrative employees.<br />
Summer Intervention Fund - This fund accounts for State monies used to provide summer school for those<br />
children in need of additional assistance.<br />
Safe <strong>Schools</strong> Fund - This fund accounts for federal revenues used for a phone line for parents to call if they<br />
feel the school is threatened by outside influences.<br />
Title VI-B Fund - This fund accounts for Federal monies used to assist schools in the identification of<br />
handicapped children, development of procedural safeguards, implementation of least restrictive alternative<br />
service patterns, and provision of full educational opportunities to handicapped children at the preschool,<br />
elementary, and secondary levels.<br />
Title I Fund - This fund accounts for Federal monies used to assist the School District in meeting the special<br />
needs of educationally deprived children.<br />
(continued)<br />
- 54 -
<strong>Joseph</strong> <strong>Badger</strong> <strong>Local</strong> School District<br />
Nonmajor Special Revenue Funds<br />
(continued)<br />
Title VI Fund - This fund accounts for Federal monies which support the implementation of a variety of<br />
programs such as computer education, gifted and talented programs, in-service and staff development.<br />
Title VI-R Fund - This fund accounts for federal monies used to analyze classrooms within the District and<br />
helps allow the District to hire extra teachers to reduce classroom size.<br />
Drug Free Fund – This fund accounts for federal monies used to establish, operate and improve local<br />
programs of drug abuse prevention and to engage in development, training and technical assistance.<br />
Eisenhower Fund – This fund accounts for federal monies used to strengthen instruction in science,<br />
mathematics, modern foreign languages, English, the arts and computer learning.<br />
Nonmajor Capital Projects Funds<br />
Capital Projects Funds are used to account for financial resources to be used for the acquisition or<br />
construction of major capital facilities (other than those financed by proprietary funds). Following is a<br />
description of the nonmajor capital projects funds:<br />
School Net Fund - This fund accounts for State monies used to obtain computer and related educational<br />
equipment and/or the necessary infrastructure for educational technology.<br />
Tech Equity Fund -This fund accounts for State monies used for technology within the School District.<br />
- 55 -
<strong>Joseph</strong> <strong>Badger</strong> <strong>Local</strong> School District<br />
Combining Balance Sheet<br />
Nonmajor Governmental Funds<br />
June 30, <strong>2001</strong><br />
Nonmajor Nonmajor Total<br />
Special Capital Nonmajor<br />
Revenue Projects Governmental<br />
Funds Funds Funds<br />
Assets<br />
Equity in Pooled Cash and Cash Equivalents $80,914 $18,473 $99,387<br />
Total Assets $80,914 $18,473 $99,387<br />
Liabilities and Fund Balances<br />
Liabilities<br />
Accrued Wages $13,076 $0 $13,076<br />
Intergovernmental Payable 2,145 0 2,145<br />
Total Liabilities 15,221 0 15,221<br />
Fund Balances<br />
Reserved for Encumbrances 4,900 32,010 36,910<br />
Unreserved, Undesignated, Reported in:<br />
Special Revenue Funds 60,793 0 60,793<br />
Capital Projects Funds (Deficit) 0 (13,537) (13,537)<br />
Total Fund Balances 65,693 18,473 84,166<br />
Total Liabilities and Fund Balances $80,914 $18,473 $99,387<br />
- 56 -
<strong>Joseph</strong> <strong>Badger</strong> <strong>Local</strong> School District<br />
Combining Statement of Revenues, Expenditures and Changes in Fund Balances<br />
Nonmajor Governmental Funds<br />
For the Fiscal Year Ended June 30, <strong>2001</strong><br />
Nonmajor Nonmajor Total<br />
Special Capital Nonmajor<br />
Revenue Projects Governmental<br />
Funds Funds Funds<br />
Revenues<br />
Intergovernmental $304,349 $77,968 $382,317<br />
Interest 731 0 731<br />
Extracurricular Activities 60,198 0 60,198<br />
Contributions and Donations 7,531 0 7,531<br />
Total Revenues 372,809 77,968 450,777<br />
Expenditures<br />
Current:<br />
Instruction:<br />
Regular 95,059 0 95,059<br />
Special 177,287 0 177,287<br />
Support Services:<br />
Pupils 3,124 0 3,124<br />
Administration 5,988 0 5,988<br />
Fiscal 9,946 0 9,946<br />
Extracurricular Activities 66,389 0 66,389<br />
Capital Outlay 0 85,562 85,562<br />
Total Expenditures 357,793 85,562 443,355<br />
Excess of Revenues Over (Under) Expenditures 15,016 (7,594) 7,422<br />
Other Financing Sources<br />
Operating Transfers In 13,000 0 13,000<br />
Net Change in Fund Balances 28,016 (7,594) 20,422<br />
Fund Balances Beginning of Year 37,677 26,067 63,744<br />
Fund Balances End of Year $65,693 $18,473 $84,166<br />
- 57 -
<strong>Joseph</strong> <strong>Badger</strong> <strong>Local</strong> School District<br />
Combining Balance Sheet<br />
Nonmajor Special Revenue Funds<br />
June 30, <strong>2001</strong><br />
Professional Auxiliary<br />
Principal's Development Services<br />
Assets<br />
Equity in Pooled Cash and<br />
Cash Equivalents $12,468 $503 $131<br />
Liabilities and Fund Balances<br />
Liabilities<br />
Accrued Wages $0 $0 $0<br />
Intergovernmental Payable 0 0 0<br />
Total Liabilities 0 0 0<br />
Fund Balances<br />
Reserved for Encumbrances 1,512 0 0<br />
Unreserved, Undesignated, Reported In:<br />
Special Revenue Funds 10,956 503 131<br />
Total Fund Equity 12,468 503 131<br />
Total Liabilities and Fund Balances $12,468 $503 $131<br />
- 58 -
District School<br />
Managed Net<br />
Student Professional Summer Safe<br />
EMIS Activity Development Intervention <strong>Schools</strong><br />
$5,000 $22,264 $2,787 $11,514 $88<br />
$0 $0 $0 $0 $0<br />
0 0 0 0 0<br />
0 0 0 0 0<br />
0 2,525 0 0 0<br />
5,000 19,739 2,787 11,514 88<br />
5,000 22,264 2,787 11,514 88<br />
$5,000 $22,264 $2,787 $11,514 $88<br />
(continued)<br />
- 59 -
<strong>Joseph</strong> <strong>Badger</strong> <strong>Local</strong> School District<br />
Combining Balance Sheet<br />
Nonmajor Special Revenue Funds (continued)<br />
June 30, <strong>2001</strong><br />
Title I<br />
Total<br />
Nonmajor<br />
Special Revenue<br />
Funds<br />
Assets<br />
Equity in Pooled Cash and<br />
Cash Equivalents $26,159 $80,914<br />
Liabilities and Fund Balances<br />
Liabilities<br />
Accrued Wages $13,076 $13,076<br />
Intergovernmental Payable 2,145 2,145<br />
Total Liabilities 15,221 15,221<br />
Fund Balances<br />
Reserved for Encumbrances 863 4,900<br />
Unreserved, Undesignated, Reported In:<br />
Special Revenue Funds 10,075 60,793<br />
Total Fund Equity 10,938 65,693<br />
Total Liabilities and Fund Balances $26,159 $80,914<br />
- 60 -
<strong>Joseph</strong> <strong>Badger</strong> <strong>Local</strong> School District<br />
Combining Statement of Revenues, Expenditures<br />
and Changes in Fund Balances<br />
Nonmajor Special Revenue Funds<br />
For the Fiscal Year Ended June 30, <strong>2001</strong><br />
Professional Auxiliary<br />
Principal's Development Services EMIS<br />
Revenues<br />
Intergovernmental $0 $5,680 $34,947 $5,000<br />
Interest 0 0 731 0<br />
Extracurricular Activities 28,367 0 0 0<br />
Contributions and Donations 0 0 0 0<br />
Total Revenues 28,367 5,680 35,678 5,000<br />
Expenditures<br />
Current:<br />
Instruction:<br />
Regular 0 5,779 26,957 0<br />
Special 0 0 0 0<br />
Support Services:<br />
Pupils 0 0 0 0<br />
Administration 0 0 0 5,561<br />
Fiscal 0 0 9,946 0<br />
Extracurricular Activities 23,397 0 0 0<br />
Total Expenditures 23,397 5,779 36,903 5,561<br />
Excess of Revenues Over (Under) Expenditures 4,970 (99) (1,225) (561)<br />
Other Financing Sources<br />
Operating Transfers In 0 0 0 0<br />
Net Change in Fund Balances 4,970 (99) (1,225) (561)<br />
Fund Balances (Deficit) Beginning of Year 7,498 602 1,356 5,561<br />
Fund Balances End of Year $12,468 $503 $131 $5,000<br />
(continued)<br />
- 61 -
<strong>Joseph</strong> <strong>Badger</strong> <strong>Local</strong> School District<br />
Combining Statement of Revenues, Expenditures<br />
and Changes in Fund Balances<br />
Nonmajor Special Revenue Funds (continued)<br />
For the Fiscal Year Ended June 30, <strong>2001</strong><br />
District<br />
School<br />
Managed<br />
Net<br />
Student Professional Summer<br />
Activity DPPF Development Intervention<br />
Revenues<br />
Intergovernmental $0 $10,811 $4,000 $9,375<br />
Interest 0 0 0 0<br />
Extracurricular Activities 31,831 0 0 0<br />
Contributions and Donations 7,531 0 0 0<br />
Total Revenues 39,362 10,811 4,000 9,375<br />
Expenditures<br />
Current:<br />
Instruction:<br />
Regular 0 0 4,786 13,217<br />
Special 0 10,811 0 0<br />
Support Services:<br />
Pupils 0 0 0 1,929<br />
Administration 0 427 0<br />
Fiscal 0 0 0 0<br />
Extracurricular Activities 42,992 0 0 0<br />
Total Expenditures 42,992 10,811 5,213 15,146<br />
Excess of Revenues Over (Under) Expenditures (3,630) 0 (1,213) (5,771)<br />
Other Financing Sources (Uses)<br />
Operating Transfers In 13,000 0 0 0<br />
Net Change in Fund Balances 9,370 0 (1,213) (5,771)<br />
Fund Balances (Deficit) Beginning of Year 12,894 0 4,000 17,285<br />
Fund Balances End of Year $22,264 $0 $2,787 $11,514<br />
- 62 -
Total<br />
Nonmajor<br />
Safe Title Drug Special Revenue<br />
<strong>Schools</strong> VI-B Title I Title VI Title VI-R Free Eisenhower Funds<br />
$1,239 $58,695 $131,810 $7,046 $25,401 $5,186 $5,159 $304,349<br />
0 0 0 0 0 0 0 731<br />
0 0 0 0 0 0 0 60,198<br />
0 0 0 0 0 0 0 7,531<br />
1,239 58,695 131,810 7,046 25,401 5,186 5,159 372,809<br />
0 0 0 7,046 26,929 5,186 5,159 95,059<br />
0 58,695 107,781 0 0 0 0 177,287<br />
1,195 0 0 0 0 0 0 3,124<br />
0 0 0 0 0 0 0 5,988<br />
0 0 0 0 0 0 0 9,946<br />
0 0 0 0 0 0 0 66,389<br />
1,195 58,695 107,781 7,046 26,929 5,186 5,159 357,793<br />
44 0 24,029 0 (1,528) 0 0 15,016<br />
0 0 0 0 0 0 0 13,000<br />
44 0 24,029 0 (1,528) 0 0 28,016<br />
44 0 (13,091) 0 1,528 0 0 37,677<br />
$88 $0 $10,938 $0 $0 $0 $0 $65,693<br />
- 63 -
Jospeh <strong>Badger</strong> <strong>Local</strong> School District<br />
Combining Balance Sheet<br />
Nonmajor Capital Projects Funds<br />
June 30, <strong>2001</strong><br />
Total<br />
Nonmajor<br />
School Tech Capital Projects<br />
Net Equity Funds<br />
Assets<br />
Equity in Pooled Cash and Cash Equivalents $18,473 $0 $18,473<br />
Liabilities and Fund Balances<br />
Total Liabilities $0 $0 $0<br />
Fund Balances<br />
Reserved for Encumbrances 12,000 20,010 32,010<br />
Unreserved, Undesignated Reported in:<br />
Capital Projects Funds (Deficit) 6,473 (20,010) (13,537)<br />
Total Liabilities and Fund Balances $18,473 $0 $18,473<br />
- 64 -
<strong>Joseph</strong> <strong>Badger</strong> <strong>Local</strong> School District<br />
Combining Statement of Revenues, Expenditures<br />
and Changes in Fund Balances<br />
Nonmajor Capital Projects Funds<br />
For the Fiscal Year Ended June 30, <strong>2001</strong><br />
Total<br />
Nonmajor<br />
School Tech Capital Projects<br />
Net Equity Funds<br />
Revenues<br />
Intergovernmental $66,500 $11,468 $77,968<br />
Expenditures<br />
Capital Outlay 64,089 21,473 85,562<br />
Net Change in Fund Balances 2,411 (10,005) (7,594)<br />
Fund Balances Beginning of Year 16,062 10,005 26,067<br />
Fund Balances End of Year $18,473 $0 $18,473<br />
- 65 -
<strong>Joseph</strong> <strong>Badger</strong> <strong>Local</strong> School District<br />
Schedule of Revenues, Expenditures and Changes<br />
In Fund Balance - Budget (Non-GAAP Basis) and Actual<br />
General Fund<br />
For the Fiscal Year Ended June 30, <strong>2001</strong><br />
Variance With<br />
Budgeted Amounts<br />
Final Budget<br />
Favorable<br />
Original Final Actual (Unfavorable)<br />
Revenues<br />
Taxes $2,835,579 $2,594,692 $2,594,692 $0<br />
Intergovernmental 4,230,000 4,296,807 4,296,807 0<br />
Interest 170,000 163,390 163,390 0<br />
Tuition and Fees 40,000 30,594 30,594 0<br />
Charges for Services 2,000 1,455 1,455 0<br />
Contributions and Donations 22,846 1,839 1,839 0<br />
Miscellaneous 55,254 38,482 38,506 24<br />
Total Revenues 7,355,679 7,127,259 7,127,283 24<br />
Expenditures<br />
Current:<br />
Instruction:<br />
Regular:<br />
Salaries and Wages 2,555,500 2,475,141 2,475,141 0<br />
Fringe Benefits 747,610 777,242 777,242 0<br />
Purchased Services 41,100 39,720 39,720 0<br />
Materials and Supplies 275,098 204,447 204,447 0<br />
Capital Outlay - New 10,000 27,047 27,047 0<br />
Capital Outlay - Replacement 7,691 0 0 0<br />
Total Regular 3,636,999 3,523,597 3,523,597 0<br />
Special:<br />
Salaries and Wages 81,600 84,277 84,277 0<br />
Fringe Benefits 21,600 19,847 19,847 0<br />
Purchased Services 142,420 329,233 329,233 0<br />
Materials and Supplies 8,059 9,544 9,544 0<br />
Total Special 253,679 442,901 442,901 0<br />
Vocational:<br />
Salaries and Wages 24,700 30,649 30,649 0<br />
Fringe Benefits 8,800 13,347 13,347 0<br />
Materials and Supplies 718 0 0 0<br />
Total Vocational 34,218 43,996 43,996 0<br />
Total Instruction $3,924,896 $4,010,494 $4,010,494 $0<br />
(continued)<br />
- 66 -
<strong>Joseph</strong> <strong>Badger</strong> <strong>Local</strong> School District<br />
Schedule of Revenues, Expenditures and Changes<br />
In Fund Balance - Budget (Non-GAAP Basis) and Actual<br />
General Fund (continued)<br />
For the Fiscal Year Ended June 30, <strong>2001</strong><br />
Variance With<br />
Budgeted Amounts<br />
Final Budget<br />
Favorable<br />
Original Final Actual (Unfavorable)<br />
Support Services:<br />
Pupils:<br />
Salaries and Wages $163,300 $183,990 $183,990 $0<br />
Fringe Benefits 44,130 51,023 51,023 0<br />
Purchased Services 24,088 25,271 25,271 0<br />
Materials and Supplies 2,310 7,860 7,860 0<br />
Total Pupils 233,828 268,144 268,144 0<br />
Instructional Staff:<br />
Salaries and Wages 115,200 116,636 116,636 0<br />
Fringe Benefits 26,400 29,430 29,430 0<br />
Purchased Services 3,200 1,818 1,818 0<br />
Materials and Supplies 29,273 20,502 20,502 0<br />
Capital Outlay - New 8,942 4,968 4,968 0<br />
Total Instructional Staff 183,015 173,354 173,354 0<br />
Board of Education:<br />
Salaries and Wages 3,500 2,840 2,840 0<br />
Fringe Benefits 725 633 633 0<br />
Purchased Services 126,000 122,310 122,310 0<br />
Materials and Supplies 500 170 170 0<br />
Capital Outlay - New 4,000 3,371 3,371 0<br />
Other 1,000 9,510 9,510 0<br />
Total Board of Education 135,725 138,834 138,834 0<br />
Administration:<br />
Salaries and Wages 353,403 416,474 416,474 0<br />
Fringe Benefits 147,495 170,763 170,763 0<br />
Purchased Services 77,000 50,418 50,418 0<br />
Materials and Supplies 17,812 10,982 10,982 0<br />
Capital Outlay - New 22,100 35,695 35,695 0<br />
Other 65,085 65,667 65,667 0<br />
Total Administration 682,895 749,999 749,999 0<br />
Fiscal:<br />
Salaries and Wages 97,600 97,914 97,914 0<br />
Fringe Benefits 41,775 46,004 46,004 0<br />
Purchased Services 15,500 5,788 5,788 0<br />
Materials and Supplies 1,254 1,909 1,909 0<br />
Capital Outlay - New 26,000 30,744 30,744 0<br />
Other 18,462 28,690 28,690 0<br />
Total Fiscal $200,591 $211,049 $211,049 $0<br />
(continued)<br />
- 67 -
<strong>Joseph</strong> <strong>Badger</strong> <strong>Local</strong> School District<br />
Schedule of Revenues, Expenditures and Changes<br />
In Fund Balance - Budget (Non-GAAP Basis) and Actual<br />
General Fund (continued)<br />
For the Fiscal Year Ended June 30, <strong>2001</strong><br />
Variance With<br />
Budgeted Amounts<br />
Final Budget<br />
Favorable<br />
Original Final Actual (Unfavorable)<br />
Operation and Maintenance of Plant:<br />
Salaries and Wages $194,600 $183,418 $183,418 $0<br />
Fringe Benefits 91,020 100,450 100,450 0<br />
Purchased Services 246,799 268,094 268,094 0<br />
Materials and Supplies 40,048 40,766 40,766 0<br />
Capital Outlay - New 625 1,418 1,418 0<br />
Other 6,338 6,398 6,398 0<br />
Total Operation and Maintenance of Plant 579,430 600,544 600,544 0<br />
Pupil Transportation:<br />
Salaries and Wages 168,800 184,554 184,201 353<br />
Fringe Benefits 104,500 113,410 113,410 0<br />
Purchased Services 130,422 137,233 137,233 0<br />
Materials and Supplies 70,899 78,892 78,514 378<br />
Capital Outlay - New 5,000 60,664 60,664 0<br />
Other 7,190 7,190 7,190 0<br />
Total Pupil Transportation 486,811 581,943 581,212 731<br />
Central:<br />
Salaries and Wages 41,800 39,690 39,690 0<br />
Fringe Benefits 8,630 10,335 10,335 0<br />
Purchased Services 500 247 247 0<br />
Materials and Supplies 4,347 7,300 7,300 0<br />
Capital Outlay - New 8,000 7,632 7,632 0<br />
Total Central 63,277 65,204 65,204 0<br />
Total Support Services 2,565,572 2,789,071 2,788,340 731<br />
Extracurricular Activities:<br />
Academic and Subject Oriented:<br />
Salaries and Wages 24,200 27,847 27,847 0<br />
Fringe Benefits 1,500 2,269 2,269 0<br />
Purchased Services 1,700 0 0 0<br />
Total Academic and Subject Oriented 27,400 30,116 30,116 0<br />
Sports Oriented:<br />
Salaries and Wages 66,500 68,337 68,337 0<br />
Fringe Benefits 11,175 12,012 12,012 0<br />
Total Sports Oriented 77,675 80,349 80,349 0<br />
Total Extracurricular Activities $105,075 $110,465 $110,465 $0<br />
(continued)<br />
- 68 -
<strong>Joseph</strong> <strong>Badger</strong> <strong>Local</strong> School District<br />
Schedule of Revenues, Expenditures and Changes<br />
In Fund Balance - Budget (Non-GAAP Basis) and Actual<br />
General Fund (continued)<br />
For the Fiscal Year Ended June 30, <strong>2001</strong><br />
Variance With<br />
Budgeted Amounts<br />
Final Budget<br />
Favorable<br />
Original Final Actual (Unfavorable)<br />
Capital Outlay:<br />
Site Improvement Services:<br />
Capital Outlay - New $24,000 $24,625 $24,625 $0<br />
Architecture and Engineering<br />
Services:<br />
Purchased Services 43,188 24,162 24,162 0<br />
Building Improvement Services:<br />
Capital Outlay - New 576,110 315,711 315,711 0<br />
Total Capital Outlay 643,298 364,498 364,498 0<br />
Total Expenditures 7,238,841 7,274,528 7,273,797 731<br />
Excess of Revenues Over (Under) Expenditures 116,838 (147,269) (146,514) 755<br />
Other Financing Sources (Uses)<br />
Operating Transfers In 0 828 828 0<br />
Operating Transfers Out (5,000) (13,000) (13,000) 0<br />
Net Change in Fund Balance 111,838 (159,441) (158,686) 755<br />
Fund Balance at Beginning of Year 1,742,401 1,742,401 1,742,401 0<br />
Prior Year Encumbrances Appropriated 511,471 511,471 511,471 0<br />
Fund Balance at End of Year $2,365,710 $2,094,431 $2,095,186 $755<br />
- 69 -
<strong>Joseph</strong> <strong>Badger</strong> <strong>Local</strong> School District<br />
Schedule of Revenues, Expenditures and Changes<br />
In Fund Balance - Budget (Non-GAAP) and Actual<br />
Principal's Fund<br />
For the Fiscal Year Ended June 30, <strong>2001</strong><br />
Variance with<br />
Budgeted Amounts<br />
Final Budget<br />
Favorable<br />
Original Final Actual (Unfavorable)<br />
Revenues<br />
Extracurricular Activities $22,500 $28,367 $28,367 $0<br />
Contributions and Donations 65 0 0 0<br />
Total Revenues 22,565 28,367 28,367 0<br />
Expenditures<br />
Current:<br />
Extracurricular Activities:<br />
School and Public Service<br />
Co-Curricular Activities:<br />
Purchased Services 845 3,539 3,539 0<br />
Materials and Supplies 6,794 21,370 21,370 0<br />
Total Expenditures 7,639 24,909 24,909 0<br />
Net Change in Fund Balance 14,926 3,458 3,458 0<br />
Fund Balance at Beginning of Year 6,304 6,304 6,304 0<br />
Prior Year Encumbrances Appropriated 1,194 1,194 1,194 0<br />
Fund Balance at End of Year $22,424 $10,956 $10,956 $0<br />
- 70 -
<strong>Joseph</strong> <strong>Badger</strong> <strong>Local</strong> School District<br />
Schedule of Revenues, Expenditures and Changes<br />
In Fund Balance - Budget (Non-GAAP) and Actual<br />
Professional Development Fund<br />
For the Fiscal Year Ended June 30, <strong>2001</strong><br />
Variance with<br />
Budgeted Amounts<br />
Final Budget<br />
Favorable<br />
Original Final Actual (Unfavorable)<br />
Revenues<br />
Intergovernmental $6,282 $5,680 $5,680 $0<br />
Expenditures<br />
Current:<br />
Instruction:<br />
Regular:<br />
Purchased Services 4,298 5,779 5,779 0<br />
Net Change in Fund Balance 1,984 (99) (99) 0<br />
Fund Balance at Beginning of Year 602 602 602 0<br />
Fund Balance at End of Year $2,586 $503 $503 $0<br />
- 71 -
<strong>Joseph</strong> <strong>Badger</strong> <strong>Local</strong> School District<br />
Schedule of Revenues, Expenditures and Changes<br />
In Fund Balance - Budget (Non-GAAP) and Actual<br />
Auxiliary Services Fund<br />
For the Fiscal Year Ended June 30, <strong>2001</strong><br />
Variance with<br />
Budgeted Amounts<br />
Final Budget<br />
Favorable<br />
Original Final Actual (Unfavorable)<br />
Revenues<br />
Intergovernmental $38,182 $34,947 $34,947 $0<br />
Interest 800 731 731 0<br />
Total Revenues 38,982 35,678 35,678 0<br />
Expenditures<br />
Current:<br />
Instruction:<br />
Regular:<br />
Purchased Services 10,544 3,402 3,402 0<br />
Materials and Supplies 25,000 24,058 24,058 0<br />
Total Instruction 35,544 27,460 27,460 0<br />
Support Services:<br />
Fiscal:<br />
Salaries and Wages 4,200 6,543 6,543 0<br />
Fringe Benefits 850 2,834 2,834 0<br />
Capital Outlay - New 0 569 569 0<br />
Total Support Services 5,050 9,946 9,946 0<br />
Total Expenditures 40,594 37,406 37,406 0<br />
Net Change in Fund Balance (1,612) (1,728) (1,728) 0<br />
Fund Balance at Beginning of Year 1,315 1,315 1,315 0<br />
Prior Year Encumbrances Appropriated 544 544 544 0<br />
Fund Balance at End of Year $247 $131 $131 $0<br />
- 72 -
<strong>Joseph</strong> <strong>Badger</strong> <strong>Local</strong> School District<br />
Schedule of Revenues, Expenditures and Changes<br />
In Fund Balance - Budget (Non-GAAP) and Actual<br />
Educational Management Information Systems Fund (EMIS)<br />
For the Fiscal Year Ended June 30, <strong>2001</strong><br />
Variance with<br />
Budgeted Amounts<br />
Final Budget<br />
Favorable<br />
Original Final Actual (Unfavorable)<br />
Revenues<br />
Intergovernmental $5,000 $5,000 $5,000 $0<br />
Expenditures<br />
Administration:<br />
Capital Outlay - New 5,561 5,561 5,561 0<br />
Net Change in Fund Balance (561) (561) (561) 0<br />
Fund Balance at Beginning of Year 5,561 5,561 5,561 0<br />
Fund Balance at End of Year $5,000 $5,000 $5,000 $0<br />
- 73 -
<strong>Joseph</strong> <strong>Badger</strong> <strong>Local</strong> School District<br />
Schedule of Revenues, Expenditures and Changes<br />
In Fund Balance - Budget (Non-GAAP) and Actual<br />
District Managed Student Activity Fund<br />
For the Fiscal Year Ended June 30, <strong>2001</strong><br />
Variance with<br />
Budgeted Amounts<br />
Final Budget<br />
Favorable<br />
Original Final Actual (Unfavorable)<br />
Revenues<br />
Extracurricular Activities $26,544 $31,831 $31,831 $0<br />
Contributions and Donations 5,000 7,531 7,531 0<br />
Total Revenues 31,544 39,362 39,362 0<br />
Expenditures<br />
Current:<br />
Extracurricular Activities:<br />
Academic and Subject Oriented<br />
Activities:<br />
Purchased Services 0 1,475 1,475 0<br />
Materials and Supplies 2,830 6,685 6,685 0<br />
Total Academic and Subject Oriented<br />
Activities 2,830 8,160 8,160 0<br />
Sports Oriented Activities:<br />
Purchased Services 5,731 17,872 17,872 0<br />
Materials and Supplies 14,197 17,085 17,085 0<br />
Capital Outlay - New 0 2,400 2,400 0<br />
Total Sports Oriented Activities 19,928 37,357 37,357 0<br />
Total Expenditures 22,758 45,517 45,517 0<br />
Excess of Revenues Over (Under) Expenditures 8,786 (6,155) (6,155) 0<br />
Other Financing Sources<br />
Operating Transfers In 5,000 13,000 13,000 0<br />
Net Change in Fund Balance 13,786 6,845 6,845 0<br />
Fund Balance at Beginning of Year 12,894 12,894 12,894 0<br />
Fund Balance at End of Year $26,680 $19,739 $19,739 $0<br />
- 74 -
<strong>Joseph</strong> <strong>Badger</strong> <strong>Local</strong> School District<br />
Schedule of Revenues, Expenditures and Changes<br />
In Fund Balance - Budget (Non-GAAP) and Actual<br />
Disadvantaged Pupil Fund<br />
For the Fiscal Year Ended June 30, <strong>2001</strong><br />
Variance with<br />
Budgeted Amounts<br />
Final Budget<br />
Favorable<br />
Original Final Actual (Unfavorable)<br />
Revenues<br />
Intergovernmental $10,811 $10,811 $10,811 $0<br />
Expenditures<br />
Current:<br />
Special Instruction:<br />
Purchased Services 0 10,811 10,811 0<br />
Net Change in Fund Balance 10,811 0 0 0<br />
Fund Balance at Beginning of Year 0 0 0 0<br />
Fund Balance at End of Year $10,811 $0 $0 $0<br />
- 75 -
<strong>Joseph</strong> <strong>Badger</strong> <strong>Local</strong> School District<br />
Schedule of Revenues, Expenditures and Changes<br />
In Fund Balance - Budget (Non-GAAP) and Actual<br />
School Net Professional Development Fund<br />
For the Fiscal Year Ended June 30, <strong>2001</strong><br />
Variance with<br />
Budgeted Amounts<br />
Final Budget<br />
Favorable<br />
Original Final Actual (Unfavorable)<br />
Revenues<br />
Intergovernmental $2,000 $4,000 $4,000 $0<br />
Expenditures<br />
Current:<br />
Instruction:<br />
Regular:<br />
Purchased Services 0 4,786 4,786 0<br />
Administration:<br />
Purchased Services 427 427 427 0<br />
Total Expenditures 427 5,213 5,213 0<br />
Net Change in Fund Balance 1,573 (1,213) (1,213) 0<br />
Fund Balance at Beginning of Year 0 4,000 4,000 0<br />
Fund Balance at End of Year $1,573 $2,787 $2,787 $0<br />
- 76 -
<strong>Joseph</strong> <strong>Badger</strong> <strong>Local</strong> School District<br />
Schedule of Revenues, Expenditures and Changes<br />
In Fund Balance - Budget (Non-GAAP) and Actual<br />
Summer Intervention Fund<br />
For the Fiscal Year Ended June 30, <strong>2001</strong><br />
Variance with<br />
Budgeted Amounts<br />
Final Budget<br />
Favorable<br />
Original Final Actual (Unfavorable)<br />
Revenues<br />
Intergovernmental $5,000 $9,375 $9,375 $0<br />
Expenditures<br />
Current:<br />
Instruction:<br />
Regular:<br />
Salaries and Wages 0 1,732 1,732 0<br />
Materials and Supplies 1,275 71 71 0<br />
Capital Outlay - New 15,000 11,414 11,414 0<br />
Total Regular 16,275 13,217 13,217 0<br />
Support Services:<br />
Pupils:<br />
Salaries and Wages 0 1,929 1,929 0<br />
Total Expenditures 16,275 15,146 15,146 0<br />
Net Change in Fund Balance (11,275) (5,771) (5,771) 0<br />
Fund Balance at Beginning of Year 16,810 16,810 16,810 0<br />
Prior Year Encumbrances Appropriated 475 475 475 0<br />
Fund Balance at End of Year $6,010 $11,514 $11,514 $0<br />
- 77 -
<strong>Joseph</strong> <strong>Badger</strong> <strong>Local</strong> School District<br />
Schedule of Revenues, Expenditures and Changes<br />
In Fund Balance - Budget (Non-GAAP) and Actual<br />
Safe <strong>Schools</strong> Fund<br />
For the Fiscal Year Ended June 30, <strong>2001</strong><br />
Variance with<br />
Budgeted Amounts<br />
Final Budget<br />
Favorable<br />
Original Final Actual (Unfavorable)<br />
Revenues<br />
Intergovernmental $1,239 $1,239 $1,239 $0<br />
Expenditures<br />
Current:<br />
Support Services:<br />
Pupils:<br />
Purchased Services 1,200 1,195 1,195 0<br />
Net Change in Fund Balance 39 44 44 0<br />
Fund Balance at Beginning of Year 44 44 44 0<br />
Fund Balance at End of Year $83 $88 $88 $0<br />
- 78 -
<strong>Joseph</strong> <strong>Badger</strong> <strong>Local</strong> School District<br />
Schedule of Revenues, Expenditures and Changes<br />
In Fund Balance - Budget (Non-GAAP) and Actual<br />
Title VI-B Fund<br />
For the Fiscal Year Ended June 30, <strong>2001</strong><br />
Variance with<br />
Budgeted Amounts<br />
Final Budget<br />
Favorable<br />
Original Final Actual (Unfavorable)<br />
Revenues<br />
Intergovernmental $58,695 $58,695 $58,695 $0<br />
Expenditures<br />
Current:<br />
Instruction:<br />
Special:<br />
Purchased Services 58,695 58,695 58,695 0<br />
Net Change in Fund Balance 0 0 0 0<br />
Fund Balance at Beginning of Year 0 0 0 0<br />
Fund Balance at End of Year $0 $0 $0 $0<br />
- 79 -
<strong>Joseph</strong> <strong>Badger</strong> <strong>Local</strong> School District<br />
Schedule of Revenues, Expenditures and Changes<br />
In Fund Balance - Budget (Non-GAAP) and Actual<br />
Title I Fund<br />
For the Fiscal Year Ended June 30, <strong>2001</strong><br />
Variance with<br />
Budgeted Amounts<br />
Final Budget<br />
Favorable<br />
Original Final Actual (Unfavorable)<br />
Revenues<br />
Intergovernmental $106,741 $131,810 $131,810 $0<br />
Expenditures<br />
Current:<br />
Instruction:<br />
Special:<br />
Salaries and Wages 73,000 77,418 77,418 0<br />
Fringe Benefits 19,800 25,069 25,069 0<br />
Purchased Services 0 964 964 0<br />
Materials and Supplies 67 2,293 2,293 0<br />
Capital Outlay - New 0 2,198 2,198 0<br />
Total Expenditures 92,867 107,942 107,942 0<br />
Net Change in Fund Balance 13,874 23,868 23,868 0<br />
Fund Balance at Beginning of Year 1,361 1,361 1,361 0<br />
Prior Year Encumbrances Appropriated 67 67 67 0<br />
Fund Balance at End of Year $15,302 $25,296 $25,296 $0<br />
- 80 -
<strong>Joseph</strong> <strong>Badger</strong> <strong>Local</strong> School District<br />
Schedule of Revenues, Expenditures and Changes<br />
In Fund Balance - Budget (Non-GAAP) and Actual<br />
Title VI Fund<br />
For the Fiscal Year Ended June 30, <strong>2001</strong><br />
Variance with<br />
Budgeted Amounts<br />
Final Budget<br />
Favorable<br />
Original Final Actual (Unfavorable)<br />
Revenues<br />
Intergovernmental $6,190 $7,046 $7,046 $0<br />
Expenditures<br />
Current:<br />
Instruction:<br />
Regular:<br />
Purchased Services 700 700 700 0<br />
Capital Outlay - New 5,490 6,346 6,346 0<br />
Total Expenditures 6,190 7,046 7,046 0<br />
Net Change in Fund Balance 0 0 0 0<br />
Fund Balance at Beginning of Year 0 0 0 0<br />
Fund Balance at End of Year $0 $0 $0 $0<br />
- 81 -
<strong>Joseph</strong> <strong>Badger</strong> <strong>Local</strong> School District<br />
Schedule of Revenues, Expenditures and Changes<br />
In Fund Balance - Budget (Non-GAAP) and Actual<br />
Title VI-R Fund<br />
For the Fiscal Year Ended June 30, <strong>2001</strong><br />
Variance with<br />
Budgeted Amounts<br />
Final Budget<br />
Favorable<br />
Original Final Actual (Unfavorable)<br />
Revenues<br />
Intergovernmental $25,401 $25,401 $25,401 $0<br />
Expenditures<br />
Current:<br />
Instruction:<br />
Regular:<br />
Salaries and Wages 23,000 23,609 23,609 0<br />
Fringe Benefits 5,066 6,871 6,871 0<br />
Total Expenditures 28,066 30,480 30,480 0<br />
Net Change in Fund Balance (2,665) (5,079) (5,079) 0<br />
Fund Balance at Beginning of Year 5,079 5,079 5,079 0<br />
Fund Balance at End of Year $2,414 $0 $0 $0<br />
- 82 -
<strong>Joseph</strong> <strong>Badger</strong> <strong>Local</strong> School District<br />
Schedule of Revenues, Expenditures and Changes<br />
In Fund Balance - Budget (Non-GAAP) and Actual<br />
Drug Free Fund<br />
For the Fiscal Year Ended June 30, <strong>2001</strong><br />
Variance with<br />
Budgeted Amounts<br />
Final Budget<br />
Favorable<br />
Original Final Actual (Unfavorable)<br />
Revenues<br />
Intergovernmental $5,186 $5,186 $5,186 $0<br />
Expenditures<br />
Current:<br />
Instruction:<br />
Regular:<br />
Purchased Services 5,186 5,186 5,186 0<br />
Net Change in Fund Balance 0 0 0 0<br />
Fund Balance at Beginning of Year 0 0 0 0<br />
Fund Balance at End of Year $0 $0 $0 $0<br />
- 83 -
<strong>Joseph</strong> <strong>Badger</strong> <strong>Local</strong> School District<br />
Schedule of Revenues, Expenditures and Changes<br />
In Fund Balance - Budget (Non-GAAP) and Actual<br />
Eisenhower Fund<br />
For the Fiscal Year Ended June 30, <strong>2001</strong><br />
Variance with<br />
Budgeted Amounts<br />
Final Budget<br />
Favorable<br />
Original Final Actual (Unfavorable)<br />
Revenues<br />
Intergovernmental $5,159 $5,159 $5,159 $0<br />
Expenditures<br />
Current:<br />
Instruction:<br />
Regular:<br />
Purchased Services 4,068 5,159 5,159 0<br />
Net Change in Fund Balance 1,091 0 0 0<br />
Fund Balance at Beginning of Year 0 0 0 0<br />
Fund Balance at End of Year $1,091 $0 $0 $0<br />
- 84 -
<strong>Joseph</strong> <strong>Badger</strong> <strong>Local</strong> School District<br />
Schedule of Revenues, Expenditures and Changes<br />
In Fund Balance - Budget (Non-GAAP) and Actual<br />
Debt Service Fund<br />
For the Fiscal Year Ended June 30, <strong>2001</strong><br />
Variance with<br />
Budgeted Amounts<br />
Final Budget<br />
Favorable<br />
Original Final Actual (Unfavorable)<br />
Revenues<br />
Interest $2,379 $795 $795 $0<br />
Expenditures<br />
Debt Service:<br />
Principal Retirement 20,000 20,000 20,000 0<br />
Interest and Fiscal Charges 725 725 725 0<br />
Total Expenditures 20,725 20,725 20,725 0<br />
Net Change in Fund Balance (18,346) (19,930) (19,930) 0<br />
Other Financing Uses:<br />
Operating Transfers Out 0 (828) (828) 0<br />
Net Change in Fund Balance (18,346) (20,758) (20,758) 0<br />
Fund Balance Beginning of Year 20,758 20,758 20,758 0<br />
Fund Balance End of Year $2,412 $0 $0 $0<br />
See accompanying notes to the basic financial statements<br />
- 85 -
<strong>Joseph</strong> <strong>Badger</strong> <strong>Local</strong> School District<br />
Schedule of Revenues, Expenditures and Changes<br />
In Fund Balance - Budget (Non-GAAP) and Actual<br />
Permanent Improvement Fund<br />
For the Fiscal Year Ended June 30, <strong>2001</strong><br />
Variance with<br />
Budgeted Amounts<br />
Final Budget<br />
Favorable<br />
Original Final Actual (Unfavorable)<br />
Revenues<br />
Taxes $54,910 $57,077 $57,077 $0<br />
Intergovernmental 5,700 5,730 5,730 0<br />
Total Revenues 60,610 62,807 62,807 0<br />
Expenditures<br />
Current:<br />
Support Services:<br />
Fiscal:<br />
Other 500 109 109 0<br />
Business:<br />
Other 500 851 851 0<br />
Total Support Services 1,000 960 960 0<br />
Capital Outlay:<br />
Facilities Acquisition and Construction Services:<br />
Construction Services:<br />
Site Improvement Services:<br />
Purchased Services 25,000 0 0 0<br />
Building Improvement Services:<br />
Purchased Services 2,700 2,700 2,700 0<br />
Capital Outlay - New 25,000 24,051 24,051 0<br />
Total Building Improvement Services 27,700 26,751 26,751 0<br />
Total Capital Outlay 52,700 26,751 26,751 0<br />
Total Expenditures 53,700 27,711 27,711 0<br />
- 86 -
<strong>Joseph</strong> <strong>Badger</strong> <strong>Local</strong> School District<br />
Schedule of Revenues, Expenditures and Changes<br />
In Fund Balance - Budget (Non-GAAP) and Actual<br />
School Net Fund<br />
For the Fiscal Year Ended June 30, <strong>2001</strong><br />
Variance with<br />
Budgeted Amounts<br />
Final Budget<br />
Favorable<br />
Original Final Actual (Unfavorable)<br />
Revenues<br />
Intergovernmental $54,500 $66,500 $66,500 $0<br />
Expenditures<br />
Current:<br />
Instruction:<br />
Regular:<br />
Materials and Supplies 3,650 20,845 20,845 0<br />
Capital Outlay - New 0 43,244 43,244 0<br />
Total Instruction 3,650 64,089 64,089 0<br />
Support Services:<br />
Central:<br />
Capital Outlay - New 0 12,000 12,000 0<br />
Total Expenditures 3,650 76,089 76,089 0<br />
Net Change in Fund Balance 50,850 (9,589) (9,589) 0<br />
Fund Balance at Beginning of Year 12,412 12,412 12,412 0<br />
Prior Year Encumbrances Appropriated 3,650 3,650 3,650 0<br />
Fund Balance at End of Year $66,912 $6,473 $6,473 $0<br />
- 87 -
<strong>Joseph</strong> <strong>Badger</strong> <strong>Local</strong> School District<br />
Schedule of Revenues, Expenditures and Changes<br />
In Fund Balance - Budget (Non-GAAP) and Actual<br />
Tech Equity Fund<br />
For the Fiscal Year Ended June 30, <strong>2001</strong><br />
Variance with<br />
Budgeted Amounts<br />
Final Budget<br />
Favorable<br />
Original Final Actual (Unfavorable)<br />
Revenues<br />
Intergovernmental $0 $11,468 $11,468 $0<br />
Expenditures<br />
Current:<br />
Support Services:<br />
Capital Outlay - New 0 11,468 11,468 0<br />
Capital Outlay - Replacement 10,005 10,005 10,005 0<br />
Total Expenditures 10,005 21,473 21,473 0<br />
Net Change in Fund Balance (10,005) (10,005) (10,005) 0<br />
Fund Balance at Beginning of Year 0 0 0 0<br />
Prior Year Encumbrances Appropriated 10,005 10,005 10,005 0<br />
Fund Balance at End of Year $0 $0 $0 $0<br />
- 88 -
<strong>Joseph</strong> <strong>Badger</strong> <strong>Local</strong> School District<br />
Schedule of Revenues, Expenses and Changes<br />
In Fund Balance - Budget (Non-GAAP) and Actual<br />
Food Service Fund<br />
For the Fiscal Year Ended June 30, <strong>2001</strong><br />
Variance with<br />
Budgeted Amounts<br />
Final Budget<br />
Favorable<br />
Original Final Actual (Unfavorable)<br />
Revenues<br />
Sales $209,750 $192,145 $192,145 $0<br />
Interest 850 284 284 0<br />
Operating Grants 100,000 95,285 95,285 0<br />
Total Revenues 310,600 287,714 287,714 0<br />
Expenses<br />
Salaries:<br />
Food Service Operations 95,647 96,691 96,691 0<br />
Fringe Benefits:<br />
Food Service Operations 63,950 71,322 71,322 0<br />
Purchased Services:<br />
Food Service Operations 15,000 13,087 13,087 0<br />
Materials and Supplies:<br />
Food Service Operations 157,000 113,641 113,641 0<br />
Capital Outlay:<br />
Capital Outlay - Replacement:<br />
Food Service Operations 4,313 4,313 4,313 0<br />
Other:<br />
Food Service Operations 608 676 676 0<br />
Total Expenses 336,518 299,730 299,730 0<br />
Net Change in Fund Balance (25,918) (12,016) (12,016) 0<br />
Fund Balance Beginning of Year 28,367 28,367 28,367 0<br />
Fund Balance End of Year 2,449 16,351 16,351 0<br />
- 89 -
<strong>Joseph</strong> <strong>Badger</strong> <strong>Local</strong> School District<br />
Schedule of Revenues, Expenses and Changes<br />
In Fund Equity - Budget (Non-GAAP) and Actual<br />
Scholarship Trust Fund<br />
For the Fiscal Year Ended June 30, <strong>2001</strong><br />
Variance with<br />
Budgeted Amounts<br />
Final Budget<br />
Favorable<br />
Original Final Actual (Unfavorable)<br />
Revenues<br />
Interest $850 $956 $956 $0<br />
Expenses<br />
Other:<br />
Community Services 850 876 876 0<br />
Net Change in Fund Balance 0 80 80 0<br />
Fund Balance Beginning of Year 15,793 15,793 15,793 0<br />
Fund Balance End of Year $15,793 $15,873 $15,873 $0<br />
- 90 -
<strong>Joseph</strong> <strong>Badger</strong> <strong>Local</strong> School District<br />
Statistical Section<br />
The following statistical tables reflect social and economic data, financial trends and<br />
fiscal capacity of the School District<br />
- S1 -
<strong>Joseph</strong> <strong>Badger</strong> <strong>Local</strong> School District<br />
General Governmental<br />
Revenues by Source and Expenses/Expenditures by Function(1)<br />
Last Ten Fiscal Years(2)<br />
<strong>2001</strong> 2000<br />
Full Modified Full Modified<br />
Accrual Accrual Accrual Accrual 1999<br />
Program Revenues<br />
Charges for Services $83,505 N/A $53,581 N/A N/A<br />
Operating Grants and Contributions 295,623 N/A 302,526 N/A N/A<br />
Capital Grants and Contributions 79,807 N/A 32,851 N/A N/A<br />
General Revenues<br />
Taxes $2,556,186 $2,662,042 $2,632,853 $2,508,773 $2,241,953<br />
Intergovernmental 4,300,266 4,682,584 4,133,565 4,399,456 3,890,414<br />
Interest 159,079 159,079 145,316 145,316 109,592<br />
Tuition and Fees 0 30,594 0 23,142 22,561<br />
Extracurricular Activities 0 60,198 0 47,629 0<br />
Charges for Services 0 1,455 0 7,935 4,144<br />
Gifts and Donations 0 9,370 0 31,361 1,693<br />
Miscellaneous 38,506 38,506 55,765 55,765 1,163<br />
Total $7,054,037 $7,643,828 $6,967,499 $7,219,377 $6,271,520<br />
Expenses/Expenditures<br />
Current:<br />
Instruction:<br />
Regular $3,578,852 $3,566,085 $3,369,166 $3,415,766 $3,083,849<br />
Special 587,040 584,370 371,262 375,925 480,366<br />
Vocational 50,628 50,628 51,646 51,646 38,677<br />
Adult/Continuing 0 0 0 0 298<br />
Other 0 0 0 0 0<br />
Support Services:<br />
Pupils 264,410 264,151 252,287 252,029 189,608<br />
Instructional Staff 168,253 171,924 122,148 117,031 116,663<br />
Board of Education 136,730 136,730 73,278 73,278 93,661<br />
Administration 764,260 756,221 663,633 690,388 658,573<br />
Fiscal 235,506 246,416 162,282 165,827 158,635<br />
Business 0 0 13,312 13,312 0<br />
Operation and 0<br />
Maintenance of Plant 606,097 582,599 542,027 512,193 496,086<br />
Pupil Transportation 581,336 511,125 534,694 687,102 429,756<br />
Central 58,765 65,241 59,176 59,134 32,632<br />
Operation of Non-<br />
Instructional Services 384 0 5,917 5,642 0<br />
Extracurricular Activities 178,163 177,866 164,067 162,593 108,433<br />
Capital Outlay 0 434,249 0 110,140 3,914<br />
Debt Service 604 20,725 2,054 22,175 0<br />
Total $7,211,028 $7,568,330 $6,386,949 $6,714,181 $5,891,150<br />
Source: School District Financial Records<br />
(1) Includes General, Special Revenue, Capital Projects and Debt Service Funds for modified accrual<br />
and all governmental activities for full accrual<br />
(2) 1996 through <strong>2001</strong> reported on a GAAP Basis; All others on Cash Basis.<br />
- S2 -
1998 1997 1996 1995 1994 1993 1992<br />
N/A N/A N/A N/A N/A N/A N/A<br />
N/A N/A N/A N/A N/A N/A N/A<br />
N/A N/A N/A N/A N/A N/A N/A<br />
$2,245,706 $2,199,996 $2,141,869 $1,858,151 $1,524,755 $1,564,774 $1,531,956<br />
3,577,581 3,411,258 3,312,296 2,877,040 2,867,342 2,821,664 2,633,559<br />
106,023 89,767 61,823 48,112 29,016 23,247 43,774<br />
20,655 12,155 2,428 14,351 4,523 4,957 8,898<br />
0 0 0 0 0 0 0<br />
463 462 238 0 0 0 0<br />
460 740 1,435 0 0 0 0<br />
33,634 10 7,979 15,349 20,066 3,210 2,221<br />
$5,984,522 $5,714,388 $5,528,067 $4,813,003 $4,445,702 $4,417,852 $4,220,408<br />
$3,191,030 $2,999,696 $2,771,499 $2,400,699 $2,364,623 $2,450,417 $2,552,231<br />
213,896 241,043 173,832 163,499 220,937 116,002 112,509<br />
114,210 113,268 114,914 118,006 145,201 147,624 138,494<br />
862 0 0 0 0 0 0<br />
0 0 0 5,227 1,842 5,409 10,840<br />
121,543 137,951 119,497 109,520 86,300 73,892 93,177<br />
101,547 99,117 89,944 106,099 106,174 69,107 85,328<br />
22,540 32,697 107,051 16,272 20,097 15,724 15,198<br />
609,947 606,953 572,405 578,787 519,603 457,654 460,736<br />
128,076 120,882 110,785 105,003 100,465 100,403 82,913<br />
0 2,592 0 0 0 0 0<br />
490,689 538,129 444,897 436,773 427,624 426,682 399,494<br />
506,864 614,100 430,925 487,035 436,586 424,261 507,195<br />
33,625 18,769 0 0 0 71,494 81,999<br />
0 0 0 0 0 0 0<br />
95,730 90,412 85,666 74,508 72,540 65,302 70,029<br />
0 0 330 875 185 250 5,051<br />
0 0 3,998 0 0 0 0<br />
$5,630,558 $5,615,609 $5,025,743 $4,602,303 $4,502,177 $4,424,221 $4,615,194<br />
- S3 -
<strong>Joseph</strong> <strong>Badger</strong> <strong>Local</strong> School District<br />
Property Tax Levies and Collections<br />
Last Seven Calendar Years (1)<br />
Total Tax<br />
Percent of<br />
Collections<br />
Outstanding<br />
Total Percent of As a Outstanding Delinquent Taxes<br />
Tax Current Current Taxes Delinquent Total Percent of Delinquent To Total<br />
Year (2) Levy Collections Collected Collections Collections Current Levy Taxes (3) Tax Levy<br />
2000 $2,926,898 $2,834,162 96.83% $70,844 $2,905,006 99.25% $195,059 6.66%<br />
1999 2,598,515 2,553,491 98.27 90,952 2,644,443 101.77 173,009 6.66<br />
1998 2,523,387 2,463,731 97.64 80,130 2,543,861 100.81 180,377 7.15<br />
1997 2,503,458 2,441,668 97.53 135,535 2,577,203 102.95 212,682 8.50<br />
1996 2,448,537 2,372,321 96.89 93,700 2,466,021 100.71 240,382 9.82<br />
- S4 -<br />
1995 2,427,226 2,338,370 96.34 75,028 2,413,398 99.43 190,762 7.86<br />
1994 1,861,318 1,785,659 95.94 115,739 1,901,398 102.15 189,840 10.20<br />
Source: Trumbull County Auditor - Data is presented on a calendar year basis because this is the manner in which the information is maintained<br />
by the County Auditor.<br />
(1) Information was not available prior to 1994.<br />
(2) Represents collection year. <strong>2001</strong> information cannot be presented because all collections have not been made by June 30.<br />
(3) This amount cannot be calculated based on other information in this statistical table because of<br />
retroactive additions and reductions which are brought on in one lump sum.
<strong>Joseph</strong> <strong>Badger</strong> <strong>Local</strong> School District<br />
Assessed and Estimated Actual Value of Taxable Property<br />
Last Ten Calendar Years<br />
Real Property Public Utility Property Tangible Personal Property Total<br />
Estimated Estimated Estimated Estimated<br />
Assessed Actual Assessed Actual Assessed Actual Assessed Actual<br />
Year Value Value (1) Value Value (1) Value Value (1) Value Value (1) Ratio<br />
<strong>2001</strong> $77,973,410 $222,781,171 $5,726,310 $6,507,170 $7,890,532 $31,562,128 $91,590,252 $260,850,469 35%<br />
2000 76,319,190 218,054,829 6,930,500 7,875,568 6,509,919 26,039,676 89,759,609 251,970,073 36<br />
1999 58,327,417 166,649,763 6,496,850 7,382,784 5,292,262 21,169,048 70,116,529 195,201,595 36<br />
1998 57,765,271 165,043,631 6,681,770 7,592,920 5,174,311 20,697,244 69,621,352 193,333,796 36<br />
1997 57,087,115 163,106,043 6,784,250 7,709,375 4,651,406 18,605,624 68,522,771 189,421,042 36<br />
- S5 -<br />
1996 51,706,717 147,733,477 6,905,330 7,846,966 4,397,059 17,588,236 63,009,106 173,168,679 36<br />
1995 51,036,902 145,819,720 7,192,750 8,173,580 4,145,467 16,581,868 62,375,119 170,575,168 37<br />
1994 50,240,150 143,543,286 7,508,140 8,531,977 4,145,467 16,581,868 61,893,757 168,657,131 37<br />
1993 44,566,232 127,332,091 7,470,750 8,489,489 4,387,205 17,548,820 56,424,187 153,370,400 37<br />
1992 44,556,250 127,303,571 7,176,720 8,155,364 4,387,205 17,548,820 56,120,175 153,007,755 37<br />
Source: Trumbull County Auditor - Data is presented on a calendar year basis because that is the manner in which the information is maintained<br />
(1) Assessed estimated true value is calculated by dividing the assessed value by the assessment percentage.<br />
The percentages used in the calculation are as follows:<br />
Real Property - 35 percent<br />
Public Utility Tangible - 88 percent<br />
Tangible Personal Property - 25 percent of actual value for 1995 through <strong>2001</strong>
<strong>Joseph</strong> <strong>Badger</strong> <strong>Local</strong> School District<br />
Property Tax Rates - Direct and Overlapping Governments<br />
(per $1,000 Assessed Valuation)<br />
Last Ten Calendar Years<br />
Debt Service<br />
Gustavus Hartford Kinsman Vernon Included in Total Levy<br />
School County Township Township Township Township JVS<br />
Year Levy Levy Levy Levy Levy Levy Levy School County Townships Total<br />
<strong>2001</strong> $38.40 $10.35 $12.20 $5.80 $14.00 $7.70 $2.40 $0.00 $0.00 $0.00 $0.00<br />
2000 38.41 10.35 9.20 5.80 14.00 7.70 2.40 0.00 0.00 0.00 0.00<br />
1999 41.58 9.30 9.20 5.80 14.00 7.70 2.40 0.00 0.00 0.00 0.00<br />
1998 35.25 9.30 9.20 5.80 14.00 7.70 2.40 0.36 0.00 0.00 0.36<br />
1997 35.27 9.30 9.20 5.80 14.00 6.20 2.40 0.20 0.00 0.00 0.20<br />
- S6 -<br />
1996 37.39 9.30 9.20 5.80 13.00 6.20 2.40 0.50 0.00 0.00 0.50<br />
1995 37.62 9.30 9.20 7.80 13.00 6.20 2.40 0.60 0.00 0.00 0.60<br />
1994 40.00 9.30 6.20 7.80 13.00 6.20 2.40 0.00 0.00 0.00 0.00<br />
1993 40.00 9.30 6.20 7.80 13.00 6.20 2.40 0.00 0.00 0.00 0.00<br />
1992 40.00 9.80 6.50 8.10 13.30 3.50 2.40 0.38 0.00 0.00 0.38<br />
Source: Trumbull County Auditor - Data is presented on a calendar year basis because that is the manner in which the information is maintained
<strong>Joseph</strong> <strong>Badger</strong> <strong>Local</strong> School District<br />
Ratio of Net General Obligation Bonded Debt to Assessed<br />
Value and Net Bonded Debt Per Capita<br />
Last Ten Years<br />
General Ratio of Net Debt<br />
Obligation Debt to Per<br />
Year Bonded Debt (1) Assessed Value Population (2) Assessed Value Capita<br />
<strong>2001</strong> $20,000 $91,590,252 7,066 0.02% $2.83<br />
2000 22,175 89,759,609 7,066 0.02 3.14<br />
1999 23,625 70,116,529 7,066 0.03 3.34<br />
1998 25,075 69,621,352 6,977 0.04 3.59<br />
1997 26,525 68,522,771 6,977 0.04 3.80<br />
1996 33,156 63,009,106 6,977 0.05 4.75<br />
1995 34,969 62,375,119 6,977 0.06 5.01<br />
1994 36,781 61,893,757 6,977 0.06 5.27<br />
1993 64,219 56,424,187 6,977 0.11 9.20<br />
1992 67,281 56,120,175 6,977 0.12 9.64<br />
Source: Trumbull County Auditor and School District Financial Records<br />
(1) Represents general obligation bonds payable from property taxes.<br />
(2) Estimate provided by State Census Bureau.<br />
- S7 -
<strong>Joseph</strong> <strong>Badger</strong> <strong>Local</strong> School District<br />
Computation of Legal Debt Margin<br />
June 30, <strong>2001</strong><br />
Assessed Valuation $91,590,252<br />
Overall Debt Limit - 9% of Assessed Value (1) $8,243,123<br />
Amount of Debt Applicable to Debt Limit:<br />
General Obligation Bonds 0<br />
Less: Amount Available in Debt Service Fund 0<br />
Net Bonded Debt 0<br />
Overall Debt Margin $8,243,123<br />
Unvoted Debt Limit - .10% of Assessed Value (1) $91,590<br />
Amount of Debt Applicable 0<br />
Unvoted Debt Margin $91,590<br />
Source: Trumbull County Auditor and School District Financial Records<br />
(1) Ohio Bond Law sets an overall limit of 9% for all debt<br />
and 1/10 of 1% for unvoted debt.<br />
- S8 -
<strong>Joseph</strong> <strong>Badger</strong> <strong>Local</strong> School District<br />
Computation of Direct and Overlapping General Obligation Bonded Debt<br />
December 31, 2000<br />
General Percentage Amount<br />
Obligation Debt Applicable to Applicable to<br />
Jurisdiction Outstanding (1) School District (2) School District<br />
<strong>Joseph</strong> <strong>Badger</strong> <strong>Local</strong> School District $0 100.00% $0<br />
Trumbull County 14,173,619 3.00 425,209<br />
Gustavus Township 0 100.00 0<br />
Hartford Township 0 100.00 0<br />
Kinsman Township 0 100.00 0<br />
Vernon Township 0 100.00 0<br />
Total $425,209<br />
(1) Represents general obligation bonds payable from property taxes.<br />
(2) Percentages were determined by dividing the assessed valuation of the political<br />
subdivision located within the boundaries of the School District by the total assessed<br />
valuation of the subdivision. The valuations used were for the <strong>2001</strong> collection year.<br />
- S9 -
<strong>Joseph</strong> <strong>Badger</strong> <strong>Local</strong> School District<br />
Ratio of Annual Debt Service Expenditures For<br />
General Obligation Bonded Debt to Total General Governmental Expenditures<br />
Last Ten Fiscal Years<br />
Ratio of Debt<br />
Service to<br />
Total Total Governmental Fund<br />
Debt Governmental Fund Expenditures<br />
Year Principal Interest Service (1) Expenditures (Percentage)<br />
<strong>2001</strong> $20,000 $725 $20,725 $7,568,330 0.27%<br />
2000 20,000 2,175 22,175 6,714,181 0.33<br />
1999 20,000 3,625 23,625 5,891,150 0.40<br />
1998 20,000 5,075 25,075 5,630,558 0.45<br />
1997 20,000 6,525 26,525 5,615,609 0.47<br />
1996 25,000 8,156 33,156 5,025,743 0.66<br />
1995 25,000 9,969 34,969 4,602,303 0.76<br />
1994 25,000 11,781 36,781 4,502,177 0.82<br />
1993 50,000 14,219 64,219 4,424,221 1.45<br />
1992 50,000 17,281 67,281 4,615,194 1.46<br />
Source: School District Financial Records<br />
- S10 -
<strong>Joseph</strong> <strong>Badger</strong> <strong>Local</strong> School District<br />
Demographic Statistics<br />
Last Ten Years<br />
Trumbull Gustavus Hartford Kinsman Vernon<br />
County Township Township Township Township School Unemployment<br />
Year Population (1) Population (2) Population (2) Population (2) Population (2) Enrollment (3) Rate (4)<br />
<strong>2001</strong> 225,116 1,044 2,184 2,126 1,712 1,191 5.1%<br />
2000 225,338 1,044 2,184 2,126 1,712 1,148 5.2<br />
1999 227,069 1,044 2,184 2,126 1,712 1,104 5.5<br />
1998 228,417 1,031 2,157 2,099 1,690 1,104 5.9<br />
1997 228,417 1,031 2,157 2,099 1,690 1,107 5.8<br />
1996 229,805 1,031 2,157 2,099 1,690 1,138 6.1<br />
- S11 -<br />
1995 229,805 1,031 2,157 2,099 1,690 N/A 7.2<br />
1994 229,805 1,031 2,157 2,099 1,690 N/A 8.2<br />
1993 229,805 1,031 2,157 2,099 1,690 N/A 9.8<br />
1992 228,864 1,031 2,157 2,099 1,690 N/A 7.7<br />
(1) Trumbull County Planning Commission<br />
(2) Estimate provided by the State Census Bureau<br />
(3) School District Financial Records<br />
(4) Represents Trumbull County
<strong>Joseph</strong> <strong>Badger</strong> <strong>Local</strong> School District<br />
Property Value and Financial Institution Deposits<br />
Last Ten Years<br />
Financial<br />
Property<br />
Institution<br />
Value<br />
Deposits<br />
Year (Real Estate Only) (1) Banks (2)<br />
<strong>2001</strong> $77,973,410 $136,630,100<br />
2000 76,319,190 156,658,200<br />
1999 58,327,417 157,324,600<br />
1998 57,765,271 154,597,700<br />
1997 57,087,115 111,942,800<br />
1996 51,706,717 149,499,000<br />
1995 51,036,902 125,417,000<br />
1994 50,240,150 111,817,000<br />
1993 44,566,232 99,003,000<br />
1992 44,556,250 80,030,000<br />
Source:<br />
Ohio Bureau of Employment Services<br />
Federal Reserve Bank of Cleveland<br />
(1) Represents assessed value.<br />
(2) Represents all banks headquartered in Trumbull County.<br />
- S12 -
<strong>Joseph</strong> <strong>Badger</strong> <strong>Local</strong> School District<br />
Principal Taxpayers<br />
Real Estate Tax<br />
December 31, 2000<br />
Percent of<br />
Assessed<br />
Total<br />
Name of Taxpayer Value (1) Assessed Value<br />
Target Stamped Product $771,590 0.99%<br />
Richard B. Thompson 471,830 0.61<br />
Consumer's Water 443,860 0.57<br />
W I Miller & Sons 333,180 0.43<br />
Stanwade Metal Products 313,160 0.40<br />
National Dairy Products 312,380 0.40<br />
Harnett, David L. 278,800 0.36<br />
Kepner, Nancy M. 245,830 0.32<br />
Logan, Arlene B. 242,160 0.31<br />
O'Brien, Michael J. 225,660 0.29<br />
Logan, Arthur R. 176,950 0.23<br />
Total $3,815,400 4.89%<br />
Total Real Estate Valuation $77,973,410<br />
Source: Trumbull County Auditor<br />
(1) Assessed values are for the <strong>2001</strong> collection year.<br />
- S13 -
<strong>Joseph</strong> <strong>Badger</strong> <strong>Local</strong> School District<br />
Principal Taxpayers<br />
Tangible Personal Property Tax<br />
December 31, 2000<br />
Percent of<br />
Assessed<br />
Total<br />
Name of Taxpayer Value (1) Assessed Value<br />
Target Stamped Product $2,553,550 32.36%<br />
Kraft Foods, Inc. 2,450,730 31.06<br />
Terry Harmon Motors 706,470 8.95<br />
Stanwade Metal Products 517,610 6.56<br />
Palmer Donavin Manufacturing Co. 448,060 5.68<br />
A G Birrell Co. 256,340 3.25<br />
Cope Farm Equipment 161,920 2.05<br />
Century Shenango Cable 121,860 1.54<br />
Horodyski Brothers Co. 118,180 1.50<br />
Kinsman Land Company 107,820 1.37<br />
Total $7,442,540 94.32%<br />
Total Assessed Value $7,890,532<br />
Source: Trumbull County Auditor<br />
(1) Assessed values are for the <strong>2001</strong> collection year.<br />
- S14 -
<strong>Joseph</strong> <strong>Badger</strong> <strong>Local</strong> School District<br />
Principal Taxpayers<br />
Public Utilities Tax<br />
December 31, 2000<br />
Percent of<br />
Assessed<br />
Total<br />
Name of Taxpayer Value (1) Assessed Value<br />
Ohio Edison Company $3,315,320 58.52%<br />
United Telephone 1,474,870 26.04<br />
Eastern Natural Gas 415,600 7.34<br />
Norfolk Southern Combined 340,700 6.01<br />
CSX Transportation 118,310 2.09<br />
Total $5,664,800 93.11%<br />
Total Assessed Value $5,726,310<br />
Source: Trumbull County Auditor<br />
(1) Assessed values are for the <strong>2001</strong> collection year.<br />
- S15 -
<strong>Joseph</strong> <strong>Badger</strong> <strong>Local</strong> School District<br />
Per Pupil Cost<br />
Last Ten Fiscal Years<br />
Per<br />
Governmental Fund Average Daily Pupil<br />
Year Expenditures (1) Membership Cost<br />
<strong>2001</strong> $7,568,330 1,191 $6,355<br />
2000 6,714,181 1,148 5,849<br />
1999 5,891,150 1,104 5,336<br />
1998 5,630,558 1,104 5,100<br />
1997 5,615,609 1,107 5,073<br />
1996 5,025,743 1,138 4,416<br />
1995 4,602,303 N/A N/A<br />
1994 4,502,177 N/A N/A<br />
1993 4,424,221 N/A N/A<br />
1992 4,615,194 N/A N/A<br />
Source: School District Financial Records.<br />
(1) 1996 through <strong>2001</strong> on Modified Accrual Basis.<br />
All other years based on Cash Basis.<br />
- S16 -
<strong>Joseph</strong> <strong>Badger</strong> <strong>Local</strong> School District<br />
Teacher Education And Experience<br />
June 30, <strong>2001</strong><br />
Number Percentage<br />
of<br />
of<br />
Degree Teachers Total<br />
Bachelor's Degree 44 60%<br />
Master's Degree 29 40%<br />
Total 73 100%<br />
Number Percentage<br />
of<br />
of<br />
Years of Experience Teachers Total<br />
0 - 5 19 26%<br />
6 - 10 4 5%<br />
11 and over 50 68%<br />
73 100%<br />
Source: School District Personnel Records.<br />
- S17 -
This page was intentionally left blank.<br />
- S18 -
We are proud of our diverse agricultural business. We supply our area with an amazing array of healthy food and goods. These<br />
pictures show apples, longhorn cattle, Christmas Trees and grain. Popcorn and maple syrup are some other interesting products<br />
grown in <strong>Badger</strong> Country. We are most known for our high quality dairy farms. Kraft Foods has a plant in our district and Dean<br />
Dairy is nearby.<br />
Bio-treasures are another blessing of our wide-open spaces. <strong>Badger</strong> is home to eagles, bear, coyote, fox, deer, hawks, and owls. We<br />
have a large amount of federal wetlands teeming with wild life. Ducks, geese, herons, muskrat, frogs, turtles and snakes are all at<br />
home here.