Glycogen Storage Disease Type I - Journal of Gastrointestinal and ...
Glycogen Storage Disease Type I - Journal of Gastrointestinal and ...
Glycogen Storage Disease Type I - Journal of Gastrointestinal and ...

You also want an ePaper? Increase the reach of your titles
YUMPU automatically turns print PDFs into web optimized ePapers that Google loves.
<strong>Glycogen</strong> storage disease type I 49<br />
Table II Serum biochemical pr<strong>of</strong>ile on presentation<br />
Case Fasting ALP, U/L AST, U/L ALT, U/L GGT, U/L Total Cholesterol Triglycerides<br />
glucose bilirubin (120 – 230 (20-130<br />
mg/dl) mg/dl)<br />
1 0.28 g/l X1.5 NV X 6 NV X 5 NV N N 268 340<br />
2 0.45 g/l N X 4 NV X 5 NV N N 327 280<br />
3 0.33 g/l N X 12 NV X 11 NV X 4 NV N 339 1100<br />
4 0.42 g/l N X 5 NV X 4 NV X 2 NV N 275 570<br />
5 0.38 g/l N X 2 NV X 3 NV N N 324 740<br />
6 0.44 g/l N X 3 NV X 3 NV N N 306 620<br />
ALP alkaline phosphatase, AST aspartate aminotransferase, ALT alanin aminotransferase, GGT gammaglutamyl transpeptidase, NV<br />
normal value<br />
R<strong>and</strong>om blood glucose levels varied between severe<br />
hypoglycemia <strong>and</strong> normal values, <strong>and</strong> the glycemic pr<strong>of</strong>ile<br />
correlated to feeding schedule showed the occurrence <strong>of</strong><br />
hypoglycemia within 3 to 4 hours after meals in all cases.<br />
The patients underwent fasting challenges that were<br />
concurrent with these findings. The oral glucose tolerance<br />
test showed inappropriate (small) glycemic rise in all cases.<br />
We assessed the insulin levels, correlated to the glycemia<br />
values, finding low levels <strong>of</strong> insulinemia <strong>and</strong> appropriate<br />
values <strong>of</strong> insulin/glycemia ratios in all cases. The glucagon<br />
test showed a glycemia rise <strong>of</strong> 15 – 25 % in two cases, <strong>and</strong><br />
no glycemic response in 4 cases. This helped us to<br />
distinguish GSD I from GSD III, in which patients <strong>of</strong>ten<br />
have an increased serum glucose after glucagon<br />
administration, with the exception <strong>of</strong> prolonged fasting, when<br />
patients with GSD III lose their ability to respond to<br />
glucagon. Having no access to enzymatic diagnosis in our<br />
country, those analyses have been strong arguments for<br />
the clinical type <strong>of</strong> GSD. The results <strong>of</strong> the fasting challenges<br />
are shown in Table III.<br />
Table III Results <strong>of</strong> initial fasting challenge<br />
Time to Fasting challenge Time to<br />
Case hypogly- Glucagon response lactic<br />
cemia in fed state acidosis<br />
1 3.0 Negative Positive<br />
2 3.5 Negative Positive<br />
3 3.5 Negative Positive<br />
4 4 Glycemia rise <strong>of</strong> 15% Positive<br />
5 3 Negative Positive<br />
6 3.5 Glycemia rise <strong>of</strong> 25% Positive<br />
In the evaluation protocol we included the assessment<br />
<strong>of</strong> hypoglycemia consequences on the central nervous<br />
system. Clinically, all patients were within normal for age<br />
regarding psychomotor development. The EEG showed no<br />
changes consistent with brain damage. The psychological<br />
evaluation was also normal.<br />
Imaging studies consisted <strong>of</strong> ultrasonographic<br />
evaluation <strong>and</strong> CT scan. Ultrasonography showed marked<br />
homogeneous hepatomegaly with intense hyperechogenicity,<br />
no splenic abnormalities; the kidneys were enlarged<br />
in three cases (age between 4 <strong>and</strong> 7 years), all <strong>of</strong> them also<br />
having increased glomerular filtration rate. There were no<br />
signs <strong>of</strong> portal hypertension in any <strong>of</strong> the cases. The CT<br />
scan was performed in 3 cases, showing massive<br />
homogeneous enlargement <strong>of</strong> the liver, with low contrast<br />
enhancement.<br />
Three cases had delayed bone maturation.<br />
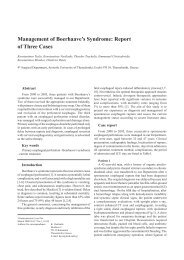
The percutaneous liver biopsy showed glycogen-laden<br />
hepatocytes in PAS staining in all cases, establishing the<br />
diagnosis <strong>of</strong> GSD (Fig.2). Sudan stain showed markedly<br />
increased fat in the liver. There was no evidence <strong>of</strong> fibrosis<br />
in the liver tissue. The bone marrow showed no pathologic<br />
elements in any <strong>of</strong> the cases.<br />
The association <strong>of</strong> massive liver enlargement, rapid onset<br />
<strong>of</strong> hypoglycemia 3 to 4 hours after meals, elevated lactic<br />
acid levels <strong>and</strong> marked hypertriglyceridemia was considered<br />
sufficient to establish the diagnosis <strong>of</strong> GSD Ia in four cases,<br />
The triglyceride values were elevated in all cases but at<br />
different degrees: 200 – 500 mg/dl in 2 cases, 500 – 1000 mg/<br />
dl in 3 cases, <strong>and</strong> more than 1000 mg/dl in one case, accompanied<br />
by prolonged bleeding time due to impaired platelet<br />
function as a consequence <strong>of</strong> hypertriglyceridemia (1).<br />
Uric acid levels were normal at diagnosis in all patients.<br />
The lactate levels increased dramatically with hypoglycemia<br />
<strong>and</strong> glucagon administration <strong>and</strong> decreased following<br />
administration <strong>of</strong> glucose. Ketosis was quantified in urine<br />
at 1+ in 4 cases <strong>and</strong> 2+ in 2 cases. Four <strong>of</strong> the patients (cases<br />
3-6) had increased glomerular filtration rate, with normal<br />
blood urea nitrogen. The youngest patients had no evidence<br />
<strong>of</strong> renal involvement at admission.<br />
Fig.2 Case 3: Liver tissue, optic microscopy: glycogen laden<br />
hepatocytes (PAS stain).