MAKETA po korektœre 2003
MAKETA po korektœre 2003
MAKETA po korektœre 2003

You also want an ePaper? Increase the reach of your titles
YUMPU automatically turns print PDFs into web optimized ePapers that Google loves.
ISSN 1335-8421 Acta Med Mart <strong>2003</strong>, 3(1)<br />
ACTA MEDICA<br />
MARTINIANA<br />
Journal for Biomedical Sciences,<br />
Clinical Medicine and Nursing<br />
Contents<br />
3<br />
Relation between QT and RR intervals during Valsalva manoeuvre in young healthy<br />
women<br />
Kujaník ·tefan, Rakárová Martina<br />
10<br />
Chemical control of breathing in anaesthetized rabbits during hyperthermia and its recovery<br />
by body surface cooling<br />
Îila Ivan, Brozmanová Andrea, Javorka Kamil, Javorka Michal, âalkovská Andrea,<br />
Petrá‰ková Mária<br />
15<br />
NADPH: cytochrome P450 reductases of various species can be used in systems reconstituting<br />
drug-metabolizing CYP2E1 activity<br />
Belejová Marie, Anzenbacherová Eva, Zuber Roman, Anzenbacher Pavel<br />
19<br />
Arboviruses in Slovakia<br />
Eleãková E, Labuda, M, Rajãáni J<br />
29<br />
Prevalence of prothrombin mutation gene (G→A 20210)<br />
in thrombophilic patients<br />
Chudej Juraj, Koneãná Stanislava, PlameÀová Ivana, Ivanková Jela, Hudeãek Jan, Sta‰ko Ján,<br />
Pullmann Rudolf, Melu‰ Vladimír, Kubisz Peter<br />
32<br />
Central versus intraparenchymal arteries of kidney: Comparison of Doppler parameters<br />
under the physiological conditions in newborns<br />
Stavûl Miroslav, Kollarovszka Hana, Strechová Zuzana, Poláãek Hubert, Zibolen Mirko<br />
Published by the Jessenius Faculty of Medicine in Martin,<br />
Comenius University in Bratislava, Slovakia
A C T A M E D I C A M A R T I N I A N A 3 / 1<br />
Editor-in-Chief:<br />
Javorka, K., Martin, Slovakia<br />
International Editorial Board:<br />
Belej, K., Martin, Slovakia<br />
Buchanec, J., Martin, Slovakia<br />
Honzíková, N., Brno, Czech Republic<br />
Kliment, J., Martin, Slovakia<br />
Lehotsk˘, J., Martin, Slovakia<br />
Lichnovsk˘, V., Olomouc, Czech Republic<br />
Mare‰, J., Praha, Czech Republic<br />
Plank, L., Martin, Slovakia<br />
Stránsky, A., Martin, Slovakia<br />
Tatár, M., Martin, Slovakia<br />
˚wirska-Korczala, K., Zabrze-Katowice, Poland<br />
Editorial Office:<br />
Acta Medica Martiniana<br />
Jessenius Faculty of Medicine, Comenius University<br />
(Dept. of Physiology)<br />
Malá Hora 4<br />
037 54 Martin<br />
Slovakia<br />
Instructions for authors: http:|www.jfmed.uniba.sk (Acta Medica Martiniana)<br />
Tlaã:<br />
ProKonzult, s. r. o., závod NADAS, Vrútky<br />
© Jessenius Faculty of Medicine, Comenius University, Martin, Slovakia, <strong>2003</strong>
A C T A M E D I C A M A R T I N I A N A 3 / 1 3<br />
RELATION BETWEEN QT AND RR INTERVALS DURING VALSALVA<br />
MANOEUVRE IN YOUNG HEALTHY WOMEN<br />
·TEFAN KUJANÍK, MARTINA RAKÁROVÁ<br />
Department of Physiology, Medical Faculty of ·afárik University, Ko‰ice, Slovak Republic<br />
Abstract<br />
Objective: The aim of the study was to investigate the relation between QT interval and cardiac cycle length (RR interval)<br />
during 4 phases of Valsalva manoeuvre (VM) in young healthy women.<br />
Material and methods: The electrocardiogram of 28 healthy women (18-24 years) was registered during resting normal<br />
ventilation (RNV=control) and during 4 phases of VM (20 s at 40 mmHg = 5.33 kPa) in the daytime (9:00 to 17:00).<br />
The relation between QT and RR intervals compared to RNV was expressed by manually measured alterations of QT, RR,<br />
QTc intervals (paired t-test), and by the single correlation coefficient „r“.<br />
Results: All examined electrocardiographic parametres during RNV were within normal limits in all persons. In all<br />
phases of VM the heart rate, QT, QTc, and RR intervals were significantly different (p < 0.001) from RNV, normal QTc<br />
values (under 440 ms) were in 17.86-57.14% of subjects in individual phases. The maximum alterations of measured<br />
parameters were in the third phase, the minimum ones in the first phase. RR intervals sometimes altered very markedly<br />
from one cardiac cycle to the other one while the QT interval altered almost not distinctly. The independence between<br />
duration of QT and RR intervals was the most distinct in the phase 4. The simple correlation coefficient was 0.8948<br />
at rest (p < 0.01), 0.8196 (1 st phase, p < 0.01), 0.8169 (2 nd phase, p < 0.01), 0.8381 (3 rd phase, p < 0.01), 0.7506 (4 th<br />
phase, p < 0.01), 0.7855 (total VM, p < 0.01) and QT-RR relation was very individual.<br />
Conclusions: The QT interval duration is little altered during VM inspite of evident alterations in RR interval. The<br />
highest QT-RR correlation is in RNV, the lowest one during the 4 th phase of VM. The QT-RR relation is very individual.<br />
Key words: electrocardiography, QT interval, RR interval, Valsalva manoeuvre, healthy persons<br />
INTRODUCTION<br />
The length of the QT interval of electrocardiogram (electrical systole) is an indicator of the<br />
electrical stability of the heart. The QT interval is considered to be dependent on the heart rate<br />
(HR), its duration decreases with increasing HR. In attempt to remove its dependence on the HR,<br />
many formulae for calculation of the corrected (independent on HR) QT interval (QTc) were pro<strong>po</strong>sed<br />
(1, 2). They are dependent on QT-RR relation and have some limitations. Therefore alterations<br />
in QTc interval may reflect different changes in duration of QT or RR.<br />
The laws of the relation between QT and RR intervals are not clear yet. It can change under<br />
different conditions, such as reflex cardiovascular reactions, under influence of many drugs, etc.,<br />
when the rate dependence of QT interval is not firmly expressed. Within a wide range of RR intervals,<br />
the QT duration is altering only a little (3, 4, 5). Some respiratory manoeuvres (voluntary<br />
hyperventilation, hy<strong>po</strong>xic-hypercapnic ventilation, Valsalva manoeuvre) are able to alter the<br />
dependence of QT interval on the HR, expressed by regression lines, (6) and to influence the tone<br />
of cardiac autonomic nerves. Alterations of QT-RR relation after some respiratory manoeuvres<br />
are able to increase percentage of prolonged QT intervals over the upper limit (6).<br />
The latest investigations (7, 8) show that the QT-RR relation is not uniform but can frequently<br />
be very individual with intersubject differences. There are some conditions like carrying or<br />
lifting heavy objects, constipation, severe coughing spells, nausea, and vomiting, that increase<br />
intrathoracic pressure like Valsalva manoeuvre (VM) and they may prolong the QT interval duration<br />
or increase QT dispersion. VM consists of 4 phases of cardiovascular changes (9).<br />
The pur<strong>po</strong>se of this study was to investigate if abrupt changes in autonomic tone are able to<br />
modulate the relation between durations of QT interval and cycle length during VM in young<br />
healthy women.<br />
Address for corres<strong>po</strong>ndence:<br />
Assoc. Prof. ·tefan Kujaník, M.D., Ph.D., , Department of Physiology, Medical Faculty of P. J. ·afárik University,<br />
Trieda SNP 1, 040 66 Ko‰ice, Slovak Republic<br />
Phone: ++421 55 6423 763, Fax: ++421 55 6420 253<br />
e-mail: kujanik@central.medic.upjs.sk
4<br />
A C T A M E D I C A M A R T I N I A N A 3 / 1<br />
METHODS<br />
Twenty-eight young healthy non-obese non-smoking female volunteers (18-24 years)<br />
were studied. They had a negative result of preventive medical examination, their history was<br />
without any serious disease, their cardiac and pulmonary auscultation findings or blood pressure<br />
were within a normal range of values. The non-obese women were chosen because a more<br />
expressive obesity decreases the parasympathetic activity and increases the sympathetic predominance.<br />
They were also not suffering from anorexia nervosa. Obesity prolongs QTc interval and<br />
increases the catecholamine level (10) and anorexia nervosa increases the QT dispersion (11), i.e.<br />
both act proarhythmically. Our volunteers refrained from alcohol for 24 hours and coffee, tea,<br />
cola drinks or a heavy meal for 6 hours before examination. Vigorous physical activity was avoided<br />
on the day of the study.<br />
Our young volunteers were examined during resting normal ventilation (RNV = control values)<br />
and during total VM in the recumbent <strong>po</strong>sition with tilt head up by 60 grades. The basal recordings<br />
(RNV = control phase) were obtained after at least 5 minutes of rest, breathing frequency<br />
was controlled at 12-14 cycles/minute. The VM was performed by using a mouthpiece connected<br />
to manometer, expiration pressure of 40 mmHg (5.33 kPa) was sustained for 20 seconds.<br />
The electrocardiogram in Frank leads (X, Y, Z) and standard limb leads (I, II, III) was recorded<br />
by the device Chiracard 600T (Chirana) continuously during RNV and VM at a paper speed<br />
of 100 mm/s, calibration 1 mV = 1.5 cm, the T-P interval was defined as the isoelectric baseline.<br />
The QT interval was measured from the earliest onset of the QRS complex in any lead to the<br />
latest end of the T wave in any lead, defined as the return to baseline. The measured QT and<br />
preceding RR intervals were always measured during the total VM manually. It demonstrated<br />
(12) an excellent agreement between manual and automated measurements. Division into 4 phases<br />
of VM was made according to changes of heart rate. The values obtained from five consecutive<br />
beats were averaged for every phase of VM. If U wave was present, the end of the T wave was<br />
measured according to the principles described by Lepeschkin and Surawicz (13). The values of<br />
QTc over 440 ms were considered pathologic (14). The QT dispersion was not measured.<br />
The measurements were performed in the daytime (9:00 to 17:00), i.e. during period of higher<br />
QT variability (15). QTc interval was calculated according to the Bazett`s formula (1) QTc =<br />
QT/square root of the preceding RR interval. Correlation between measured QT and its corres<strong>po</strong>nding<br />
RR interval was tested by the value of simple linear correlation coefficient „r“. The investigation<br />
conforms to the principles outlined in the Declaration of Helsinki. The group „Total VM“<br />
was created as the average result from all four phases of VM.<br />
The statistical processing was performed by the program Microsoft Excel in Microsoft Office<br />
97. The numerical data were expressed as arithmetic mean ± one SD, the statistical significance<br />
of differences was tested by the paired t-test compared to RNV.<br />
RESULTS<br />
a) Normal ventilation at rest (RNV = control):<br />
During RNV any extrasystoles did not occur. The RR, heart rate (HR), measured QT, and QTc<br />
intervals were within the normal electrocardiographic values (Table 1). The average HR ranged<br />
from 48 to 90 per min, average RR from 667 to 1250 ms, average QT from 322 to 452 ms, averaged<br />
QTc from 381 to 433 ms in this phase. The average QTc intervals were normal (under 440<br />
ms) in all persons. Relation between QT and RR intervals was individual, the same duration of<br />
QT occurred with different RR or heart rates (HR). The durations of studied parametres at rest<br />
were considered 100% and compared with alterations during VM. Correlation between measured<br />
QT and RR intervals was significant (r = 0.8948; p < 0.01) during RNV.<br />
b) The first phase of VM:<br />
No extrasystoles occurred in the first phase of VM. Duration of QT and RR intervals shortened<br />
(because of tachycardia) but not pro<strong>po</strong>rtionally, QT interval was more stable. This phase was
A C T A M E D I C A M A R T I N I A N A 3 / 1 5<br />
the most variable for RR intervals since the highest value of SD occurred here. Compared to RNV<br />
the HR, RR, QT and QTc intervals were significantly different (p < 0.001; Table 1), their average<br />
values were the smallest compared to RNV. The average HR ranged from 49 to 139 per min, average<br />
RR from 431 to 1220 ms, average QT from 307 to 450 ms, averaged QTc from 372 to 494<br />
ms in this phase. The average QTc interval was over 440 ms in 12 volunteers (42.86%). Correlation<br />
between the measured QT and RR intervals was slightly less significant (r = 0.8196; p <<br />
0.01) compared to RNV.<br />
c) The second phase of VM:<br />
Extrasystoles did not occur here. This phase was the most variable (the highest value of SD)<br />
for QT interval. The RR, QT, QTc intervals and HR were significantly different (p < 0.001) compared<br />
to RNV. The average HR ranged from 66 to 160 per min, average RR from 375 to 906 ms,<br />
average QT from 293 to 450 ms, averaged QTc from 380 to 516 ms in this phase. Normal duration<br />
of the average QTc intervals (under 440 ms) was in 8 volunteers (28.57%) only. Correlation<br />
between the measured QT and RR intervals was significant (r = 0.8169; p < 0.01).<br />
d) The third phase of VM:<br />
Extrasystoles did not occur here. Compared to RNV the HR, RR, QT and QTc intervals were<br />
significantly different (p < 0.001), the maximum differences compared to RNV from all VM phases<br />
occurred here. The average HR ranged from 69 to 172 per min, average RR from 349 to 867<br />
ms, average QT from 288 to 422 ms, averaged QTc from 405 to 519 ms in this phase. Duration<br />
of average QTc intervals was normal (under 440 ms) in 5 persons (17.86%) only. Correlation between<br />
the measured QT and RR intervals was significant (r = 0.8381; p < 0.01).<br />
e) The fourth phase of VM:<br />
Extrasystoles did not occur here. Heart rate was the most variable in this phase (the highest<br />
value of SD), fast alterations of RR intervals from one cardiac cycle to other one accompanied<br />
with small QT alterations were present here (Figure 1). Compared to RNV the HR, RR, QT and<br />
QTc intervals were significantly different (p < 0.001). The average HR ranged from 71 to 196 per<br />
min, average RR from 306 to 850 ms, average QT from 303 to 430 ms, averaged QTc from 400<br />
to 547 ms in this phase. Duration of average QTc intervals was under 440 ms in 11 persons<br />
(39.29%) only. Correlation between the measured QT and RR intervals was significant (r =<br />
0.7506; p < 0.01).<br />
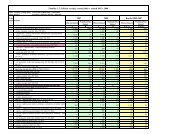
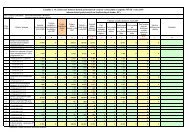
Table 1. QT-RR correlation during Valsalva manoeuvre (arithmetic mean ± one SD) in young healthy women (n = 28).<br />
Statistical significance compared to the resting values. HR – heart rate, QT – measured QT interval, QTc – corrected QT<br />
interval according to the Bazett formula, RNV – resting normal ventilation, „r“ – coefficient of simple linear correlation,<br />
VM – Valsalva manoeuvre.<br />
Period HR [beat/min] RR [ms] QT [ms] QTc [ms] „r“ QT to RR<br />
RNV (control) 77.04 ± 9.07 791.3 ± 116.0 364.4 ± 26.5 410.7 ± 13.1 0.8948<br />
p< 0.01<br />
VM – Phase 1 98.1 ± 17.4 635.6 ± 144.2 346.1 ± 29.1 437.8 ± 25.6 0.8196<br />
p< 0.001 p < 0.001 p < 0.001 p < 0.001 p < 0.01<br />
VM – Phase 2 108.8 ± 23.8 579.3 ± 135.7 342.5 ± 31.8 455.1 ± 32.0 0.8169<br />
p< 0.001 p < 0.001 p < 0.001 p < 0.001 p < 0.01<br />
VM – Phase 3 118.0 ± 25.6 534.2 ± 127.1 335.0 ± 29.2 463.5 ± 30.9 0.8381<br />
p< 0.001 p < 0.001 p < 0.001 p < 0.001 p < 0.01<br />
VM – Phase 4 112.3 ± 28.2 563.5 ± 126.2 337.7 ± 28.6 454.2 ± 37.3 0.7506<br />
p< 0.001 p < 0.001 p < 0.001 p < 0.001 p < 0.01<br />
VM – 4 phases 112.6 ± 24.2 557.9 ± 125.8 340.3 ± 27.8 460.7 ± 32.7 0.7855<br />
together p < 0.001 p < 0.001 p < 0.001 p < 0.001 p < 0.001
6<br />
A C T A M E D I C A M A R T I N I A N A 3 / 1<br />
Table 2. The average alterations of the heart rate (HR), RR, QT and QTc intervals compared to the resting normal ventilation<br />
(RNV = 100%) during all phases of Valsalva manoeuvre (VM) in the young healthy women (n = 28). * – the minimum<br />
average alteration, ** – the maximum average alteration.<br />
Time period Mean HR (%) Mean RR (%) Mean QT (%) Mean QTc (%)<br />
RNV (control) 100 100 100 100<br />
1 st phase of VM 127.27* 80.33* 94.97* 106.61*<br />
2 nd phase of VM 141.23 73.22 94.0 110.81<br />
3 rd phase of VM 153.17** 67.51** 91.92** 112.86**<br />
4 th phase of VM 145.77 71.66 92.69 110.60<br />
Total VM 146.16 70.50 93.40 112.19<br />
f) The total VM (all four phases together):<br />
During the total VM no extrasystoles occurred. All measured parameters were significantly<br />
different (p < 0.001) from RNV. The average HR ranged from 67 to 171 per min, average RR from<br />
351 to 896 ms, average QT from 302 to 438 ms, averaged QTc from 394 to 535 ms. Duration of<br />
average QTc interval was normal (under 440 ms) in 5 women (17.86%) only. Correlation between<br />
measured QT and RR intervals was significant (r = 0.7855; p < 0.01).<br />
The results of all studied parameters are shown in the tables and one figure. Compared to<br />
RNV the heart rate, RR interval, QT and QTc values altered significantly during all phases of VM<br />
(Table 1), the largest relative alterations in % were present in HR, the smallest ones in measured<br />
QT (Table 2). The RR intervals sometimes altered very markedly from one cardiac cycle to the<br />
other one while the QT interval altered almost not distinctly. Sometimes the QT and RR intervals<br />
were in the op<strong>po</strong>site relation, i.e. QT was stable but RR altered very markedly or one parameter<br />
was shortening and the second one prolonging and vice versa (Figure 1). The correlation between<br />
QT and RR intervals was significant (p < 0.01) in all phases, it was the highest (r = 0.8948)<br />
at rest and slightly lower during other phases (r = 0.8196, 0.8169, 0.8381, 0.7506 or 0.7855,<br />
Table 1). The independence between the duration of QT and RR intervals was the most distinct<br />
in the phase 4 (Figure 1). There was a special relationship time to time – RR was shortening but<br />
QT prolonging in the same time.<br />
DISCUSSION<br />
The ventricular re<strong>po</strong>larization is inhomogenous, its differences exist between the left and<br />
right ventricle, between the epicardium, mid-myocardium (M cells), and endocardium, and between<br />
the cardiac base and apex. These differences (increased or decreased) are influenced by<br />
various physiologic, pharmacologic, and pathologic interventions (16), such as autonomic tone,<br />
hy<strong>po</strong>xia, ischaemia, cardiac hypertrophy, temperature, drugs or ionic imbalance. It was demonstrated<br />
that the QT-RR relationship pattern varied significantly already among healthy individuals<br />
but their intraindividual stability was observed as well (7). This finding can be proved by<br />
our measurements. Statistical significance of the QT interval differences is also dependent on the<br />
mode of QT expressing (measured QT, corrected QT or QT together with its heart rate – 17). Ratecorrection<br />
formulae are pro<strong>po</strong>sed to allow interindividual comparisons at different HRs.<br />
We studied the female gender only which is considered to be a risk factor for ventricular arrhythmias.<br />
Clinical and experimental observations suggest the existence of true differences in<br />
electrophysiologic properties between the sexes. Estrogen has an impact on the electrophysiological<br />
properties of the heart. The progestin-oestrogen replacement therapy significantly reduces<br />
ventricular QT-dispersion compared to the control group, while only oestrogen replacement the-
A C T A M E D I C A M A R T I N I A N A 3 / 1 7<br />
Figure 1. Arelatively very independent beat-to-beat interrelation between QT and RR intervals during Valsalva manoeuvre<br />
in one of our young female volunteers.<br />
rapy significantly prolongs QTc - intervals without affecting QT dispersion (18). At physiological<br />
resting heart rates, the spatial ST-T vector voltage time trajectory is steeper in men than in<br />
women (19). Since the QT and RR intervals alter with heart rate, many formulae for QT correction<br />
(removing the rate dependence) were introduced within 80 years. The Bazett’s formula for<br />
QTc calculation merely diminishes but does not remove the rate dependence (Table 2).<br />
There is a different autonomic innervation of the heart. The vagus nerves supply predominantly<br />
the atria and conductive system of the heart and influence mostly the cardiac HR or RR<br />
intervals and conduction velocity in the atria. The chronotropic parasympathetic influence is realized<br />
mainly through the right vagus nerve (20) acting predominantly on the sinus node. A vagal<br />
nerve stimulation exerts only minimum effects on ventricular functions. In ventricles the sympathetic<br />
nerves influence the QT interval duration, excitability, and contractility. A recent study<br />
(21) shows heterogeneity of sympathetic innervation in various kinds of pathological conditions<br />
in normal human heart – the inferio<strong>po</strong>sterior region shows distinctly less sympathetic innervation<br />
than the anterior region.<br />
The effect of autonomic nerves on the heart and QT interval is complex but the cardiac autonomic<br />
blockade in ganglia prolongs QTc interval (22). Parasympathetic <strong>po</strong>stganglionic acetylcholine<br />
is removed very rapidly from the muscarinic receptors by acetylcholin-esterase and alterations<br />
of RR interval are substantially different already from beat to beat (fast cardiac control).<br />
Sympathetic <strong>po</strong>stganglionic noradrenalin is metabolized longer (slow cardiac control), most of its<br />
amount is reuptaken and QT duration is not substantially altered within several cardiac cycles<br />
(23). However, the RR interval duration is not a result of quantity of sympathetic or parasympathetic<br />
activity. There are no physiological evidences that the levels of sympathetic and vagal<br />
nerve fluctuations are balanced (24).
8<br />
A C T A M E D I C A M A R T I N I A N A 3 / 1<br />
In contrast to cardiac de<strong>po</strong>larization, the re<strong>po</strong>larization phase cannot be described in terms<br />
of wavefront propagation. The QT duration such as RR interval may also be influenced by the<br />
day-time (during sleep it is longer) or by short-term variations of the T wave form. The QT dispersion<br />
measurement may be due to measurement errors (25) and low amplitude <strong>po</strong>tentials are<br />
undetectable in some leads. It cannot be assumed that autonomic influences on the atrial pacemaker<br />
structures and on the ventricular myocardium are acting in parallel and RR interval can<br />
not give us information on the state of the autonomic regulation of the cardiac ventricles. The<br />
cardiac autonomic fibres are divided according to their function. Already in the first half of twentieth<br />
century the different branches of the cardiac plexus were named according to their main<br />
function (acceleratory, slowing or strengthening nerves).<br />
For mathematical expression of the relation between QT and RR intervals many authors have<br />
pro<strong>po</strong>sed linear or non-linear regression equations since 1920 (1), however, all of them have<br />
some limitations. It seems that the search for a universally applicable QT/RR regression model<br />
that would provide the best fit in all circumstances is most likely fruitless (26). Within a wide<br />
range of RR intervals the QT duration in reflex cardiovascular reactions is altering only very<br />
slightly (3, 4, 5). Our finding proves the opinion of these authors. When heart beats are selected<br />
for a steady rhythm during the preceding minute, QT and RR intervals fit a linear relationship<br />
during the day and night periods, but not during the 24-hour period. In contrast, in the absence<br />
of beat selection, data fit a more complex curvilinear relationship irrespective of the period<br />
(12). The autonomic conditions may probably directly affect the ventricular myocardium of healthy<br />
subjects, causing differences in QT that are independent of HR (27). QT rate dependence is<br />
larger during the day in both genders in healthy subjects (28). Women show stronger QT rate<br />
dependence and the circadian modulation decreases with increasing age.<br />
It seems that QT interval dispersion measured from the body surface is not a reliable index<br />
of re<strong>po</strong>larization dispersion in ventricular myocardium (29) and QT dispersion from body surface<br />
ECG does not reflect the spatial dispersion of ventricular re<strong>po</strong>larization (30, 31). Dispersion<br />
of the QT interval and other ECG variables of dispersion of ventricular re<strong>po</strong>larization are independent<br />
on heart rate. Therefore, it is not necessary to rate-correct those measurements of dispersion<br />
(32). However, QT dispersion has a dynamic behaviour with significant beat-to-beat fluctuations<br />
even in normal subjects (33).<br />
REFERENCES<br />
1. Bazett HC. An analysis of the time relations of electrocardiograms. Heart 1920; 7: 353-370.<br />
2. Malik M. The imprecision in heart rate correction may lead to artificial observations of drug induced QT interval<br />
changes. Pacing Clin Electrophysiol 2002; 25 (2): 209-216.<br />
3. Anderson RC. Q-T interval in sinus arrhythmia. J Electrocardiol 1981; 14 (4): 407-408.<br />
4. Davidowski TA, Wolf S. The QT interval during reflex cardiovascular adaptation. Circulation 1984; 69 (1): 22-25.<br />
5. Kujaník ·. QT/QS 2<br />
pri zmenách pºúcnej ventilácie u zdrav˘ch ºudí. [QT/QS 2<br />
during pulmonary ventilation alterations<br />
in healthy humans]. Noninvas Cardiol 1994; 3 (3): 149-152.<br />
6. Kujaník ·, Valachová A, Kubáãek ·, Mikuleck˘ M. Dependence of QT interval on the heart rate during alterations of<br />
pulmonary ventilation in young healthy subjects. Physiol Res 1993; 42 (6): 383-389.<br />
7. Batchvarov VN, Ghuran A, Smetana P, Hnatkova K, Harries M, Dilaveris P, Camm AJ, Malik M. QT-RR relationship<br />
in healthy subjects exhibits substantial intersubject variability and high intrasubject stability. Am J Physiol - Heart<br />
Circ Physiol 2002; 282 (6): H2356-H2363.<br />
8. Malik M, Farbom P, Batchvarov V, Hnatkova K, Camm AJ. Relation between QT and RR intervals is highly individual<br />
among healthy subjects: implications for heart rate correction of the QT interval. Heart 2002; 87 (3): 220-228.<br />
9. Nishimura RA, Tajik AJ. The Valsalva maneuver and res<strong>po</strong>nse revisited. Mayo Clin Proc 1986; 61 (3): 211-217.<br />
10. Corbi GM, Carbone S, Ziccardi P, Giugliano G, Marfella R, Nap<strong>po</strong> F, Paolisso G, Es<strong>po</strong>sito K, Giugliano D. FFAs and<br />
QT intervals in obese women with visceral adi<strong>po</strong>sity: Effects of sustained weight loss over 1 year. J Clin Endocrinol<br />
Metab 2002; 87 (5): 2080-2083.<br />
11. Galetta F, Franzoni F, Cupisti A, Belliti D, Prattichizzo F, Rolla M. QT interval dispersion in young women with anorexia<br />
nervosa. J Pediatrics 2002; 140 (4): 456-460.<br />
12. Lande G, Funckbrentano C, Ghadanfar M, Escande D. Steady-state versus non-steady-state QT-RR relationships in<br />
24-hour Holter recordings. Pacing Clin Electrophysiol 2000; 23 (3): 293-302.<br />
13. Lepeschkin E, Surawicz B. The measurement of the QT interval of the electrocardiogram. Circulation 1952; 6: 378-<br />
388.
A C T A M E D I C A M A R T I N I A N A 3 / 1 9<br />
14. Moss AJ, Schwartz PJ. Sudden death and the idiopathic long QT syndrome. Am J Med 1979; 66 (1): 6-7.<br />
15. Kostis WJ, Belina JC. Differences in beat-to-beat variability of the QT interval between day and night. Angiology<br />
2000; 51 (11): 905-911.<br />
16. Gettes LS. The T wave: A window on ventricular re<strong>po</strong>larization? J Cardiovasc Electrophysiol 2001; 12 (11): 1326-<br />
1328.<br />
17. Kujaník ·, Valachová A, Mikuleck˘ M, Murín M. Dependence of statistical significance of QT interval differences on<br />
the mode of QT expressing. Folia Fac Med Univ ·afarik Cassov 1990; 47: 83-88.<br />
18. Haseroth K, Seyffart K, Wehling M, Christ M. Effects of progestin-estrogen replacement therapy on QT-dispersion in<br />
<strong>po</strong>stmenopausal women. Int J Cardiol 2000; 75 (2-3): 161-165.<br />
19. Lehmann MH, Yang H. Sexual dimorphism in the electrocardiographic dynamics of human ventricular re<strong>po</strong>larization<br />
– characterization in true time domain. Circulation 2001; 104 (1): 32-38.<br />
20. Rothberger C. Allgemeine Physiologie des Herzens. In: Handb norm u pathol Physiol, Bd 7/1, Berlin 1926: 523-662.<br />
21. Momose M, Tyndalehines L, Bengel FM, Schwaiger M. How heterogeneous is the cardiac autonomic innervation?<br />
Basic Res Cardiol 2001; 96 (6): 539-546.<br />
22. Diedrich A, Jordan J, Shannon JR, Robertson D, Biaggioni I. Modulation of QT interval during autonomic nervous<br />
system blockade in humans. Circulation 2002; 106 (17): 2238-2243.<br />
23. Van Ravenswaaij-Arts CMA, Kollée LAA, Hopman JCW, Stoelinga GB, van Geijn HP. Heart rate variability. Ann Intern<br />
Med 1993; 118 (6): 436-446.<br />
24. Ruttkay-Nedeck˘ I. The effect of the autonomic nervous system on the heart. Electrocardiographic evaluation: Problems<br />
and concerns. Cardiol (Bratislava) 2001; 10 (1): 42-48.<br />
25. Kors JA, van Herpen G. Measurement error as a source of QT dispersion: a computerized analysis. Heart 1998; 80<br />
(5): 453-458.<br />
26. Hnatkova K, Malik M. „Optimum’’ formulae for heart rate correction of the QT interval. Pacing Clin Electrophysiol<br />
1999; 22 (11): 1683-1687.<br />
27. Magnano AR, Holleran S, Ramakrishnan R, Reiffel JA, Bloomfield DM. Autonomic nervous system influences on QT<br />
interval in normal subjects. J Am Coll Cardiol 2002; 39 (11): 1820-1826.<br />
28. Extramiana F, Maison-Blanche P, Badilini F, Pinoteau J, Deseo T, Cournel P. Circadian modulation of QT rate dependence<br />
in healthy volunteers: gender and age differences. J Electrocardiol 1999; 32 (1): 33-43.<br />
29. Lux RL, Fuller MS, Macleod RS, Ershler PR, Green LS, Taccardi B. QT interval dispersion. Dispersion of ventricular<br />
re<strong>po</strong>larization or dispersion of QT interval? J Electrocardiol 1998; 30(Suppl): 176-180.<br />
30. Wang LX. QT dispersion from body surface ECG does not reflect the spatial dispersion of ventricular re<strong>po</strong>larization<br />
in sheep. Pacing Clin Electrophysiol 2000; 23 (3): 359-364.<br />
31. Malik M, Acar B, Gang Y, Yap YG, Hnatkova K, Camm AJ. QT dispersion does not represent electrocardiographic<br />
interlead heterogeneity of ventricular re<strong>po</strong>larization. J Cardiovasc Electrophysiol 2000; 11 (8): 835-843.<br />
32. Zabel M, Franz MR, Klingenheben T, Mansion B, Schultheiss HP, Hohnloser SH. Rate-dependence of QT dispersion<br />
and the QT interval: Comparison of atrial pacing and exercise testing. J Am Coll Cardiol 2000; 36 (5): 1654-1658.<br />
33. Figueredo EJG, Ohnishi Y, Yoshida A, Yokoyama M. Usefulness of beat-to-beat QT dispersion fluctuation for identifying<br />
patients with coronary heart disease at risk for ventricular arrhythmias. Am J Cardiol 2001; 88 (11): 1235-<br />
1239.<br />
Received: May, 25, <strong>2003</strong><br />
Accepted: June, 19, <strong>2003</strong>
10<br />
A C T A M E D I C A M A R T I N I A N A 3 / 1<br />
CHEMICAL CONTROL OF BREATHING IN ANAESTHETIZED<br />
RABBITS DURING HYPERTHERMIA AND ITS RECOVERY BY BODY<br />
SURFACE COOLING<br />
IVAN ÎILA, ANDREA BROZMANOVÁ, KAMIL JAVORKA, MICHAL JAVORKA,<br />
ANDREA âALKOVSKÁ, MÁRIA PETRÁ·KOVÁ<br />
Department of Physiology, Comenius University, Jessenius Faculty of Medicine, Faculty Hospital Martin, Slovak Republic<br />
Abstract<br />
The contribution of chemical control mechanisms in the development of respiratory changes during hyperthermia<br />
and its recovery by body surface cooling was studied in 14 adult rabbits.<br />
Hypercapnic (HCVR) and hy<strong>po</strong>xic ventilatory res<strong>po</strong>nses (HVR) were estimated during body surface heating and cooling.<br />
HCVR: CO 2<br />
-sensitivity in normothermia was 115 ± 22 ml.min -1 .kPa -1 (mean ± SEM). During overheating the sensitivity<br />
was significantly increased – at 42 o C it was 162 ± 20 ml.min -1 .kPa -1 . Recovery of body temperature (BT) was not<br />
accompanied with significant change of CO 2<br />
-sensitivity. HVR: gradual decrease of FiO 2<br />
during overheating caused rise<br />
of ventilation lesser than in normothermia. During cooling, there was similar change of ventilation during episodes of<br />
hy<strong>po</strong>xia. As temperature recovered to the initial value, ventilation did not significantly change with decrease of FiO 2<br />
.<br />
Minute ventilation significantly increased only compared to V E<br />
in normoxia.<br />
The results indicate that during hyperthermia HCVR was augmented and HVR was attenuated. Attenuation of HVR<br />
persists during recovery of BT, while HCVR did not significantly change.<br />
Key words: chemical control of breathing, chemoreflex sensitivity, hyperthermia, hy<strong>po</strong>xia, hypercapnia<br />
INTRODUCTION<br />
The changes of body temperature (BT) are accompanied with marked alterations of respiratory<br />
parameters. It is sup<strong>po</strong>sed that some of these changes are evoked by alterations in the<br />
peripheral temperature. The other changes are modified by shifts in the central BT, eventually<br />
by other mechanisms (1). However, previous re<strong>po</strong>rts considerably interpret various evidence of<br />
contribution of chemoreflexes in the origin of respiratory instability in hyperthermia.<br />
The effects of respiratory res<strong>po</strong>nses to a lowering of BT are often complicated by the conditions<br />
of body cooling (1). Recovery of BT to normothermia is accompanied by a gradual resetting<br />
of respiratory parameters near to the initial values and acceleration of recovery (e.g. by cooling)<br />
elicits further cardiorespiratory changes (2). These res<strong>po</strong>nses are rather more complex. Elevated<br />
thermogenesis requires increased oxygen uptake which is as a consequence often associated<br />
with increased ventilation (V E<br />
). Galland (1991) re<strong>po</strong>rts that recovery of BT from hyperthermia to<br />
the initial value is considered to be a phase of impaired control of breathing.<br />
The present study was undertaken to obtain information on the contribution of chemical control<br />
mechanisms to the development of respiratory changes in experimental hyperthermia and<br />
its physical treatment in rabbits.<br />
METHODS<br />
The experiments were carried out on 14 adult rabbits, body weight (b.w.) 2.6 ± 0.1 kg (mean<br />
± SEM). The animals were anaesthetized with intramuscular ketamine (S<strong>po</strong>fa, Czech Republic)<br />
at a dose of 25 mg/kg b.w. and xylazine (S<strong>po</strong>fa) at a dose of 5 mg/kg b.w. followed by continu-<br />
Address for corres<strong>po</strong>ndence:<br />
Ivan Îila, M.D., Department of Physiology, Comenius University, Jessenius Faculty of Medicine, Faculty Hospital,<br />
Malá Hora 4, 037 54 Martin, Slovak Republic<br />
Phone: ++421 43 4131 426, Fax: ++421 43 4222 260<br />
e-mail: zila@jfmed.uniba.sk
A C T A M E D I C A M A R T I N I A N A 3 / 1 11<br />
ous intravenous infusion of ketamine at a dose of 20 mg/kg/hour. The animals were tracheotomized<br />
and breathed s<strong>po</strong>ntaneously room air through a tracheal cannula. The tidal volume (V T<br />
)<br />
was recorded by the Fleisch head of a pneumotachograph (ÚMMT SAV, Bratislava) connected to<br />
the tracheal cannula. End-tidal CO 2<br />
(ETCO 2<br />
) was continuously recorded using mainstream sensor<br />
of a capnograph (Capnogard, Novametrix, USA) connected to the head of pneumotachograph.<br />
The frequency of breathing (f) was calculated from the tidal volume recording. Blood pressure<br />
in the femoral artery was recorded with the electromanometer LDP 102 (Tesla, Czech Republic).<br />
Blood samples were taken from the femoral artery for the blood gases (p a<br />
O 2<br />
, p a<br />
CO 2<br />
) and pH a<br />
analysis<br />
using a blood gas analyzer (Radiometer, Denmark) and corrected for actual BT. The catheter<br />
in the femoral vein was used for a continuous administration of the anaesthetic by the injection<br />
pump IPA 2050 (COMPACT Co., Czech Republic). Rectal temperature was measured with<br />
mercury thermometer at a depth of 6-7 cm.<br />
The experiment was divided to two phases. In the first one, initial body temperature of the<br />
animal (T 1<br />
) was gradually elevated by surface heating to 42.0 o C using a heating pad and radiant<br />
heat from an infrared lamp. Subsequently, body surface cooling by a cooling pad and wet cold<br />
wraps were used for recovery of BT to the initial value.<br />
Hypercapnic and hy<strong>po</strong>xic ventilatory res<strong>po</strong>nse was measured during body surface heating at<br />
39.5-40.5 o C (T 2<br />
) and 42.0 o C (T 3<br />
) as well as during cooling at 40.5-39.5 o C (T 4<br />
) and when BT recovered<br />
to the initial value (T 5<br />
= T 1<br />
).<br />
Hypercapnic ventilatory res<strong>po</strong>nse (HCVR). The animals breathed from a bag with gas mixture<br />
of 40% O 2<br />
balanced with N 2<br />
. For continuous rise of end-tidal CO 2<br />
(ETCO 2<br />
), CO 2<br />
was added to the<br />
inspiratory gas. Gradual rising of CO 2<br />
-tension was performed in 2 minutes time period and endtidal<br />
CO 2<br />
was monitored in 10 second intervals. Hence, 12 values of ETCO 2<br />
were ploted against<br />
corres<strong>po</strong>nding data from pneumotachograph. CO 2<br />
sensitivity was estimated as the slope of ventilation<br />
– ETCO 2<br />
curves. Blood samples were taken between 50-60 and 110-120 second of CO 2<br />
run.<br />
Hy<strong>po</strong>xic ventilatory res<strong>po</strong>nse (HVR). After 3 minutes of resting period (animals breathed room<br />
air), second phase of protocol started. The animals breathed from four bags containing gas mixture<br />
of 11%, 9%, 7% and 5% O 2<br />
, balanced with N 2<br />
(H 11<br />
, H 9<br />
, H 7<br />
, H 5<br />
). Each mixture was inhaled<br />
for 2 minutes, isocapnia was performed by manually controlled addition of CO 2<br />
to inspiratory<br />
gas. Between each hy<strong>po</strong>xic mixture there was 30 second period of room air breathing. Blood<br />
samples were taken at the same time intervals as for the CO 2<br />
run. The HVR was estimated as<br />
the change of ventilation (V E<br />
) regarding ventilation in normoxia and ventilation during episodes<br />
of hy<strong>po</strong>xia. V E<br />
was assessed at the end of the first and the second minute of hy<strong>po</strong>xic runs.<br />
The rabbits were killed by overdosing with the anaesthetic drug et the end of the experiment.<br />
Experiments were done according to Helsinki Declaration of 1975, revised in 1983.<br />
Statistical analysis: Statistical analysis was performed using a Wilcoxon test to evaluate within-group<br />
changes. The results are expressed as means ± SEM. Differences were considered significant<br />
when P < 0.05.<br />
RESULTS<br />
Hypercapnic ventilatory res<strong>po</strong>nse – central chemoreflex sensitivity<br />
CO 2<br />
sensitivity in normothermia was 115 ± 22 ml.min -1 .kPa -1 . During overheating, at T 2<br />
no<br />
significant change was found (154 ± 19 ml.min -1 .kPa -1 ). At 42 o C (T 3<br />
) sensitivity was significantly<br />
increased (162 ± 20 ml.min -1 .kPa -1 vs. normothermia, p < 0.05). During recovery of BT the sensitivity<br />
of the central chemoreflex did not change significantly (T 4<br />
: 159 ( 22 ml. min -1 .kPa -1 , T 5<br />
:<br />
158 ± 24 ml.min -1 .kPa -1 ; Figure 1).<br />
Hy<strong>po</strong>xic ventilatory res<strong>po</strong>nse<br />
While hy<strong>po</strong>xic stimulation in normothermia evoked a gradual rise of ventilation (V E<br />
), change<br />
of BT during the hy<strong>po</strong>xic run led to reduction of differences in V E<br />
. With increased intensity of
12<br />
A C T A M E D I C A M A R T I N I A N A 3 / 1<br />
Figure 1. CO 2<br />
-sensitivity during overheating (T 2<br />
=<br />
39.5-40.5 o C, T 3<br />
= 42 o C) and cooling (T 4<br />
= 40.5-<br />
39.5 o C, T 5<br />
= initial value) compared to normothermia<br />
(T 1<br />
).<br />
Figure 2. Hy<strong>po</strong>xic ventilatory res<strong>po</strong>nse. Change of ventilation<br />
during normoxia (FiO 2<br />
= 0.21) and episodes of hy<strong>po</strong>xia at different<br />
degrees of body temperature.<br />
hy<strong>po</strong>xia V E<br />
rose slowly with change of BT from T 1<br />
to T 5<br />
(Figure 2). .<br />
Breathing a gas mixture containing<br />
5% O 2<br />
(H 5<br />
) elicited a significant rise of V E<br />
only in comparison with V E<br />
in normothermia<br />
(Table 1). With the rise of intensity of hy<strong>po</strong>xia from 11% O 2<br />
(H 11<br />
) to 5% O 2<br />
(H 5<br />
) changes of tidal<br />
volume (V T<br />
) at T 1<br />
-T 5<br />
were more accentuated. During overheating V T<br />
decreased more rapidly at<br />
lower concentration of O 2<br />
in inspired gas and similarly rose more rapidly with recovery of BT to<br />
the initial value. While V T<br />
at H 11<br />
did not change during overheating, at H 7<br />
and H 5<br />
there was a significant<br />
decrease between V T<br />
at T 3<br />
and T 1<br />
and T 2<br />
-T 3<br />
. Frequency of breathing (f) during hy<strong>po</strong>xic<br />
run changed with rise and decrease of BT by the same manner as frequency in normoxia. The<br />
recovery phase was accompanied by a significant decrease of f at all hy<strong>po</strong>xic mixtures.<br />
p a<br />
O 2<br />
at the beginning of the experiments was 10.9 ± 0.83 kPa, during overheating decreasedat<br />
T 3<br />
it was 8.1 ± 0.29 kPa (p < 0.05). In the course of recovery of BT to the initial value significant<br />
increase was found. Episodes of hy<strong>po</strong>xia were accompanied with gradual decrease of p a<br />
O 2<br />
.<br />
In three cases, decrease of FiO 2<br />
was not followed by significant decrease of p a<br />
O 2<br />
(Table 2).<br />
DISCUSSION<br />
Hypercapnic ventilatory res<strong>po</strong>nse (HCVR)<br />
Our results show that a rise in the BT led to the increase of HCVR. CO 2<br />
-sensitivity at 42 o C<br />
significantly increased compared to value at initial BT. This finding is in accordance to studies<br />
performed both in humans and in animals (4, 5, 6). However, some investigators have found no<br />
change of central chemoreflex sensitivity (7). In some experiments a decrease of HCVR in a warm<br />
environment was observed (8). There are several <strong>po</strong>ssible reasons for contradictory observations,<br />
but the different methods of investigation seem to be the most considerable reason for the discrepancy<br />
of the results.<br />
An increase of CO 2<br />
-sensitivity (between T 1<br />
and T 3<br />
) could be explained by at least two mechanisms.<br />
Firstly, increased metabolic drive can be res<strong>po</strong>nsible for augmented HCVR. Secondly,<br />
there is an assumed interaction between thermal and central chemoreceptor drives to breathe<br />
(6). This relation is multiplicative rather than additive and authors suggest that there is also an<br />
additive ventilatory drive com<strong>po</strong>nent due to thermal stimuli independent of carbon dioxide (6).<br />
Recovery of BT from hyperthermia to initial value is considered to be a phase of impaired control<br />
of breathing (3). In our study there was also a tendency to decrease CO 2<br />
-sensitivity in this<br />
period, however, the differences were not statistically significant. Some experiments show that<br />
in anaesthetized animals, mild hy<strong>po</strong>thermia does not affect the res<strong>po</strong>nse to CO 2<br />
, however, the<br />
use of deep hy<strong>po</strong>thermia does provide some evidence of reduced CO 2<br />
-sensitivity (9).
A C T A M E D I C A M A R T I N I A N A 3 / 1 13<br />
Table 1. Hy<strong>po</strong>xic ventilatory res<strong>po</strong>nse. Minute ventilation (ml/min) in normothermia (T 1<br />
), during overheating (T 2<br />
= 39.5-<br />
40.5 o C, T 3<br />
= 42 o C) and during body temperature recovery (T 4<br />
= 39.5-40.5 o C, T 5<br />
= initial value).<br />
normoxia H 11<br />
H 9<br />
H 7<br />
H 5<br />
T 1<br />
1051.4 ± 120.6 1399.6* ± 174.1 1542.3* ± 167.3 1760.6* ± 196.1 1872.4* ± 184.6<br />
T 2<br />
1502.8† ± 158.3 1979.5*† ± 240.3 2116.1*† ± 281.3 2187.3*† ± 278.8 2277.9† ± 293.9<br />
T 3<br />
1866.5† ± 223.0 2316.9*† ± 212.8 2369.4† ± 238.3 2364.4 ± 260.2 2329.9 ± 248.9<br />
T 4<br />
1822.0 ± 162.3 2254.7* ± 241.1 2329.2 ± 299.8 2448.4 ± 276.7 2486.5 ± 268.5<br />
T 5<br />
1996.4 ± 165.9 2301.3* ± 193.4 2319.1 ± 199.7 2298.9 ± 231.4 2363.8 ± 252.8<br />
Values are shown as means ± SEM.<br />
* Value is significantly greater than previous value in row, P < 0.05<br />
† Value is significantly greater than previous value in column, P < 0.05<br />
Table 2. Hy<strong>po</strong>xic ventilatory res<strong>po</strong>nse. paO 2<br />
(kPa) in normothermia, during overheating (T 2<br />
= 39.5-40.5 o C, T 3<br />
= 42 o C)<br />
and during body temperature recovery (T 4<br />
= 40.5-39.5 o C, T 5<br />
= initial value).<br />
normoxia H 11<br />
H 9<br />
H 7<br />
H 5<br />
normothermia 10.9 ± 0.8 7.3 ◊ ± 0.5 6.6 ◊ ± 0.3 6.0 ◊ ± 0.2 5.4 ◊ ± 0.2<br />
T 2<br />
9.4 ± 0.2 5.9 ◊ ± 0.2 5.6 ± 0.2 5.1 ◊ ± 0.2 4.5 ◊ ± 0.2<br />
T 3<br />
8.1 ± 0.3 5.5 ◊ ± 0.3 4.8 ◊ ± 0.2 4.4 ◊ ± 0.2 3.9 ◊ ± 0.2<br />
T 4<br />
10.0 † ± 0.4 7.0 ◊† ± 0.3 6.4 ◊† ± 0.3 6.0 † ± 0.4 5.4 ◊† ± 0.3<br />
T 5<br />
13.2 † ± 0.7 8.9 ◊† ± 0.5 8.6 † ± 0.7 7.6 ◊† ± 0.5 6.6 ◊† ± 0.4<br />
Values are shown as means ± SEM<br />
*Value is significantly greater than previous value in row, p < 0.05<br />
◊ Value is significantly lesser than previous value in row, p < 0.05<br />
†<br />
Value is significantly greater than previous value in column, p < 0.05<br />
<br />
Value is significantly lesser than previous value in column, p < 0.05<br />
Hy<strong>po</strong>xic ventilatory res<strong>po</strong>nse (HVR)<br />
In this study, the rise in BT was accompanied with attenuation of HVR. While at initial BT<br />
minute ventilation (V E<br />
) gradually increased with rise of intensity of hy<strong>po</strong>xia, at T 2<br />
increasing of<br />
V E<br />
was moderate. Hy<strong>po</strong>xic stimulation at T 3<br />
evoked the increase of V E<br />
only in comparison to the<br />
initial minute ventilation.<br />
We observed that, whereas changes of V E<br />
in normothermia were due to pro<strong>po</strong>rtional change<br />
of tidal volume (V T<br />
) and frequency of breathing (f), during overheating (T 2<br />
) less marked change of<br />
V T<br />
was present. Frequency of breathing increased during episodes of hy<strong>po</strong>xia, but mostly in<br />
cases of mild hy<strong>po</strong>xia runs. At T 3<br />
, preferably in cases of severe hy<strong>po</strong>xia f decreased and therefore<br />
modest increase of V E<br />
was mainly due to rise of V T<br />
.<br />
Our findings are in accordance to study of Watanabe et al. (8), who showed that respiratory<br />
res<strong>po</strong>nse mediated via peripheral chemoreceptors decreases in warmer environmental temperature<br />
in kittens. Authors assume the decrease in metabolism causing lower amplitude of oscillation<br />
in p a<br />
CO 2<br />
, and therefore decreasing intensity of respiratory res<strong>po</strong>nse. Another <strong>po</strong>ssibility is<br />
an effect of the thermoreceptors on central nervous system.<br />
Recovery of BT to initial value was also accompanied with attenuation of HVR. Changes of V E
14<br />
A C T A M E D I C A M A R T I N I A N A 3 / 1<br />
were mostly due to increase of V T<br />
, frequency did not change, except 2 <strong>po</strong>ints when it decreased.<br />
At T 5<br />
ventilation did not change from mild to severe hy<strong>po</strong>xia. However, it increased in comparison<br />
to resting V E<br />
. During recovery of BT, decrease of fraction of inspired oxygen (FiO 2<br />
) slowed the<br />
increase of ventilation. Previous studies suggested that such a decrease could be due to hy<strong>po</strong>metabolism<br />
caused by hy<strong>po</strong>xia. Decrease of metabolic drive to breathe might overcome hy<strong>po</strong>xic<br />
drive and lead to attenuation of HVR (10). In our experiments including 4 episodes of hy<strong>po</strong>xia,<br />
severe hy<strong>po</strong>xic runs could change the metabolism. Therefore we can not conclude that attenuation<br />
of HVR during recovery phase was only due to decrease in the gain of peripheral chemoreflex.<br />
Our results show that hyperthermia was accompanied with augmented HCVR and with attenuation<br />
of HVR. In spite of not significant decrease in CO 2<br />
-sensitivity during recovery of body<br />
temperature, attenuation of HVR persisted during cooling. Because of <strong>po</strong>ssible damage in<br />
mechanisms of control of breathing it would be worth to study the respiratory changes during<br />
physical treatment of hyperthermia.<br />
This work was sup<strong>po</strong>rted by grant N. 1/6292/99 from Grant Agency VEGA (Slovak Republic)<br />
REFERENCES<br />
1. Cooper KE, Veale WL. Effects of temperature on breathing. Handbook of Physiology, The Respiratory system II, Chapter<br />
20, 1986. p. 691-699.<br />
2. Javorka K, Calkovska A, Petraskova M, Gecelovska V. Cardiorespiratory parameters and respiratory reflexes in rabbits<br />
during hyperthermia. Physiol Res 1996; 45: 439-447.<br />
3. Galland BC, Taylor BJ, Bolton DPG. Respiratory instability in the sleeping piglet following hyperthermia. Workshops<br />
Abstracts of the ESID Founding Congress, Rouen, 1991. p. 87.<br />
4. Widdicombe JG, Winning A. Effects of hy<strong>po</strong>xia, hypercapnia and changes in body temperature on the pattern of breathing<br />
in cats. Respir Physiol 1974; 21: 203-221.<br />
5. Maskrey M. Body temperature effects on hy<strong>po</strong>xic and hypercapnic res<strong>po</strong>nses in awake rats. Am J Physiol 1990; 259:<br />
492-498.<br />
6. Baker FJ,Goode CR, Duffin J. The effect of a rise in body temperature on the central-chemoreflex ventilatory res<strong>po</strong>nse<br />
to carbon dioxide. Eur J Appl Physiol 1996; 72: 537-541.<br />
7. Vejby-Christensen H, Strange-Petersen E. Effect of body temperature and hy<strong>po</strong>xia on the ventilatory CO 2<br />
in man.<br />
Respir Physiol 1973; 10: 93-108.<br />
8. Watanabe T, Kumar P, Hanson MA. Effect of ambient temperature on respiratory chemoreflex in unanaesthetized kittens.<br />
Respir Physiol 1996; 106: 239-246.<br />
9. Cherniack NS, von Euler C, Homma I, Kao FF. Graded changes in central chemoreceptor input by local temperature<br />
changes on the ventral surface of medulla. J Physiol 1979; 287: 191-211.<br />
10. Mortola JP, Matsuoka T. Interaction between CO 2<br />
production and ventilation in the hy<strong>po</strong>xic kitten. J Appl Physiol<br />
1993; 74: 905-910.<br />
Received: February, 25, <strong>2003</strong><br />
Accepted: May, 25, <strong>2003</strong>
A C T A M E D I C A M A R T I N I A N A 3 / 1 15<br />
NADPH: CYTOCHROME P450 REDUCTASES OF VARIOUS SPECIES CAN<br />
BE USED IN SYSTEMS RECONSTITUTING DRUG-METABOLIZING<br />
CYP2E1 ACTIVITY<br />
MARIE BELEJOVÁ, EVA ANZENBACHEROVÁ*, ROMAN ZUBER, PAVEL ANZENBACHER<br />
Institute of Pharmacology and *Institute of Medical Chemistry and Biochemistry, Faculty of Medicine,<br />
Palacky University, Olomouc, Czech Republic<br />
Abstract<br />
Metabolism of drugs and other foreign substances is mostly mediated by cytochromes P450 (P450, abbreviated also<br />
CYP for a particular enzyme). To find which P450 is involved in metabolism of a drug, liver microsomal monooxygenase<br />
system of P450 is reconstituted with its com<strong>po</strong>nents: selected P450 enzyme, cytochrome b 5<br />
, NADPH:P450 reductase and<br />
phospholipid. Used NADPH:P450 reductases were human recombinant and minipig or rat liver microsomal ones isolated<br />
by chromatographic separations. Chosen P450 enzyme was the CYP2E1 which is known to be of very similar primary<br />
structure among species; in this study, the minipig enzyme has been taken, as the minipigs seem to be suitable model<br />
animals for drug metabolism studies. Results obtained show that the reductase enzymes of rat and human origin can<br />
be used in reconstituted systems with a CYP2E1 as the activity of this enzyme varies in systems with reductases of different<br />
origin less than ten times. The results also indicate that the reductases from different species share a functional<br />
similarity, if not identity.<br />
Key words: cytochrome P450, CYP2E1, NADPH:cytochrome P450 reductase, pig<br />
INTRODUCTION<br />
NADPH:cytochrome P450 oxidoreductase (abbreviated P450 reductase, EC 1.6.2.4) was found<br />
as an electron trans<strong>po</strong>rting flavoprotein in pig livers (1), lately, it has been determined to be<br />
amember of mammalian microsomal monooxygenase system of cytochromes P450 (2,3). Cytochromes<br />
P450 (P450, abbreviated also CYP for a particular enzyme) are known to mediate metabolism<br />
of drugs and other foreign substances and to take part in many biosynthetic pathways in<br />
organism (4). To find which P450 is involved in metabolism of a drug, liver microsomal monooxygenase<br />
system of P450 should be reconstituted with its com<strong>po</strong>nents, namely, with the selected<br />
P450 enzyme, with the NADPH:P450 reductase and phospholipid, in some cases also with<br />
the cytochrome b 5<br />
(5).<br />
Three-dimensional structure of the rat liver microsomal P450 reductase has been determined<br />
recently (6,7). The P450 reductase is com<strong>po</strong>sed of two flavin-binding domains (the FMN- and<br />
FAD-binding one), of the domain which mediates the binding of the enzyme to the microsomal<br />
membrane and of the binding sites of the P450 and of the NADPH. However, for the use of P450<br />
reductases of different origin (i.e. from different species) in reconstituted microsomal P450 systems<br />
it is im<strong>po</strong>rtant to know whether they are mutually interchangeable. Although there are<br />
indications in the literature (5) that this is true at least for some activities (mainly when rabbit<br />
liver microsomal P450 reductase is used), it should be however proven for every particular case<br />
to be sure that the reconstitution is <strong>po</strong>ssible. This was also the main aim of this study: To prove<br />
the <strong>po</strong>ssibility to reconstitute the prototypical CYP2E1 activity (chlorzoxazone 6-hydroxylation<br />
(8), the P450 reductases from minipig and rat liver microsomes as well as the human recombinant<br />
reductase enzyme were used.<br />
Address for corres<strong>po</strong>ndence:<br />
Marie Belejová, MD, Institute of Pharmacology, Faculty of Medicine, Palacky University,<br />
Hnûvotínská 3, 775 15 Olomouc, Czech Republic<br />
Phone: 00421 58 563 2556<br />
e-mail: belejovm@fnol.cz
16<br />
A C T A M E D I C A M A R T I N I A N A 3 / 1<br />
MATERIAL AND METHODS<br />
The P450 reductases of the rat and minipig origin were isolated by affinity chromatography<br />
from solubilized liver microsomal fraction by a procedure based on method of Yasukochi and<br />
Masters (9). The rat microsomal fraction was obtained from Dr. Stiborová (Faculty of Sciences,<br />
Charles University, Prague). The human recombinant P450 reductase was purchased from Panvera<br />
(Woburn, MA, USA).<br />
The CYP2E1 was prepared from microsomal fraction of minipig liver homogenate by a procedure<br />
based on combination of various chromatographic steps as outlined by Guengerich (10), for<br />
a description of this approach applied to minipig P450 enzymes see (11). Cytochrome b 5<br />
was isolated<br />
as a by-product during the same isolation. The other materials were as a rule obtained<br />
from Sigma Aldrich CZ (Prague). The chlorzoxazone 6-hydroxy derivative was a product of Ultrafine<br />
Chemicals (Salford, UK).<br />
The experiments, in which the CYP2E1 enzyme activity with different P450 reductases was<br />
followed using a reconstituted system, were done according to procedure described in (5). Incubation<br />
mixture (0.250 ml) consisted of the CYP2E1 (20 pmol), the respective reductase (60 pmol),<br />
cytochrome b 5<br />
(80 pmol) and phospholipid (dilauroylphosphatidylcholine, 4 µg) in 50 mM K/PO 4<br />
buffer, pH 7.4) together with the NADPH-generating system (50 µl of 5 mM NADP + , 50 µl of 50<br />
mM glucose-6-phosphate, 5 µl of glucose 6-phosphate dehydrogenase, 100 µl of 1.0 M K/PO 4<br />
pH<br />
7.4 and water up to 1 ml). The reaction was started by addition of the substrate chlorzoxazone<br />
and terminated with 3 ml of dichlormethane.<br />
Determination of the metabolite, 6-hydroxychlorzoxazone, was done by HPLC using LiChrospher<br />
100 RP-18 endcapped column (Merck, Darmstadt, Germany), (250 x 4.6 i.d.) with mobile<br />
phase 25% v/v acetonitrile in 0.5% v/v aqueous acetic acid. The flow rate was 1 ml.min - 1 and<br />
detection at 287 nm according to (8). The HPLC system used was supplied by Shimadzu Class<br />
VP (Tokyo, Japan) consisting of a LC-10AD quaternary pump, a SIL-10AD autosampler and<br />
a SPD-10A UV/VIS detector.<br />
RESULTS AND DISCUSSION<br />
In all three cases studied, the CYP2E1 activity has been successfully reconstituted. The minipig<br />
CYP2E1 was fully functional giving realistic values of both maximum velocity of enzymatic<br />
reaction (V max<br />
) as well as of the Michaelis constant (K M<br />
). The highest value of the V max<br />
was achieved<br />
with minipig P450 reductase (8.45 ± 1.18 nmol of product/min/nmol P450), the lowest with<br />
the rat enzyme (6.29 ± 4.46 nmol/min/nmol P450). The lowest value of the Michaelis constant<br />
indicating the most efficient binding of the substrate was however achieved with the human<br />
P450 reductase (0.562 ± 0.248 mM). The course of the Michaelis-Menten enzyme kinetics for all<br />
three P450 reductases are shown in Figure 1.<br />
The results show that the P450 reductases can be used for reconstitution of the CYP2E1 activity<br />
regardless on their origin. The differences between V max<br />
and K M<br />
values obtained for individual<br />
P450 reductases are not significant. The reason for this low variability is most probably high<br />
degree of structural similarity between P450 reductases of different origin in general (3).<br />
The reasons stressing the im<strong>po</strong>rtance of the results obtained can be summarized as follows.<br />
First reason stems from the fact that the studies on the properties of the CYP2E1 enzyme system<br />
are valuable in all cases as this P450 is known to take part in metabolism of many drugs<br />
and toxicants as e.g. paracetamol, nitrosamines. The results obtained here show that the origin<br />
of the reductases does not influence significantly the enzyme activity of this enzyme. Second reason<br />
is that the results indicate that the CYP2E1 of the minipig is effective in reconstitution systems<br />
in a similar way as the CYP2E1 enzymes of other species. The results obtained here also<br />
contribute to the discussion on the suitability of different experimental animals as models in<br />
experimental pharmacology. Recently, the data obtained have shown that the minipigs or pigs<br />
seem to be good models for drug metabolism in man (11-13) as well as sources of specialized
A C T A M E D I C A M A R T I N I A N A 3 / 1 17<br />
Figure 1<br />
CYP2E1 enzyme kinetics with different P450 reductase enzymes.<br />
A, minipig liver microsomal P450 reductase; B, rat liver<br />
microsomal enzyme; C, human recombinant enzyme. Activity<br />
expressed as nmol product (6-hydroxy chlorzoxazone) formed<br />
per min per nmol P450. Values of V max<br />
and of K M<br />
listed for comparison.<br />
Figure 1A<br />
Vmax<br />
Km<br />
8450 ± 1180 nmol/min/nmol P450<br />
0.708 ± 0.274 mM<br />
Figure 1B<br />
Vmax<br />
Km<br />
6290 ± 4460 nmol/min/nmol P450<br />
0.728 ± 0.141 mM<br />
Figure 1C<br />
Vmax<br />
Km<br />
7750 ± 1408 nmol/min/nmol P450<br />
0.562 ± 0.248 mM<br />
cells suitable for cell therapy providing the problems with immune res<strong>po</strong>nse and <strong>po</strong>ssible viral<br />
infection are solved or at least minimalized (14).<br />
Acknowledgment<br />
The sup<strong>po</strong>rt from the Medical Faculty of Palacky University of Olomouc to the first author<br />
(M.B.) is gratefully acknowledged (LF UP grant No 12101105). P.A. thanks for the sup<strong>po</strong>rt<br />
through the COST B 15.50 project.<br />
REFERENCES<br />
1. Horecker BL. Triphosphopyridine nucleotide-cytochrome c reductase in liver. J Biol Chem 1950; 183:<br />
593-605.<br />
2. Lu AYH, Coon MJ. Role of hemoprotein P450 in fatty acid (-hydroxylation in a soluble enzyme system<br />
from liver microsomes. J Biol Chem 1968; 243: 1331-2.
18<br />
A C T A M E D I C A M A R T I N I A N A 3 / 1<br />
3. Strobel HW, Hodgson AV, Shen S. NADPH cytochrome P450 reductase and its structural and functional<br />
domains. In: Ortiz de Montellano P.R. editor. Cytochrome P450: Structure, Mechanism, and Biochemistry.<br />
2 nd ed. New York: Plenum Press; 1995. p.225-44.<br />
4. Ortiz de Montellano P.R. editor. Cytochrome P450: Structure, Mechanism, and Biochemistry. 2 nd ed. New<br />
York: Plenum Press; 1995.<br />
5. Shimada T, Yamazaki H. Cytochrome P450 reconstitution systems. In: Phillips IR, Shephard EA, editors.<br />
Cytochrome P450 protocols (Meth. Mol. Biol. Vol. 107). Totowa, NJ: Humana Press; 1998. p.85-94.<br />
6. Wang M, Roberts DL, Paschke R, Shea TM, Masters BSS, Kim JP. Three-dimensional structure of<br />
NADPH-cytochrome P450 reductase: Prototype for FMN- and FAD- containing enzymes. Proc Natl Acad<br />
Sci USA 1997; 94: 8411-16<br />
7. Hubbard PA, Shen AL, Paschke R, Kasper CB, Kim JP. NADPH-cytochrome P450 oxidoreductase. Structural<br />
basis for hydride and electron transfer. J Biol Chem 2001; 276: 29 163-70.<br />
8. Lucas D, Berthou F, Girre C, Poitrenaud F, Ménez JF. High-performance liquid chromatographic determination<br />
of chlorzoxazone in serum: A tool for indirect evaluation of cytochrome P4502E1 activity in<br />
humans. J Chromatogr B 1993; 622:79-86.<br />
9. Yasukochi Y, Masters BSS. Some properties of a detergent-solubilized NADPH-cytochrome c (cytochrome<br />
P450) reductase purified by biospecific affinity chromatography. J Biol Chem 1976; 251: 5337-44.<br />
10. Guengerich FP, Martin MV: Purification of cytochromes P450: Rat and human hepatic forms. In: Phillips<br />
IR, Shephard EA, editors. Cytochrome P450 protocols (Meth. Mol. Biol. Vol. 107). Totowa, NJ:<br />
Humana Press; 1998. p.35-54.<br />
12. Souãek P, Zuber R, Anzenbacherová E, Anzenbacher P, Guengerich FP. Minipig cytochrome P450 enzymes<br />
have similar properties to human analogs. BMC Pharmacology 2001; 1: 11.<br />
13. Anzenbacher P, Souãek P, Anzenbacherová E, Gut I, Hrub˘ K, Svoboda Z, Kvûtina J. Presence and activity<br />
of cytochrome P450 isoforms in minipig liver microsomes. Comparison with human samples. Drug<br />
Metab. Dis<strong>po</strong>sition 1998; 26: 56-9.<br />
14. Monshouwer M, van’t Klooster GAE, Nijmeijer SM, Witkamp RF, van Miert AS. Characterization of cytochrome<br />
P450 isoenzymes in primary cultures of pig hepatocytes. Toxicol in Vitro 1998; 12: 715-23.<br />
15. Horslen SP, Hammel JM, Fristoe LW, Kangas JA, Collier DS, Sudan DL, Langnas AN, Dixon RS, Prentice<br />
ED, Shaw BW jr, Fox IJ. Extracor<strong>po</strong>real liver perfusion using human and pig livers for acute liver failure.<br />
Transplantation 2000; 70: 1472-8.<br />
Received: January, 13, <strong>2003</strong><br />
Accepted: April, 29, <strong>2003</strong>
A C T A M E D I C A M A R T I N I A N A 3 / 1 19<br />
ARBOVIRUSES IN SLOVAKIA<br />
ELEâKOVÁ, E. 1 , LABUDA, M. 2 , RAJâÁNI J. 1,3<br />
1<br />
Institute of Virology, Slovak Academy of Sciences, 845 05 Bratislava, Slovak Republic<br />
2<br />
Institute of Zoology, Slovak Academy of Sciences, 845 06 Bratislava, Slovak Republic<br />
3<br />
Department of Microbiology and Immunology, Comenius University, Jessenius Faculty of Medicine,<br />
Faculty Hospital, Martin, Slovak Republic<br />
Abstract<br />
Tick-borne encephalitis (TBE) virus is the most im<strong>po</strong>rtant representative of arboviruses in Slovakia. Since 1951,<br />
when the first epidemic of TBE was described in association with alimentary infection, the to<strong>po</strong>graphy of natural foci, in<br />
which the virus circulates, has been repeatedly documented. The reservoirs of TBE are small rodents and insectivores;<br />
ticks (Ixodes r. spp) transmit the virus and maintain its circulation. The ticks not only behave as TBE virus vectors for wild<br />
living mammals, but they are also the sites for long-term virus persistence and the source of infection for humans. Typically,<br />
the endemic natural foci of TBE virus circulation are confined to southern slopes of the Carpathian mountains and<br />
to the Danube basin. The foci appear most frequently in western parts of the country, but they are also distributed in<br />
middle and eastern Slovakia. The morbidity of TBE, though actually increasing, ranges from 0.6 to 1.6 per 100.000 inhabitants;<br />
thus, it still seems relatively moderate, but cannot be neglected. During the last 5 year follow-up (1996-2000),<br />
the number of TBE patients who acquired the infection by alimentary route was 33; all these patients consumed infected<br />
raw goat milk or infected sheep cheese. In addition to TBE, another 6 arboviruses were isolated in Slovakia (3 of them<br />
from mosquitoes), but their medical im<strong>po</strong>rtance seems less convincing.<br />
Key words: tick-borne encephalitis virus, Ixodes ricinus ticks, virus transmission, morbidity, natural foci<br />
INTRODUCTION<br />
Arboviruses comprise a large group of viruses, which are maintained in nature being transmitted<br />
to vertebrate hosts by vectors such as ticks and mosquitoes. These vectors replicate as<br />
well as transmit arboviruses which belong to several families, such Flaviviridae (genus Flavivirus),<br />
Togaviridae (genus Alphavirus), Bunyaviridae and Reoviridae (Genus Orbivirus). The International<br />
Catalogue of Arboviruses (1975) lists altogether 359 virus species, out of which 7 have<br />
been isolated in Slovakia, namely the tick-borne encephalitis (TBE) virus and the West Nile (WN)<br />
viruses (Flavivirus genus), the Sindbis virus (Alphavirus genus), the ËahyÀa, âalovo and Uukuniemi<br />
viruses (maily Bunyaviridae) and the Tribeã virus (genus Orbivirus). Out of the above mentioned<br />
viruses, medically most im<strong>po</strong>rtant is the TBE virus, a serious pathogen causing meningitis,<br />
encephalitis and paralytic syndrome (1). The TBE virion (Figure 1) contains single stranded<br />
RNA of plus <strong>po</strong>larity which is located inside of the capsid built from C protein and surrounded<br />
by a lipid envelope, containing membrane a (M) protein and a glycoprotein (E). During maturation<br />
at membrane bound vesicles, which are derived from the endoplasmic reticulum, the M protein<br />
undergoes N-terminal cleavage. Finally, the mature enveloped particles leave infected cells<br />
by exocytosis.<br />
Based on serological (virus neutralization) tests, the Flavivirus genus encompasses 9 virus<br />
groups, from which 5 consist of viruses transmitted by mosquitoes, 2 groups encounter viruses<br />
transmitted by ticks and, finally, in 2 groups the vector has not been identified (2). Out of the 6<br />
serologically distinct viruses which belong to the tick-borne encephalitis serogroup (Table 1), the<br />
most im<strong>po</strong>rtant members are the Eastern and Western subtypes of TBE virus (3). These two subtypes<br />
seem closely related, since their structural genes are identical in 86-98% nucleotides (4);<br />
Address for corres<strong>po</strong>ndence:<br />
Assoc. prof. Július Rajãáni, M.D., DSc., Department of Microbiology and Immunology, Comenius University,<br />
Jessenius Faculty of Medicine, Sklabinská 26, 037 53 Martin<br />
Phone: ++421 043 4239 038<br />
e-mail: rajcani@jfmed.uniba.sk
20<br />
A C T A M E D I C A M A R T I N I A N A 3 / 1<br />
A<br />
B<br />
Figure 1. Assembly and maturation of TBE virions in infected cells. The TBE virus nucleocapsid (1A) is surrounded with<br />
a lipid envelope containing the E and M proteins. During maturation, the M protein undergoes cleavage at its N-terminus.<br />
The mature particles accumulate within cytoplasmic vesicles (derived from the endoplasmic reticulum) before being<br />
released from infected cells (1B).<br />
Table 1. The tick-borne encephalitis (TBE) virus complex.<br />
Virus type Virus subtype Occurrence of natural foci*<br />
TBE virus Western (European) Europe from Scandinavia to the Mediterranean<br />
Sea; from the Atlantic to Red Sea and from<br />
Finland to Volga river in Kasachstan eastwards<br />
from Caspian Sea.<br />
Eastern (Russian spring-summer<br />
encephalitis viruses)<br />
Siberia from Ural mountains to the Pacific coast**<br />
Langat virus<br />
Powassan virus<br />
Louping ill virus<br />
Omsk hemorrhagic fever virus<br />
Kyasanur forest disease virus<br />
South East Asia, Philippines<br />
Canada, USA<br />
Scotland Ireland Spain Turkey<br />
Western Siberia<br />
India<br />
*see also Figure 2<br />
**Kamchatka peninsula and the Hokkaido island included<br />
this also results into a high homology of their corres<strong>po</strong>nding proteins (Table 2). Both TBE viruses<br />
occur in natural foci, which are widely distributed over the Eurasian continent (Fig. 2), cover<br />
the whole Europe, Central Asia, and Southern parts of Siberia from Ural mountains towards the<br />
Pacific coast (3). Within their natural foci, both viruses are transmitted by different vector species,<br />
namely the Western subtype by Ixodes ricinus ticks, while the Eastern subtype is transmitted<br />
by Ixodes persulcatus ticks. The essential role of Ixodes ricinus ticks for TBE virus vectors<br />
has been firmly documented in Slovakia by repeated isolations coming from nymphs as well<br />
as from mature imagoes (5, 6, 7). Here we re<strong>po</strong>rt the incidence of Western (European) subtype of<br />
TBE virus in Slovakia based on our long-term surveillance data.<br />
MATERIALS AND METHODS<br />
TBE virus isolation. The tick and organ suspensions (coming from small free living rodents) were<br />
prepared by tissue homogenization; they were subsequently inoculated into outbred suckling laboratory<br />
white mice by intracerebral (i.c.) route. Thereafter, the virus isolates were identified by serological<br />
tests [complement fixation, hemagglutination inhibition (HI)] using a reference antiserum (8, 9).<br />
Virus titrations. The presence of TBE virus in tick and/or tissue homogenates, in blood and<br />
in cell culture nutrient fluids was determined in pig kidney (PK) cells grown in plastic 24-well<br />
plates according to standard procedures (medium BEM with 10% calf serum supplemented with<br />
antibiotics). Virus titers were read according to developing cytopathic effect and according to<br />
virus dilutions the TCID 50<br />
values were calculated.
A C T A M E D I C A M A R T I N I A N A 3 / 1 21<br />
Table 2. Properties of both TBE virus subtypes.<br />
European subtype<br />
Eastern subtype<br />
Genome Encodes a <strong>po</strong>lyprotein of 3414 aa* Encodes a <strong>po</strong>lyprotein of 3412 aa*<br />
Encephalitis Focal lesions, lethality 8%<br />
Vector Ixodes ricinus Ixodes persulcatus<br />
Distribution Europe, Central Asia Siberia, Eastern Russia<br />
* amino acid number<br />
Figure 2. Distribution of the Western (dotted line) and Eastern (solid line) subtypes of TBE virus on the Eurasian continent<br />
(according to Blaskoviã et al., Bull WHO 1967, 36, pp. 86-94).<br />
Serological examinations. The presence of specific antibody in various sera coming from small<br />
rodents, large mammals, goats, sheep and/or captured birds was determined by hemagglutination<br />
inhibition (HI) tests using a prototype TBE virus antigen prepared from infected mouse brains<br />
by sucrose-acetone extraction. Four to eight units of antigen were used in each test (9). Before<br />
use, the sera were adsorbed to goose erythrocytes and delipidized with acetone.<br />
RESULTS AND DISCUSSION<br />
Several natural foci of European TBE virus subtype were recognized in Slovakia during the<br />
last three decades surveillance (Fig.3). Typically, the foci occur in forested areas with an average<br />
temperature of 8 °C and a yearly waterfall of 800 mm (10). The incidence of Ixodid ticks within<br />
the foci is relatively high (11). According to their geographical distribution, the Carpathian<br />
and the Pannonian biotypes can be clearly distinguished (12). The Carpathian foci situated at<br />
southern slopes of West Carpathian mountains are rich of luxuriant tree forests with herbaceous<br />
underground. The Pannonian foci, which are situated at lowlands along the Danube river<br />
basin, are characterized by a highly cultivated landscape separated with small woods consisting<br />
of oak trees and swampy woods with combined vegetation and a very rich undergrowth. In Slovakia,<br />
six tick species can be found, Ixodes ricinus, Dermacentor marginatus, D. reticulates, Haemaphysalis<br />
inermis, H. punctata and H. concinus. From 1964 to 1999 altogether 77,000 ticks<br />
were collected, <strong>po</strong>oled and examined for infectious virus presence. Most frequently Ixodes ricinus<br />
species was idenitified (69,022 inidividuals, i.e. 89.6%), from which 98 TBE virus isolates were<br />
obtained, an infection rate of 0.14%. However, the TBE virus infection rate of the ticks within<br />
Carpathian foci may be as high as 2.6%, while the number of infected ticks within the Pannonian<br />
foci namely at the Danube banks never exceeds 0.1% (13). In general, three conditions favor
22<br />
A C T A M E D I C A M A R T I N I A N A 3 / 1<br />
Figure 3. The natural foci of TBE virus in Slovakia are situated at the southern slopes of Carpathian mountains (Carpathian<br />
biotype) and along the Danube river basin (Pannonian biotype).<br />
Figure 4. Circulation of TBE in a natural focus depicting the accidental infection of man. Note that from domestic animals<br />
such as goats, the virus may be transmitted via milk (alimentary infection). For details see Gre‰íková M, Kalúzová<br />
M. Biology of tick-borne encephalitis. Acta Virol. 1997; 41: 115-124.<br />
to development of natural foci: the virus itself, the presence of the specific vector and the free<br />
living vertebrate hosts (14). Non-infected ticks acquire the virus during co-feeding with the infected<br />
ones on the vertebrate host, on small rodents and/or birds (15). Nevertheless, the virus circulation<br />
is clearly maintained by transmitting the virus from one host to another in association<br />
with the blood meal. After ingestion, the virus replicates in the gut epithelium cells, within<br />
the ganglion and in salivary glands of the tick vector and becomes shed by saliva (16). Humans<br />
have no essential role in virus circulation in natural foci, since they represent the dead end or<br />
an accidental link (Figure 4).
A C T A M E D I C A M A R T I N I A N A 3 / 1 23<br />
Table 3. TBE virus infection of Ixodes ricinus ticks collected in regions of Eastern Slovakia in June 1996 and 1997.<br />
Locality Nymph no Adult no Ticks total Per cent<br />
Gemerská Poloma 1/29* 3/3 4/32 12.5%<br />
Miklu‰ovce 1/1 0/8 1/9 11.1%<br />
NiÏn˘ Medzev n.d. 2/10 2/10 20.0%<br />
Total 2/30 5/21 7/51 13.7%<br />
* <strong>po</strong>sitive out of total<br />
Table 4. Occurrence of neutralizing antibodies against TBE virus in small rodents in Slovakia in the years 1964-1996.<br />
Species Serum sample number Sero<strong>po</strong>sitive rate<br />
A<strong>po</strong>demus flavicollis 316/2 105* 15%<br />
A<strong>po</strong>demus sylvaticus 57/626 9.1%<br />
A<strong>po</strong>demus agrarius 6/42 14.3%<br />
Clethrionomys glareolus 429/2 895 14.8%<br />
Pitymys subterraneus 13/136 9.6%<br />
Microtus arvalis 28/344 8.1%<br />
Other species 6/50 12%<br />
Total 855/6198 13.8%<br />
* <strong>po</strong>sitive out of total<br />
During the last decades, the locations of natural foci have remained surprisingly unchanged;<br />
however, new foci might have developed and could be discovered based on virus isolation even<br />
from a relatively small number of collected ticks. For example, in East Slovakia we obtained<br />
seven TBE isolates from 51 ticks collected at three foci during years 1996-1997; this fact <strong>po</strong>ints<br />
at a relatively high infestation rate of 13.7% and testifies an activity of the foci in question (Table<br />
3). Thus, the TBE virus may persist within its natural foci for many years. This was demonstrated<br />
in the Gemerská Poloma locality, where, in addition to the 4 TBE virus isolates coming from<br />
Ixodes ricinus ticks, another 4 isolates have been obtained from brains of small rodents (A<strong>po</strong>demus<br />
flavicollis, and Clethrionomys glareolus). During the year 1996, thirteen serologically confirmed<br />
cases of TBE were registered in this area; the sero<strong>po</strong>sitive rate among local goats was as<br />
high as 80%. This example signalizes an exceptionally high infection rate among domestic animals<br />
and small rodents, who are the hosts for tick vectors. This resulted in accidental infection<br />
of many human subjects confirming that the natural foci in RoÏÀava district, where the first TBE<br />
virus focus had been discovered in 1951, have remained active over the period of the last 50<br />
years. The percentage of infected ticks in the natural foci varies from 0.1% to 5% depending on<br />
the season and of the focus type. The infected ticks may be trans<strong>po</strong>rted to long distances by<br />
migrating birds or to short distances by hunted mammals. Both movements would allow the<br />
establishment of new foci. About 30% of natural foci in Slovakia were identified according to TBE<br />
virus isolations from small rodents, namely the yellow necked mouse (A<strong>po</strong>demus flavicollis) and<br />
the bank vole (Clethrionomys glareolus), which not only represent the most frequent virus reservoirs<br />
but also the most frequent free living mouse species at our territory (17). Therefore, they<br />
are good indicators reflecting the TBE virus circulation within a given locality. These animals<br />
reproduce quickly (4-5 months) and are preferred for feeding by nymphs and larvae of the vector<br />
species. The im<strong>po</strong>rtance of small rodents for maintaining TBE virus circulation within natural<br />
foci was also confirmed by following the kinetics of virus neutralizing antibodies (Table 4). In<br />
addition to ticks and small rodents, the TBE virus was isolated from insectivores (hedgehogs,<br />
shrews and moles) and birds (wilds ducks, lapwings; (Figure 5). The persistence of TBE in nature<br />
not only requires a high density of ticks, but also a high <strong>po</strong>pulation density of vertebrate hosts<br />
to ensure successful virus transmission (18). Furthermore, ticks feed on large vertebrates such
24<br />
A C T A M E D I C A M A R T I N I A N A 3 / 1<br />
Figure 5. Isolations of TBE virus from small rodents, insectivores and birds; both biotypes included. The distribution of<br />
TBE virus alimentary infections is marked by rectangles. Transmission by goat milk was confirmed in RoÏÀava and<br />
PovaÏská Bystrica districts, while transmission by sheep cheese was described in districts To<strong>po</strong>ºãany, Luãenec, Gelnica<br />
and Svidník.<br />
as goats, sheep, livestock and on large hunted mammals. These contribute indirectly to keep the<br />
TBE virus circulating. The latter mammals function as indicator hosts rather than as true reservoirs.<br />
Out of 184 serum samples coming from hunted animals, the sero<strong>po</strong>sitive rate ranged from<br />
3.8 to 27.8% (Table 5).<br />
The number of TBE cases confirmed by laboratory methods during the last two decades in<br />
Slovakia ranged from 20 to 90 per year. After an increase in the fifties of 20 th century, some dec-
A C T A M E D I C A M A R T I N I A N A 3 / 1 25<br />
Table 5. Hemagglutination inhibition (HI) antibodies in large mammals in Western Slovakia from 1997 to 2000.<br />
Mammal HI antibody titer Per cent<br />
Wild boar 7/87* 8.0%<br />
Moufflon 3/79 3.8%<br />
Deer 5/18 27.8%<br />
* <strong>po</strong>sitive out of total<br />
10<br />
9<br />
8<br />
7<br />
6<br />
5<br />
4<br />
3<br />
2<br />
1<br />
0<br />
1952 1954 1956 1972 1974 1976 1978 1983 1985 1987 1992 1994 1996 1998 2001<br />
Figure 6. The TBE morbidity per 100 000 inhabitants during the last four decades in Slovakia (based on cases confirmed by<br />
laboratory examinations).<br />
Table 6. Alimentary TBE virus infections in Slovakia during the period from 1951 to 2000.<br />
Locality District Number of cases Date Vehicle<br />
RoÏÀava RoÏÀava 271 May 1951 Goat milk<br />
Závada To<strong>po</strong>ºãany 12 April 1974 Sheep cheese<br />
Doln˘ Mo‰tenec PovaÏská Bystrica 4 May 1984 Goat milk<br />
Dolná Breznica 7 August 1989 Goat milk<br />
Lednické Rovné 7 September 1993 Goat milk<br />
Gemerská Poloma RoÏÀava 13 May 1996 Goat milk<br />
Jaklovce Gelnica 6 May 1998 Sheep cheese<br />
Ábelová Luãenec 7 May 1999 Sheep cheese<br />
·ari‰sk˘ ·tiavnik Svidník 4 May 1999 Sheep cheese<br />
Lednické Rovne PovaÏská Bystrica 3 May 2000 Goat milk<br />
Table 7. HI antibodies against TBE virus in goats and sheep in alimentary infection areas during years 1996-2000.<br />
Locality Goats Sheep Peak HI Ab titer<br />
Gemerská Poloma 42/52* n.d. 1:640<br />
Jaklovce n.d. 6/246 1:40<br />
Ábelová 6/64 11/250 1:40<br />
·ari‰sk˘ ·tiavnik 1/4 6/204 1:80<br />
Lednické Rovne 1/1 n.d. 1:160<br />
* <strong>po</strong>sitive out of total
26<br />
A C T A M E D I C A M A R T I N I A N A 3 / 1<br />
Table 8. Arboviruses (other than TBE virus) isolated in Slovakia.<br />
Virus Host Vector Specific antibodies Pathogenicity Notes<br />
West Nile Birds Mosquitoes (genus Birds, hunted mammals, Fever, headache, exantema, Isolated from Aedes cantans<br />
Culex) domesticated mammals lymphadenopathy, arthralgia (25) and from birds 1 (26) alongside<br />
the Ipeº and Bodva rivers<br />
Sindbis Birds, frogs, Mosquitoes (genus Birds, hunted mammals, Fever, myositis, headache Isolated from birds 2 (27),<br />
hamsters Culex) domesticated mammals, man. at Záhorie; isolated from hamsters 3<br />
(28) at Eastern Slovakia<br />
and frogs 4 (29) at Záhorie<br />
ËahyÀa Birds, hair, hedghog, Mosquitoes Aedes Birds, hunted „flu“-like syndrome Isolated from Aedes vexans<br />
deer, fox, mammals, man or caspius (30) at East Slovakia<br />
and from human blood (31)<br />
âalovo Birds, livestock, Mosquitoes Domestic animals, man, Mild disease with fever Isolated from Anopheles mac.<br />
horses, swine hunted mammals, water birds (32) at the Danube basin<br />
Uukuniemi Birds, small rodents Ixodid ticks Birds, man Not determined Isolated from Ixodes ricinus (33)<br />
and from mice 5 [34] at To<strong>po</strong>ºãianky<br />
district<br />
Tribeã Small rodents Ixodid and Man at low rate Mild meningitis 6 Isolated from ticks 7 and small<br />
Haemaphysalis ticks rodents in Tribeã mountains (35)<br />
1<br />
Vanellus v., Streptopalia t., Tringa ochropus; 2 Acrocephalus s.; 3 Cricetusc c.; 4 Rana r.;<br />
5<br />
A<strong>po</strong>demus flavicollis;<br />
6<br />
Experimentally confirmed in monkeys using the related Kemerovo virus (36); 7 Ixodes ricinus
A C T A M E D I C A M A R T I N I A N A 3 / 1 27<br />
line was observed in the seventies. However, from 1994 the number of clinically apparent cases<br />
began rising again, so that the morbidity nowadays exceeds 1/100 000 (Figure 6). The majority<br />
of cases has remained associated with the activity of ticks in May and/or June. TBE may be<br />
regarded for an occupational disease of agricultural and forest workers. Tourists may become<br />
affected when coming to natural foci. The highest morbidity is observed in Western Slovakia due<br />
to a higher density of foci in this part of the country.<br />
During the first well documented outbreak in RoÏÀava in 1951, the virus was found to infect<br />
children by alimentary route after ingestion of raw goat milk (19). Alimentary infections appear<br />
in small epidemics with a family confined occurrence (20, 21, 22, 23). All such microepidemics<br />
registered in Slovakia were either due to ingestion of goat milk or sheep cheese (Table 6). Figure<br />
5 also shows the areas, where alimentary infections occurred; these locations, of course, only<br />
partially overlap with the distribution of free living rodents, i.e. only in a few natural foci the TBE<br />
virus gets frequently transmitted to domesticated milk giving mammals. As already mentioned,<br />
the sero<strong>po</strong>sitive rate of HI antibodies in goats of a single focus has reached the alarming value<br />
of 80%. Experimentally infected goats and/or sheep would develop viraemia followed by excretion<br />
of the virus to milk [24]. Thereafter, alimentary transmission occurs, if the virus was not properly<br />
inactivated by pasteurization or if infected raw milk has been ingested. During the period<br />
of 1996-2000 altogether 33 patients from 5 districts were enrolled to Slovakian hospitals who<br />
had TBE and a history of alimentary infection by goat milk or sheep cheese. Though the virus<br />
could not be always isolated from the milk product in question, the presence of high HI antibody<br />
titers in the corres<strong>po</strong>nding goats and/or sheep was obvious (Table 7).<br />
Despite of its moderate morbidity and lower lethality (Table 2, Figure 6), the European type<br />
TBE still represents a permanent risk, especially in the natural foci associated with an endemic<br />
occurrence of the disease. Epidemiological surveyllance of the documented natural foci and further<br />
active search for <strong>po</strong>tential new ones is based on the history of TBE cases. Such investigations<br />
are still relevant. For protection of subjects frequently visiting the natural foci, vaccination<br />
is indicated. Immunoprophylactic vaccination seems inevitable for subjects who are professionally<br />
ex<strong>po</strong>sed to tick bite when working within natural foci. Relevant information about the territory<br />
of foci and of the vaccine itself should be available for tourists and even for wide public.<br />
Though the medical im<strong>po</strong>rtance of the rest of arboviruses isolated in Slovakia is less striking<br />
than that of TBE virus, non of them can be fully neglected (Table 8).<br />
REFERENCES<br />
1. Westaway EG, Brinton MA, Gaidamovich SY, Horzinek MC, Igarashi A, Kaariainen L, Lvov DK, Porterfield JS, Russell<br />
PK, Trent DW. Flaviviridae. Intervirology 1985; 24 : 183-192.<br />
2. Murphy FA, Fauquet CM, Bishop DHL, Ghabrial SA, Mayo MA, Summers MD. (ed.) Virus Taxonomy. Classification<br />
and Nomenclature of Viruses. Wien-New York, Springer Verlag, 1995.<br />
3. Gre‰íková M, Calisher CH. Tick-borne encephalitis. In: The Arboviruses: Epidemiology and Ecology (T. P. Monath,<br />
ed.) CRC Press Inc., Boca Raton, Florida 1988: 177-202.<br />
4. Mandl CW, Heinz FX, Kunz C. Sequence of the structural proteins of the tick-borne encephalitis virus (western subtype)<br />
and comparative analysis with other flaviviruses. Virology 1988; 166: 197-205.<br />
5. Gre‰íková M, Nosek J. Isolation of tick-borne encephalitis virus from Ixodes ricinus ticks in the Tribeã region. Bull<br />
Wld Hlth Org. 1967; Suppl 1: 67-71.<br />
6. Gre‰íková M, Sekeyová M. Characteristics of some tick-borne encephalitis virus strains isolated in Slovakia. Acta<br />
Virol 1980; 24: 72-75.<br />
7. Gre‰íková M, Palanová A, Potheová A, Teplan J, Sekeyová M, Kohútová V. Contribution to the detection of a natural<br />
focus of tick-borne encephalitis in the south of middle Slovakia. Bratisl lek Listy 1983; 80 (4): 385-512.<br />
8. Casals J, In: Maramorosh K, Koprowski H. (Eds.). Methods in Virology. New York – London, Academic Press 1967;<br />
3: 163-181.<br />
9. Clarke DH, Casals J. Techniques for haemagglutination and haemagglutination-inhibition with arthro<strong>po</strong>d-borne<br />
viruses. Am J Trop Med Hyg 1958; 7: 561-573.<br />
10. Labuda M, KoÏuch O, Lys˘ J. Tick-borne encephalitis natural foci in Slovakia: ticks, rodents, and ...goats. In: Tickborne<br />
Encephalitis and Lyme Borreliosis, Potsdam Sym<strong>po</strong>sia (J. Suess and O. Kahl, eds.) Pabst Science Publishers,<br />
Lengerich 1997: 34-46.<br />
11. Nuttall PA, Labuda M. Tick-borne encephalitis subgroup. In: Ecological Dynamics of Tick-borne Zoonoses (D. E.<br />
Sonenshine and T. N. Mather, eds.) Oxford University Press, New York, Oxford 1994: 351-391.
28<br />
A C T A M E D I C A M A R T I N I A N A 3 / 1<br />
12. Gre‰íková M. Studies on tick-borne arboviruses isolated in Central Europe. Biological works SAV, Bratislava 1972;<br />
18: 1-111.<br />
13. Gre‰íková M, Nosek J. Arboviruses isolated from ticks in Central Europe. Biologia 1982; 37: 755-763.<br />
14. Pavlovskij EN. Kle‰ãi i kle‰ãevoj encefalit. Parazitologija Daºnego Vostoka Medgiz. Moskva 1947: 212.<br />
15. Labuda M, Danielova, V, Jones, LD, Nutall, PA: Amplification of tick-borne encephalitis virus infection during co/feeding<br />
of ticks. Med Vet Entomol 1993; 7; 339-342.<br />
16. Rajãáni J, Nosek J, KoÏuch O., Waltinger H.: Reaction of the host to the tick bite: Distribution of tick borne encephalitis<br />
virus in sucking ticks. Zbl Bakt Hyg I, Abt. Orig. A 1976; 236; 1-9.<br />
17. KoÏuch O, Labuda M, Lys˘ J, Weismann P, Krippel E. Longitudinal study of natural foci of Central European encephalitis<br />
virus in West Slovakia. Acta Virol 1990; 34: 537-544.<br />
18. Labuda M, Austyn JM, Îuffová E, KoÏuch O, Nuttall PA. Im<strong>po</strong>rtance of localised skin infection in tick-borne encephalitis<br />
virus transmission. Virology 1996; 219: 357-366.<br />
19. Bla‰koviã D. An epidemic of encephalitis in the natural infective focus in RoÏÀava. Vydavateºstvo SAV, Bratislava;<br />
1954.<br />
20. Gre‰íková M, Sekeyová M, Stúpalová S, Neãas S. Sheep milk-borne epidemic of tick-borne encephalitis in Slovakia.<br />
Intervirology 1975; 5: 57-61.<br />
21. Îaludko J, Vrbová O, Hachlincová R, Kohl I, Hubálek Z, Jufiicová Z, KoÏuch O, Eleãková E, Labuda M. Cases of family<br />
epidemics of tick-borne encephalitis in the central part of PovaÏie. Bratisl lek Listy 1994; 95: 523-526.<br />
22. Kohl I, KoÏuch O, Eleãková E, Labuda M, Îaludko J. Family outbreak of alimentary tick-borne encephalitis in Slovakia<br />
associated with a natural focus of infection. Europ J Epidemiol. 1996; 12: 373-375.<br />
23. Kohl I, Gre‰íková M, Kohútová V, Îaludko J, Sekeyová M. Investigations on a natural focus of tick-borne encephalitis<br />
in the PovaÏská Bystrica district. Biologia (Bratislava) 1989; 44: 267-273.<br />
24. Gre‰íková M. Recovery of the tick-borne encephalitis virus from the blood and milk of subcutaneously infected sheep.<br />
Acta Virol 1958; 2: 113-119.<br />
25. Labuda M, KoÏuch O, Gre‰íková M. Isolation of West Nile virus from Aedes cantans mosquitoes in West Slovakia.<br />
Acta virol 1974; 18: 429-433.<br />
26. Gre‰íková M, Sekeyová M, Prazniaková E. Isolation and identification of group B arboviruses from the blood of birds<br />
captured in Czechoslovakia. Acta Virol 1975; 19: 162-164.<br />
27. Ernek E, KoÏuch O, Nosek J, Gre‰íková M, Sekeyová M. Isolation of Sindbis virus from the reed warbler (Acrocephalus<br />
scirpaceus) in Slovakia. Acta virol. 1973; 17: 359-361.<br />
28. Gre‰íková M, Sekeyová M, Batíková M, Bieliková V. Isolation of Sindbis virus from organs of a hamster in East Slovakia.<br />
1. Internationales Arbeitskolloquium ıber Naturherde von Infektionskrankheiten in 17-19. april 1973, Illmitz<br />
und Graz 1973, p. 112-113.<br />
29. KoÏuch O, Labuda M, Nosek J. Isolation of Sindbis virus from the frog Rana ridibunda. Acta Virol 1978; 22: 78.<br />
30. Bárdo‰ V, Danielová V. Virus ËahyÀa – virus isolated from mosquitoes in Czechoslovakia. J Hyg Epid Microbiol<br />
Immunol 1959; 3: 264-276.<br />
31. ·imková A, Sluka F. Isolation of ËahyÀa virus from the blood of a case of influenza – like disease. Acta Virol 1973;<br />
17: 94.<br />
32. Bárdo‰ V, Danielová V. Study on the relationship of ËahyÀa virus – Aedes vexans under natural conditions. âs epid<br />
Mikrobiol Imunol 1961; 10: 389-395.<br />
33. KoÏuch O, Gre‰íková M, Nosek J. Poteplí – Uukuniemi virus isolated from Ixodes ricinus ticks in Slovakia. Acta Virol<br />
1968; 12: 475.<br />
34. KoÏuch O, Rajãáni J, Sekeyová M, Nosek J. Uukuniemi virus in small rodents. Acta Virol 1970; 14: 163-166.<br />
35. Gre‰íková M, KoÏuch O, Ernek E, Nosek J. „Tribeã“ a newly isolated virus from tick Ixodes ricinus and small rodents<br />
In. B. Rosick˘ and K. Heyberger (ed.): Theoretical questions of natural foci of diseases. Proceeding of a sym<strong>po</strong>sium.<br />
Czechoslovak Acad. Sci. Prague. 1965; p. 439.<br />
36. Líbiková H, Tesafiová J, Rajãáni J. Experimental infection of monkeys with Kemerovo virus. Acta Virol 1970; 14; 64-<br />
69.<br />
Received: May, 29, <strong>2003</strong><br />
Accepted: June, 20, <strong>2003</strong>
A C T A M E D I C A M A R T I N I A N A 3 / 1 29<br />
PREVALENCE OF PROTHROMBIN MUTATION GENE (G→A 20210)<br />
IN THROMBOPHILIC PATIENTS<br />
JURAJ CHUDEJ 1 , STANISLAVA KONEâNÁ 1 , IVANA PLAME≈OVÁ 1 , JELA IVANKOVÁ 1 ,<br />
JAN HUDEâEK 1 , JÁN STA·KO 1 , RUDOLF PULLMANN 2 , VLADIMÍR MELU·2 , PETER KUBISZ 1<br />
1<br />
Department of Hematology and Blood Transfusion, National Centre of Hemostasis and Thrombosis,<br />
Comenius University, Jessenius Faculty of Medicine, Faculty Hospital, Martin, Slovak Republic<br />
2<br />
Department of Clinical Biochemistry, Comenius University, Jessenius Faculty of Medicine, Faculty Hospital,<br />
Martin, Slovak Republic<br />
Abstract<br />
Pathogenesis of venous thrombosis is multifactorial. In more than 40% of patients it is a familiar affliction, based on different<br />
congenital defects of haemostasis e.g. PC, PS, AT III deficiency or a resistance to activated protein C (APC-R), or<br />
recently discovered variant of prothrombin 20210 A.<br />
In this study we investigated the prevalence of the prothrombin 20210A mutation in our <strong>po</strong>pulation of patients with<br />
thrombophilic state. We have detected higher prevalence of this gene mutation (8,6 %) in a group of our so far examined<br />
patients than it is in other neighbouring countries (Poland, Italy, England, Sweden, France).<br />
Key words: prothrombin gene mutation (G→A 20210), thrombophilia, DNA analysis<br />
INTRODUCTION<br />
Mutation of prothrombin gene that leads to variant PT 20210 G→A was described in 1996 by Poort<br />
et al.(1). PT 20210 mutation connected with threefold higher risk of thrombosis occurs in the 3rd<br />
untranslated part of the gene on <strong>po</strong>sition 20210A (PT 20210 G→A) (1,2). This defect is transmitted as<br />
an autosomal dominant disorder. Mutation was found in 18% of patients in a study of selected members<br />
of families with <strong>po</strong>sitive anamnesis of venous thrombosis (1). Presence of this mutation was discovered<br />
in 20% of patients with cerebral venous thrombosis. The gene increases a risk of thrombosis<br />
onset 10.2 times (3). Role of prothrombin allele 20210A in pathogenesis of arterial thrombosis is still<br />
a subject of discussion (4,5). In another study, 87% of patients with PT mutation had level of prothrombin<br />
more than 115 % of a normal level, with 2.1 fold increase in risk of thrombosis (6,7). In the<br />
past it was thought that assessment of prothrombin level would be a good screening test for this mutation<br />
(7,8). Nevertheless, recent studies have proved just a minimal relationship between prothrombin<br />
plasma levels and the presence of this mutation (9). Prevalence of the variant PT 20210 G→A is different<br />
in various <strong>po</strong>pulations (10,11). Similar to prevalence of FV Leiden, occurrence of PT 20210 G→ A<br />
mutation is higher in European <strong>po</strong>pulation and only very rare in African and Asian <strong>po</strong>pulations. The<br />
alleles seem to be rare among native Americans, black Africans, Amazonian Indians, Asians, Indians<br />
and Inuits (10,11). Rosendaal et al. have discovered 3% prevalence among inhabitants of southern<br />
Europe and 1.7% in the <strong>po</strong>pulation of northern Europe (10,11). In northern Europe PT<br />
20210G→A occurs in 2% of thromboses. In Catalonia (Spain) where the prevalence of this anomaly<br />
is almost 6.5%, PT 20210 G→A is a cause of more than 6% of thromboses (12). In countries of the<br />
southern Europe variant prothrombin is more frequent cause of a thrombophilic state than FV Leiden<br />
(9,11). Very obvious is an interaction with other risk factors e.g. hormonal therapy with oral contraceptives<br />
that elevate risk of thrombosis 150 times (3, 13, 14 ).<br />
METHODS<br />
For DNA analysis of prothrombin 20210 G→A gene mutation sample of 4 ml of venous blood is<br />
taken into a special test-tube with content of 400 µl 0.5 M EDTA. Lysis of erythrocytes is done by<br />
Address for corres<strong>po</strong>ndence:<br />
Prof. Peter Kubisz,M.D., DSc., Department of Hematology and Blood Transfusion,<br />
National Centre of Hemostasis and Thrombosis, Comenius University, Jessenius Faculty of Medicine<br />
and Faculty Hospital, Kollárova 2, 036 59 Martin, Slovak Republic<br />
Phone: ++421 43 413 3308, 4203 233, Fax: ++421 43 4132 061<br />
e-mail: kubisz@jfmed.uniba.sk
30<br />
A C T A M E D I C A M A R T I N I A N A 3 / 1<br />
Figure 1<br />
Lane M: molecular weight marker<br />
Lane 1: FII allele 20210 cleaved PCR product (345 bp → 322 bp + 23<br />
bp* by Hind III restriction enzyme)<br />
Lane 2: Heterozygous 20210 G/A genotype (345 bp, 322 bp, 23 bp*)<br />
Lane 3: Homozygous 20210 A/A genotype (322 bp, 23 bp*)<br />
*: 23 bp fragment is too small and migrating out of agarose gel<br />
(i.e. 23 bp fragment isn’t present at the picture)<br />
Lane 4: Homozygous 20210 G/G genotype (healthy individual ‘– 345 bp)<br />
– 345 bp<br />
– 322 bp<br />
M 1 2 3 4<br />
– 23 bp<br />
a lysing hy<strong>po</strong>tonic solution (0,155 M NH 4<br />
Cl + 0,17 M Tris-HCl, pH = 7.6, 9 : 1). It is mixed with blood<br />
in the ratio 6 : 1.This is followed by an incubation in water thermostat at the temperature of 37 °C.<br />
Leucocytes are separated from the sediment by centrifugation (4.000 g, 10 min, 25 °C) and then washed<br />
by 0,15 M NaCl solution. After another centrifugation the sediment consisting of leucocytes is dissolved<br />
in a high-concentration buffer solution TE (100 mM Tris-HCl, 40 mM EDTA, pH = 8) and this<br />
volume is mixed with a lysing mixture (0.2% SDS, 1M NaCl, 40 mM EDTA, 100mM Tris-HCl, pH = 8)<br />
in 1:1 ratio. Cellular debris is removed by adding an equivalent amount of the mixture phenol : chloroform<br />
(3 : 1). Then the mixture is divided by a centrifugation into few phases, the top pure one contains<br />
DNA. The phase containing DNA is rewashed by an equivalent amount of chloroform : izoamylalcohol<br />
(24 : 1) and then centrifugated again. The top layer, rich in DNA is afterwards mixed with an equivalent<br />
amount of the mixture of izopropylalcohol : NH 4<br />
Ac (10 : 1). DNA in this mixture coagulates into<br />
a form of white clouds, that are transferred into a microtest-tube. DNA has to be purified from salts by<br />
70 % alcohol. After centrifugation (10.000 g, 10 min, 25 °C) the DNA sediment is dried in a vacuum and<br />
dissolved in a buffer solution TE (10 mM Tris-HCl, 1 mM EDTA). DNA specimen processed in this way<br />
is suitable for PCR genetic analysis. Presence of prothrombin gene mutation 20210 G→A is assessed<br />
by a <strong>po</strong>lymerase chain reaction (PCR). Method is based on enzyme amplification of selected part of DNA<br />
in vitro. A subsequent effect of a restrictive endonuclease (in our case Hind III) cleaves selected DNA<br />
into fragments, which size and amount depends on the presence of the mutation. Fragments of DNA<br />
are visualized by an agarose gel electrophoresis. The method enables to distinguish a healthy individual<br />
from a heterozygous or homozygous carrier of prothrombin gene mutation (1; Figure1).<br />
RESULTS<br />
In our study, we examined 2046 patients with thromboembolic disease in their clinical history<br />
(deep venous thrombosis, pulmonary embolism).<br />
Presence of prothrombin 20210A gene mutation was detected in 176 patients (8,6%) with VTE.<br />
Homozygous carriers represent 1.8% and heterozygotes create 98.2% of this count (Table1).
A C T A M E D I C A M A R T I N I A N A 3 / 1 31<br />
Table 1. Prevalence of prothrombin variant 20210A in the thrombophilia patients.<br />
Mutation 20210 G→A Heterozygotes G/A Homozygotes A/A<br />
8.6% (176) 98.2% (175) 1.8% (1)<br />
DISCUSSION<br />
From comparison with known results of the prevalence of prothrombin gene mutation in<br />
thrombophilic patients in different countries (10, 11), it is obvious that prevalence of the mutation<br />
of this hereditary thrombophilia in Slovakia is much higher than European average.<br />
Prothrombin gene mutation 20210 G→A, can be asymptomatic. More often we can observe<br />
maniphest trombophilia e.g. deep venous thrombosis, pulmonary embolism, even in young individuals<br />
(11, 15 ). The prevalence of prothrombin mutation in Europe varies from 1% to 6,5% (except<br />
of Catalonia) (10, 11, 12). In our study we have observed higher prevalence of prothrombin<br />
20210G→A gene mutation in comparison with European average prevalence. It is therefore necessary<br />
to identify a degree of the risk, in order to prevent thrombosis (prophylaxis in stress situations<br />
in identified defects). It is im<strong>po</strong>rtant to search for endangered individuals and define situations<br />
that are <strong>po</strong>tentially thrombogenic so that we could decide for an appropriate therapy to prevent<br />
recidivation and indicate a necessary length of therapy to ensure secondary prevention. It is<br />
im<strong>po</strong>rtant, as well, to examine members of the affected family (direct relatives of the patient) so<br />
that in stress situations (immobilisation, surgery, pregnancy, puerperium) we can use an appropriate<br />
prophylaxis.<br />
Our results should be considered to have a preliminary value because of the limited number<br />
patients in the study and their confirmation requires further research.<br />
REFERENCES<br />
1. Poort SR, Rosendaal FR, Reitsma PH, Bertina RM. A common genetic variation in the 3’-untranslated region of the<br />
prothrombin gene is associated with elevated plasma prothrombin levels and increase in venous thrombosis. Blood,<br />
1996; 88: 3698-3703.<br />
2. Galajda P, Hulíková M, Kubisz, P. Trombofilné stavy. Medicínsky Monitor, 2000; 4: 16-20.<br />
3. Frenkel EP, Buk RL. Prothrombin G20210A gene mutation, heparin cofactor II defects, primary thrombocytemia and<br />
thrombohemorrhagic manifestation. Seminars in thrombosis and haemostasis, 1999; 25, 4: 376-385.<br />
4. Bertina RM. The prothrombin 20210 G to A variation and thrombosis. Curr-Opin-Hematol, 1998; 5 (5) : 339-342.<br />
5. Vargas M, Soto I, Pinto CR, Urgelles MF, Batalla A, Rodriguez-Reguero J, Cortina A, Alvarez V, Coto E. The prothrombin<br />
20210A allele and the factor V Leiden are associated with venous thrombosis but not with also early coronary<br />
artery disease. Blood-Coagul-Fibrinolysis, 1999; 10 (1): 39-41.<br />
6. Bertina RM. Molecular risk factors for thrombosis. Thromb Haemost, 1999; 82(2): 601-609.<br />
7. Eikelboom JW, Ivey L, Baker RT. Familial thrombophilia and the prothrombin 20210A mutation associated with increased<br />
thrombin generation and unusual thrombosis. Bloodcoagulation-fibrinolysis, 1999; 10 (1): 1-5.<br />
8. Simoni P, Tormene D, Manfrin D, Gavasso S, Luni S, Stocco D, Girolami A. Prothrombin antigen levels in symptomatic<br />
and asymptomatic carriers of the 20210A prothrombin variant. Br-J-Haematol, 1998; 103(4): 1045-1050.<br />
9. Chamouard P, Pencreach E, Maloisel F, Grunebaum L, Meyer A, Gaub MP, Goetz J, Baumann R, Uring-Lambert B,<br />
Levy S, Dufour P, Hauptmann G, Oudet P. Frequent factor II G20210A mutation in idiopathic <strong>po</strong>rtal vein thrombosis.<br />
Gastroenterology, 1999; 116: 144-148.<br />
10. Rosendaal FR, et al. Geografic distribution of the 20210 G to A prothrombin variant. Thromb Haemost, 1998; 79: 706<br />
11. Rosendaal FR. Risk factors for venous thrombotic disease. Thromb Haemost, 1999; 82 (2): 610-619.<br />
12. Souto JC, Coll I, Llobet D, del-Rio-E, Oliver A, Mateo J, Borell M, Fontcuberta J. The prothrombin 20210A allele is<br />
the most prevalent genetic risk factor for venous thrombembolism in the Spanish <strong>po</strong>pulation. Thromb Haemost,<br />
1998; 80 (3): 366-369.<br />
13. van Krimpen J, Leebeek FW, Dippel DW, Gomez Garcia E. Prothrombin gene variant (G20210A) in a patient with<br />
cerebral venous sinus thrombosis. Clin Neurol Neurosurg, 1999; 101(1): 53-55.<br />
14. Eichinger S, Minar E, Hirschl M, Bialonczyk C, Stain M, Mannhalter C, Stumpflen A, Schneider b, Lechner K, Kyrle<br />
PA. The risk of early recurrent venous thromboembolism after oral anticoagulant therapy in patient with the<br />
G20210A transition in the prothrombin gene. Thromb Haemost, 1999; 81 (1): 14-17.<br />
15. De Stephano V, Chiusolo P, Paciaroni K, Casorelli I, Rossi E, Molinari M, Servidei S, Tonali PA, Leone G. Prothrombin<br />
G20210A mutant genotype is a risk factor for cerebrovascular ischemic disease in young patients. Blood, 1998;<br />
91, 3562-3565.<br />
Received: April, 14, <strong>2003</strong><br />
Accepted: June, 5, <strong>2003</strong>
32<br />
A C T A M E D I C A M A R T I N I A N A 3 / 1<br />
CENTRAL VERSUS INTRAPARENCHYMAL ARTERIES OF KIDNEY:<br />
COMPARISON OF DOPPLER PARAMETERS UNDER THE PHYSIOLOGICAL<br />
CONDITIONS IN NEWBORNS<br />
MIROSLAV STAVùL 1 , HANA KOLLAROVSZKA 1 , ZUZANA STRECHOVÁ 1 , HUBERT POLÁâEK 2 ,<br />
MIRKO ZIBOLEN 1<br />
1<br />
Clinic of Neonatology, Comenius University, Jessenius Faculty of Medicine, Faculty Hospital, Martin, Slovak Republic<br />
2<br />
Department of Radiology, Comenius University, Jessenius Faculty of Medicine, Faculty Hospital, Martin,<br />
Slovak Republic<br />
Abstract<br />
The objective of this research was to evaluate renal blood flow in healthy newborns by means of Doppler ultrasonography.<br />
A total number of 40 newborns were examined. The blood flow in central renal arteries versus intraparenchymal<br />
arteries was compared. Maximum systolic velocity (V max), end-diastolic velocity (V ed), mean flow velocity (V mean),<br />
resistive index (RI) and pulsatility index (PI) were assessed. Values of all the named parameters evaluated in central renal<br />
arteries are significantly higher than the values of the same parameters evaluated in the intraparenchymal arteries. Measured<br />
values could be considered as physiological ones in this age group.<br />
Key words: Doppler, newborn, kidney, resistive index<br />
INTRODUCTION<br />
Renal sonographical screening at the neonatal units allows an early detection of any developmental<br />
abnormalities and acute states in the perinatal period (1). Doppler measurement methods<br />
broaden the conventional sonography and allow to evaluate not only the structure of kidneys<br />
but also renal haemodynamics. It is also <strong>po</strong>ssible to perform it even in the prenatal period<br />
(2). A detection of blood flow changes, which can precede the structural ones, permits us in some<br />
cases to establish the diagnosis before a conventional sonography or prior to the time when clinical<br />
signs become apparent. It is useful with different renal pathological states, e.g. acute tubular<br />
necrosis in perinatal asphyxia (3, 4) or for distinguishing obstructed from non-obstructed<br />
hydronephrosis (5, 7). It informs not only about the process of disease and its prognosis but also<br />
allows the start for an early treatment.<br />
The problem of renal Doppler measurements in neonatal period and infancy is a minimum of<br />
researches devoted to this area (8, 9, 10, 11). As a consequence there are no generally accepted<br />
normative values of Doppler parameters in this age group, especially in the early <strong>po</strong>stpartal period.<br />
There were healthy neonates studied in the present research. The aim of this research was<br />
to establish physiological normative values of selected Doppler parameters of renal circulation.<br />
MATERIAL AND METHODS<br />
There were 40 healthy neonates (21 girls and 19 boys) from physiological pregnancies with<br />
negative perinatal history enrolled in this study. All of them were born in term (average of 40.2<br />
± 1.1 gestational weeks). All had an appropriate weight for gestational age, following the criteria<br />
of British Child Growth Fundation (average of 3519 ± 412 g). Values of Apgar score in 5 th and<br />
10 th minute were 8 or more, there were no signs of hy<strong>po</strong>xia. The examination was performed on<br />
4 th –5 th day of their life (average of 84 ± 10 hours of life). There were no clinical signs indicating<br />
Address for corres<strong>po</strong>ndence:<br />
Miroslav Stavûl, M. D., Clinic of Neonatology, Comenius University, Jessenius Faculty of Medicine and Faculty Hospital,<br />
Kollárova 2, 036 59 Martin, Slovak Republic<br />
Phone: ++421 43 4203 641, Fax: ++ 421 43 4222 678<br />
e-mail: stavel@lefa.sk
A C T A M E D I C A M A R T I N I A N A 3 / 1 33<br />
Table 1. Comparison of Doppler parameters of central renal versus intraparenchymal arteries<br />
AR IP P value<br />
V max (cm/s) 40.8 ± 13.7 7.0 ± 1.0
34<br />
A C T A M E D I C A M A R T I N I A N A 3 / 1<br />
Figure 1. Comparison of resistive index of central renal<br />
versus intraparenchymal arteries (AR – central renal arteries,<br />
IP – intraparenchymal arteries, RI – resistive index).<br />
Figure 2. Comparison of pulsatility index of central renal<br />
versus intraparenchymal arteries (AR – central renal arteries,<br />
IP – intraparenchymal arteries, PI – pulsatility index).<br />
Analogous comparison of all listed parameters in this age group has not been published yet<br />
in available sources.<br />
Decline of RI from last trimester of pregnancy to 6 th month of life was presented by Andriani<br />
et al (11). In neonatal period they mention the values of RI between 0.57-0.90. Only renal artery<br />
was assessed. Values of RI are in concordance with our results on renal artery.<br />
Lin and Cher (9) in their research on healthy children of age between 0-13 years <strong>po</strong>inted out<br />
a continuous decline of RI along with age. Values mentioned in the age group of 0-3 months in<br />
renal arteries (RI = 0.69 ± 0.10, PI = 1.22 ± 0.30) are lower than values recognized in presented<br />
research that could be related with age inhomogeneity of their group.<br />
Evaluation of renal circulation from late foetal period until one year was the aim of the research<br />
published by Veille et al (8). They re<strong>po</strong>rted a significant increase of the renal artery diameter,<br />
time/velocity integral, peak flow velocity, mean flow velocity and absolute renal flow along<br />
with age. A decline of systolic/diastolic velocity ratio was noticed in this period. Renal blood flow<br />
related to body weight did not change significantly along with age. All measurements were performed<br />
on renal artery and on a small group (19 children).<br />
Kuzmic et al (13) compared RI of different children’s age groups in their researches. They rated<br />
RI on interlobar and arcuate arteries. They recognized significantly higher RI (0.705 ± 0.018) in<br />
the youngest age group than in the older ones (0.605 ± 0.029 and 0.0604 ± 0.035 respectively).<br />
The age groups were divided into two groups of children aged between 2-6,then 6-16 years and<br />
adults, therefore the interpretation of neonatal values according to this research is limited.<br />
Comparison of parameters on different levels of renal vascular tree was assessed by Rivolta<br />
et al (14). They performed their measurements on the renal artery, interlobar arteries and cortical<br />
arteries. They recognized significantly lower values of RI in cortical arteries in comparison<br />
with interlobar and renal arteries. Examined group were adults, however, their results concord<br />
with our results. Thesis of renal vascular resistance decline towards peripheral arteries under<br />
physiological conditions is probably applicable in all age groups.<br />
Presented research follows preliminary Zibolen’s study (6, 7), who has assessed 14 newborns<br />
aged 0-1 months. The significant difference of RI, PI, Vsyst and V ed between renal and intraparenchymal<br />
arteries is in concordance with presented up-to-date measurements, although<br />
absolute values are different. We attribute it to different age of examined babies and different file<br />
size. Limited equipment facilities in the time of their study have influenced the results too.<br />
In conclusion, we want to <strong>po</strong>int out the specificity of renal circulation in neonatal period.<br />
However, these preliminary results already indicate that physiological values of elder age groups<br />
have limited use in this period. Big variety of published results in the past is due to differences<br />
in the location of the measurement. It is desirable to establish physiological values of selected<br />
Doppler parameters in this age group.
A C T A M E D I C A M A R T I N I A N A 3 / 1 35<br />
REFERENCES<br />
1. âerveÀová O, âernianska A, Chocholová M, Mikloviãová D, Kizeková Z, Büchler P, VaÀatka R, Polák V, Wasserman<br />
O. „Rub a líc” 10 roãného skríningu ob‰trukãn˘ch uropatií. In: Benedeková et al. Klinická pediatria I. Bratislava: Univerzita<br />
Komenského; 2002. p. 29-32.<br />
2. Vi‰Àovsk˘ J. Vy‰etrenie cirkulácie v pôrodníctve. Martin: Osveta; 2002.<br />
3. Luciano R, Gallini F, Romagnoli C, Papacci P, Tortorolo G. Doppler evaluation of renal blood flow velocity as a predictive<br />
index of acute renal failure in perinatal asphyxia. Eur J Pediatr 1998; 157 (8): 656-60.<br />
4. Streitman K, Tóth A, Horváth I, Tálosi G. Renal injury in perinatal hy<strong>po</strong>xia: ultrasonography and changes in renal<br />
function. Eur J Pediatr 2001; 160 (8): 473-7.<br />
5. Svitac J, Zibolen M, Kliment J, Buchanec J. Renal Doppler ultrasonography in infants with hydronephrosis. Int Urol<br />
Nephrol 2001; 33 (3): 431-3.<br />
6. Zibolen M. Colour duplex Doppler sonographic comparison of blood flow in renal and intraparenchymal renal arteries<br />
in healthy neonates. Eur J Pediatr 1994; 153 (8): 614.<br />
7. Zibolen M. Dopplerovská sonografia obliãiek plodov, novorodencov a detí. Martin: Fli<strong>po</strong>; 2000.<br />
8. Veille JC, McNeil S, Hanson R, Smith N. Renal Hemodynamics: Longitudinal study from the late fetal life to one year<br />
of age. J Matern Fetal Investig 1998; 8 (1): 6-10.<br />
9. Lin GJ, Cher T Renal vascular resistance in normal children – a color Doppler study Pediatr Nephrol 1997; 11 (2):<br />
182-5.<br />
10. Scholbach T. Color Doppler sonographic determination of renal blood flow in healthy children. J Ultrasound Med<br />
1999; 18: 559-64.<br />
11. Andriani G, Persico A, Tursini S, Ballone E, Cirotti D, Lelli Chiesa P. The renal-resistive index from the last 3 months<br />
of pregnancy to 6 months old. BJU Int 2001; 87 (6): 562-4.<br />
12. Jurko A jr. Vybrané echokardiografické parametre novorodencov a dojãiat. Martin: Fli<strong>po</strong>; 2000.<br />
13. Kuzmic AC, Brkljacic B, Ivankovic D, Galesic K. Doppler sonographic renal resistance index in healthy children. Eur<br />
Radiol 2000; 10 (10): 1644-8.<br />
14. Rivolta R, Cardinale L, Lovaria A, Di Palo FQ. Variability of renal echo-Doppler measurements in healthy adults.<br />
J Nephrol 2000; 13 (2): 110-5.<br />
This study was sup<strong>po</strong>rted by Grant VEGA No. 1/0044/03.<br />
Received: January, 10, <strong>2003</strong><br />
Accepted: March, 20, <strong>2003</strong>