Grade
Grade
Grade

Create successful ePaper yourself
Turn your PDF publications into a flip-book with our unique Google optimized e-Paper software.
2. What does the data not tell us?<br />
We aren’t currently seeing the number of students who have AP potential<br />
We have not explored the amount of minority students (outside of ESL) in AP classes<br />
3. What are causes for celebration?<br />
We have one of the highest pass rates in JCPS<br />
4. What are the opportunities for improvement?<br />
Our number of enrollments in AP classes in general<br />
Minority recruitment into AP classes<br />
ESL recruitment<br />
The amount of students who receive free/reduced lunch enrolled in AP classes.<br />
The number of ECE students enrolled in AP classes.<br />
5. What are our next steps?<br />
Develop a plan to increase student participation in AP Courses.<br />
1. What does the data tell us?<br />
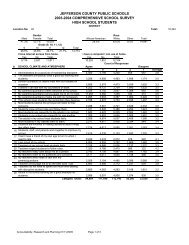
AP (October 1)<br />
Academic Performance<br />
9% of Seneca students are enrolled in AP classes<br />
Less than 1% of our ECE students are enrolled in AP classes<br />
0% of our ESL population is enrolled in AP classes<br />
6% of our free/reduced population is enrolled in AP classes<br />
Transforming School Culture<br />
11 students were suspended the first student month. 7 were AA males and 3 AA females.<br />
20 students were assigned to SOS- 8 were AA males, 6 were AA females.<br />
Data Informed Decisions<br />
Students have been placed in interventions based on both EPAS data and performance on content formative assessments.<br />
2. What does the data not tell us?<br />
Academic Performance<br />
We aren’t currently seeing the number of students who have AP potential<br />
We have not explored the amount of minority students (outside of ESL) in AP classes<br />
53