Grade
Grade
Grade
Create successful ePaper yourself
Turn your PDF publications into a flip-book with our unique Google optimized e-Paper software.
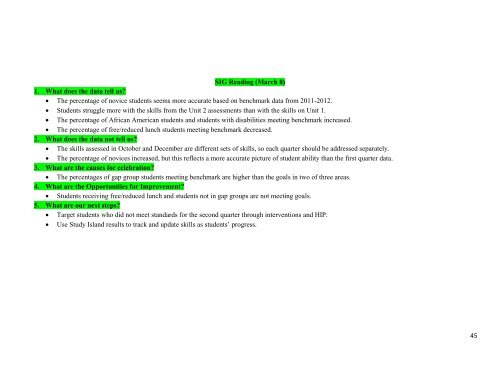
SIG Reading (March 8)<br />
1. What does the data tell us?<br />
The percentage of novice students seems more accurate based on benchmark data from 2011-2012.<br />
Students struggle more with the skills from the Unit 2 assessments than with the skills on Unit 1.<br />
The percentage of African American students and students with disabilities meeting benchmark increased.<br />
The percentage of free/reduced lunch students meeting benchmark decreased.<br />
2. What does the data not tell us?<br />
The skills assessed in October and December are different sets of skills, so each quarter should be addressed separately.<br />
The percentage of novices increased, but this reflects a more accurate picture of student ability than the first quarter data.<br />
3. What are the causes for celebration?<br />
The percentages of gap group students meeting benchmark are higher than the goals in two of three areas.<br />
4. What are the Opportunities for Improvement?<br />
Students receiving free/reduced lunch and students not in gap groups are not meeting goals.<br />
5. What are our next steps?<br />
Target students who did not meet standards for the second quarter through interventions and HIP.<br />
Use Study Island results to track and update skills as students’ progress.<br />
45


