Elementary DataBook 2001-2002 - Jefferson County Public Schools
Elementary DataBook 2001-2002 - Jefferson County Public Schools
Elementary DataBook 2001-2002 - Jefferson County Public Schools

Create successful ePaper yourself
Turn your PDF publications into a flip-book with our unique Google optimized e-Paper software.
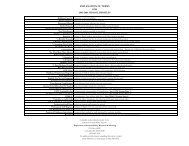
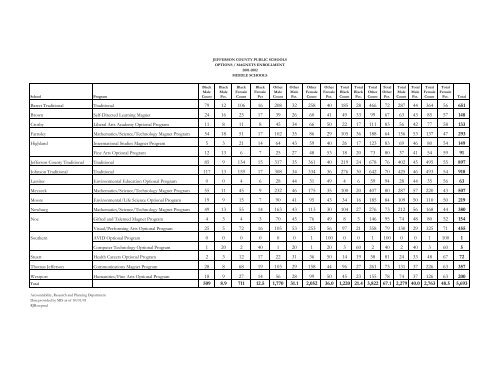
JEFFERSON COUNTY PUBLIC SCHOOLS<br />
OPTIONS / MAGNETS ENROLLMENT<br />
<strong>2001</strong>-<strong>2002</strong><br />
MIDDLE SCHOOLS<br />
School<br />
Program<br />
Black<br />
Male<br />
Count<br />
Black<br />
Male<br />
Pct.<br />
Black<br />
Female<br />
Count<br />
Barret Traditional Traditional 79 12 106 16 208 32 258 40 185 28 466 72 287 44 364 56 651<br />
Brown Self-Directed Learning Magnet 24 16 25 17 39 26 60 41 49 33 99 67 63 43 85 57 148<br />
Crosby Liberal Arts Academy Optional Program 11 8 11 8 45 34 66 50 22 17 111 83 56 42 77 58 133<br />
Farnsley Mathematics/Science/Technology Magnet Program 54 18 51 17 102 35 86 29 105 36 188 64 156 53 137 47 293<br />
Highland Intermational Studies Magnet Program 5 3 21 14 64 43 59 40 26 17 123 83 69 46 80 54 149<br />
Black<br />
Female<br />
Pct<br />
Other<br />
Male<br />
Count<br />
Fine Arts Optional Program 12 13 6 7 25 27 48 53 18 20 73 80 37 41 54 59 91<br />
<strong>Jefferson</strong> <strong>County</strong> Traditional Traditional 85 9 134 15 317 35 361 40 219 24 678 76 402 45 495 55 897<br />
Johnson Traditional Traditional 117 13 159 17 308 34 334 36 276 30 642 70 425 46 493 54 918<br />
Lassiter Environmental Education Optional Program 0 0 4 6 28 44 31 49 4 6 59 94 28 44 35 56 63<br />
Meyzeek Mathematics/Science/Technology Magnet Program 55 11 45 9 232 46 175 35 100 20 407 80 287 57 220 43 507<br />
Moore Environmental/Life Science Optional Program 19 9 15 7 90 41 95 43 34 16 185 84 109 50 110 50 219<br />
Newburg Mathematics/Science/Technology Magnet Program 49 13 55 14 163 43 113 30 104 27 276 73 212 56 168 44 380<br />
Noe Gifted and Talented Magnet Program 4 3 4 3 70 45 76 49 8 5 146 95 74 48 80 52 154<br />
Visual/Performing Arts Optional Program 25 5 72 16 105 53 253 56 97 21 358 79 130 29 325 71 455<br />
Southern AVID Optional Program 0 0 0 0 0 0 1 100 0 0 1 100 0 0 1 100 1<br />
Computer Technology Optional Program 1 20 2 40 1 20 1 20 3 60 2 40 2 40 3 60 5<br />
Stuart Health Careers Optional Program 2 3 12 17 22 31 36 50 14 19 58 81 24 33 48 67 72<br />
Thomas <strong>Jefferson</strong> Communications Magnet Program 28 8 68 19 103 29 158 44 96 27 261 73 131 37 226 63 357<br />
Westport Humanities/Fine Arts Optional Program 18 9 27 14 56 28 99 50 45 23 155 78 74 37 126 63 200<br />
Total 509 8.9 711 12.5 1,770 31.1 2,052 36.0 1,220 21.4 3,822 67.1 2,279 40.0 2,763 48.5 5,693<br />
Other<br />
Male<br />
Pct.<br />
Other<br />
Female<br />
Count<br />
Other<br />
Female<br />
Pct.<br />
Total<br />
Black<br />
Count<br />
Total<br />
Black<br />
Pct.<br />
Total<br />
Other<br />
Count<br />
Total<br />
Other<br />
Pct.<br />
Total<br />
Male<br />
Count<br />
Total<br />
Male<br />
Pct.<br />
Total<br />
Female<br />
Count<br />
Total<br />
Female<br />
Pct.<br />
Total<br />
Accountability, Research and Planning Department<br />
Data provided by MIS as of 10/01/01<br />
RJR:se:pmd