Explanation of Terms.databkxls - Jefferson County Public Schools
Explanation of Terms.databkxls - Jefferson County Public Schools
Explanation of Terms.databkxls - Jefferson County Public Schools

You also want an ePaper? Increase the reach of your titles
YUMPU automatically turns print PDFs into web optimized ePapers that Google loves.
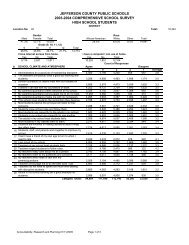
JEFFERSON COUNTY PUBLIC SCHOOLS<br />
COMPREHENSIVE TEST OF BASIC SKILLS (CTBS/5)<br />
ACHIEVEMENT GAP<br />
Mean Normal Curve Equivalent (NCE)<br />
SPRING 2002<br />
Elementary <strong>Schools</strong><br />
Reading<br />
Language Mathematics Total Battery<br />
African-<br />
African-<br />
African-<br />
African-<br />
SCHOOL<br />
White American White American White American White American<br />
Johnsontown 50.0 38.8 53.1 36.2 52.0 37.1 51.9 36.4<br />
Kennedy 65.0 56.6 64.9 58.6 59.2 54.8 65.0 57.9<br />
Kenwood 58.6 40.1 54.9 40.2 56.9 41.8 57.9 39.6<br />
Kerrick 56.1 44.8 58.7 42.5 59.1 46.4 59.0 44.4<br />
King 63.2 45.7 63.0 45.7 63.9 45.4 65.0 45.1<br />
Klondike 60.6 45.3 57.2 45.2 63.2 46.3 61.7 45.5<br />
Laukhuf 53.8 43.0 56.3 45.4 54.4 43.9 55.5 43.5<br />
Layne 52.5 43.7 52.1 40.2 54.4 37.8 53.7 40.6<br />
Lincoln 50.1 38.9 49.2 36.3 49.5 38.0 49.8 37.2<br />
Lowe 61.1 51.0 61.7 48.2 57.0 47.3 61.3 49.6<br />
Luhr 60.0 44.5 61.2 46.3 58.8 43.1 61.4 44.3<br />
Maupin 50.4 39.4 47.7 40.3 47.6 35.7 48.7 37.6<br />
McFerran 45.8 40.1 45.2 37.8 45.1 37.2 45.2 37.6<br />
Medora 64.8 50.4 68.0 56.5 65.9 47.8 68.2 51.5<br />
Mill Creek 48.3 53.2 48.6 58.0 46.1 44.6 47.8 52.3<br />
Minors Lane 40.5 36.3 39.0 34.5 39.6 34.4 39.3 33.8<br />
Norton 63.2 47.4 67.2 49.8 63.1 42.4 66.5 46.6<br />
Okolona 54.6 41.8 52.1 44.3 55.0 38.6 54.8 41.0<br />
Portland 37.6 41.8 39.2 42.2 38.6 41.2 38.1 41.2<br />
Price 54.7 50.9 48.8 47.0 51.4 49.0 52.1 49.0<br />
Rangeland 59.5 55.3 60.6 53.6 72.2 64.2 66.1 58.5<br />
Roosevelt-Perry 39.3 29.7 42.8 30.4 43.5 30.8 41.5 28.0<br />
Rutherford 48.4 41.3 48.6 39.7 49.8 39.3 48.7 39.3<br />
Sanders 50.5 37.0 49.6 39.7 48.9 35.5 49.9 36.9<br />
Schaffner Traditional 67.0 63.7 69.7 66.7 70.0 66.2 71.5 68.2<br />
Semple 43.6 37.4 44.3 36.0 42.7 38.7 42.9 36.7<br />
Shacklette 54.1 41.3 54.4 40.4 55.6 42.5 55.6 40.9<br />
Shelby 36.2 34.2 38.2 38.0 35.5 33.8 35.5 34.0<br />
Slaughter 39.6 35.9 39.3 35.5 38.4 35.5 37.9 34.9<br />
Smyrna 61.0 49.3 60.5 48.1 57.6 42.1 61.0 46.9<br />
St. Matthews 58.0 44.6 57.1 46.4 62.4 41.7 60.6 43.9<br />
Stonestreet 55.0 39.1 53.9 45.8 57.6 39.1 56.8 40.9<br />
town 68.3 40.7 65.0 42.5 62.6 40.6 67.4 41.0<br />
Trunnell 54.4 39.2 55.8 37.7 58.3 39.9 57.1 37.6<br />
Tully 61.4 44.7 64.2 41.6 61.7 38.8 64.1 41.6<br />
Watson Lane 46.8 38.8 46.7 41.6 49.5 40.1 47.6 39.6<br />
Watterson 54.8 40.9 51.5 41.2 58.0 39.8 55.4 39.8<br />
Wellington 44.5 40.1 43.8 35.9 47.6 34.3 45.0 35.9<br />
Wheatley * 40.2 * 41.3 * 40.9 * 40.4<br />
Wheeler 60.3 45.6 57.0 46.6 60.6 45.0 60.3 45.5<br />
Wilder 66.4 48.4 66.9 50.5 65.1 47.8 68.6 49.5<br />
Wilkerson 50.4 34.6 49.5 39.7 52.7 37.6 51.4 36.7<br />
Wilt 51.7 41.7 50.8 43.0 56.8 44.5 53.7 42.9<br />
Young 57.3 46.7 52.0 43.5 55.4 47.4 56.0 45.8<br />
Accountability, Research and Planning<br />
Source: Spring 2002 CTB/McGraw-Hill<br />
TerraNova Data Disaggregation report<br />
RJR:se 11/01/2002