Explanation of Terms.databkxls - Jefferson County Public Schools
Explanation of Terms.databkxls - Jefferson County Public Schools
Explanation of Terms.databkxls - Jefferson County Public Schools

Create successful ePaper yourself
Turn your PDF publications into a flip-book with our unique Google optimized e-Paper software.
<strong>Jefferson</strong> <strong>County</strong> <strong>Public</strong> <strong>Schools</strong><br />
CATS Accountability Index<br />
CATS Cycle 1 (1999 through 2002)<br />
Elementary <strong>Schools</strong><br />
<strong>Schools</strong><br />
Accountability<br />
Index 1999<br />
Accountability<br />
Index 2000<br />
Accountability<br />
Index 2001<br />
Accountability<br />
Index 2002<br />
Baseline<br />
Accountability<br />
Index 99-00<br />
Growth<br />
Accountability<br />
Index 01-02<br />
Classification<br />
Roosevelt-Perry 40.9 44.3 50.5 51.8 42.6 51.2 Meets Goal<br />
Rutherford 54.6 58.3 56.1 62.2 56.5 59.2 Progressing<br />
Saint Matthews 76.8 78.4 80.8 81.4 77.6 81.1 Meets Goal<br />
Sanders 63.4 66.2 62.2 65.5 64.8 63.9 Progressing<br />
Schaffner Traditional 79.8 84.3 88.6 92.7 82.1 90.7 Meets Goal<br />
Semple 46.1 48.0 53.4 57.5 47.1 55.5 Meets Goal<br />
Shacklette 64.1 65.2 60.5 71.9 64.7 66.2 Progressing<br />
Shelby 38.9 42.9 47.6 50.1 40.9 48.9 Meets Goal<br />
Slaughter 43.4 50.5 48.7 52.4 47.0 50.6 Progressing<br />
Smyrna 64.0 67.9 70.4 71.2 66.0 70.8 Meets Goal<br />
Stonestreet 64.1 64.6 60.1 65.4 64.4 62.8 Assistance Level 2<br />
Trunnell 51.8 48.9 57.7 67.3 50.4 62.5 Meets Goal<br />
Tully 81.6 84.1 84.9 85.8 82.9 85.4 Meets Goal<br />
Watson Lane 52.6 57.0 56.9 61.5 54.8 59.2 Progressing<br />
Watterson 69.4 69.2 71.1 70.1 69.3 70.6 Progressing<br />
Wellington 49.5 50.9 52.4 54.4 50.2 53.4 Progressing<br />
Wheatley 62.9 53.4 59.5 56.8 58.2 58.2 Progressing<br />
Wheeler 72.2 75.2 74.3 79.3 73.7 76.8 Meets Goal<br />
Whitney Young 57.1 60.4 55.9 73.5 58.8 64.7 Meets Goal<br />
Wilder 86.4 85.8 82.1 85.9 86.1 84.0 Progressing<br />
Wilkerson 48.4 52.9 54.6 57.8 50.7 56.2 Progressing<br />
Wilt 48.5 53.1 60.9 66.4 50.8 63.7 Meets Goal<br />
Zachary Taylor 71.4 75.7 76.2 70.7 73.6 73.5 Progressing<br />
Accountability Index 61.8 63.6 66.1 69.2 62.4 67.7<br />
Accountability Index:<br />
Baseline<br />
Accountability Index:<br />
Growth<br />
Accountability Index:<br />
Classification:<br />
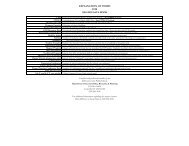
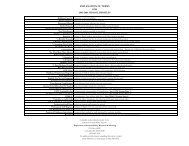
These numbers represent the actual test scores for each year achieved by the school on the new CATS test scores.<br />
Accountability index score that describes the school's average performance during the 1998-1999 and<br />
1999-2000 school years, and is the number against which progress shall be measured.<br />
The average accountability index that describes the school's performance every two (2) years beginning<br />
with the 2000-2001 and 2001-2002 school years<br />
<strong>Schools</strong> are classified into the following definitions:<br />
Meets Goal: School meets goal if the school's growth accountability index meets or exceeds its<br />
goal point and meets the dropout and novice reduction requirements.<br />
Progressing: School's growth accountability index falls below its goal point and meets or exceeds its assistance point.<br />
Assistance: School's growth accountability index falls below it assistance point.<br />
Level 1: Classification assigned to a school that has an index score that places it in the highest 1/3 <strong>of</strong> all schools below the assistance line.<br />
Level 2: Classification assigned to a school that has an index score that places it in the middle 1/3 <strong>of</strong> all schools below the assistance line.<br />
Level 3: Classification assigned to a school that has an index score that places it in the lowest 1/3 <strong>of</strong> all schools below the assistance line.<br />
Accountability, Research, Planning<br />
RJR: dlc:se<br />
September, 2002<br />
From KDE Files