Crime Rates and Youth Incarceration in Texas and ... - JDAI Helpdesk
Crime Rates and Youth Incarceration in Texas and ... - JDAI Helpdesk
Crime Rates and Youth Incarceration in Texas and ... - JDAI Helpdesk

Create successful ePaper yourself
Turn your PDF publications into a flip-book with our unique Google optimized e-Paper software.
CENTER ON JUVENILE AND CRIMINAL JUSTICE<br />
JUNE 2007<br />
www.cjcj.org<br />
<strong>Crime</strong> <strong>Rates</strong> <strong>and</strong> <strong>Youth</strong> <strong>Incarceration</strong> <strong>in</strong> <strong>Texas</strong> <strong>and</strong> California Compared:<br />
Public Safety or Public Waste?<br />
By Mike Males PhD, Christ<strong>in</strong>a Stahlkopf PhD, <strong>and</strong> Daniel Macallair MPA<br />
<strong>Texas</strong> <strong>and</strong> California, the nation’s two most populous states, are home to 22% of America’s<br />
youth. Over the last decade, these two states have taken diametrically opposite approaches to<br />
lock<strong>in</strong>g up juveniles. From 1995 to 2006, <strong>Texas</strong> <strong>in</strong>creased the number of youth that were<br />
<strong>in</strong>carcerated under the age of 18 by 48%. This was done through harsh sentenc<strong>in</strong>g practices that<br />
targeted non-violent, property <strong>and</strong> drug offenders. In contrast, dur<strong>in</strong>g the same period,<br />
California drastically reduced the total number of juveniles <strong>in</strong>carcerated <strong>in</strong> youth prisons by 75%<br />
—an unprecedented decl<strong>in</strong>e—by imprison<strong>in</strong>g only the most violent offenders (Table 1 <strong>and</strong><br />
Table 2). As a result, <strong>Texas</strong>, which has 1.8 million fewer juvenile than California, now<br />
imprisons substantially more youth than California. These two radically different practices allow<br />
for a stark analysis of a long <strong>and</strong> hotly debated issue: Do higher <strong>in</strong>carceration rates reduce crime?<br />
This paper explores this crucial question.<br />
Imprisonment Trends<br />
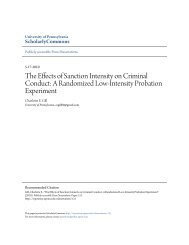
The contrast<strong>in</strong>g youth imprisonment practices <strong>in</strong> <strong>Texas</strong> <strong>and</strong> California are strik<strong>in</strong>g. Figure 1<br />
illustrates the results of the differ<strong>in</strong>g state policies with regard to juvenile <strong>in</strong>carceration between<br />
1995 <strong>and</strong> 2006. In 1995, the youth <strong>in</strong>carceration rate <strong>in</strong> California was 2.2 times higher than <strong>in</strong><br />
<strong>Texas</strong>. However, by 2006, the situation was reversed, <strong>and</strong> the Lone Star State’s juvenile<br />
<strong>in</strong>carceration rate was 2.6 times higher than <strong>in</strong> California (Table 1).<br />
These substantial changes <strong>in</strong> the youth <strong>in</strong>carceration rate call for a closer exam<strong>in</strong>ation of the<br />
correspond<strong>in</strong>g changes <strong>in</strong> the population of <strong>in</strong>carcerated youth <strong>in</strong> both states. Specifically, who<br />
goes to jail <strong>and</strong> how has this changed over the last decade?
FIGURE 1: Average Population of Incarcerated <strong>Youth</strong> per 100,000. Ages 10-17.<br />
<strong>Texas</strong> vs. California (1995-2006).<br />
300<br />
250<br />
200<br />
150<br />
100<br />
50<br />
0<br />
1995 1996 1997 1998 1999 2000 2001 2002 2003 2004 2005 2006<br />
California<br />
<strong>Texas</strong><br />
TABLE 1: <strong>Youth</strong> <strong>Incarceration</strong>, <strong>Texas</strong> vs. California (1995-2006).<br />
Average Daily Population Incarcerated<br />
Rate/100,000<br />
Total Imprisoned<br />
Population 10-17<br />
(000)<br />
Year California <strong>Texas</strong> California <strong>Texas</strong> California <strong>Texas</strong><br />
1995 263.5 118.5 9,674 2,823 3,671.7 2,381.8<br />
1996 261.2 141.4 9,772 3,467 3,741.8 2,452.5<br />
1997 226.1 182.0 8,655 4,561 3,828.3 2,505.8<br />
1998 205.2 206.7 7,991 5,267 3,894.9 2,548.3<br />
1999 190.7 213.9 7,556 5,524 3,962.0 2,582.7<br />
2000 179.7 216.5 7,303 5,646 4,065.0 2,607.9<br />
2001 160.6 207.3 6,727 5,524 4,188.1 2,665.0<br />
2002 138.5 190.8 5,954 5,170 4,299.7 2,710.2<br />
2003 114.3 176.8 5,024 4,825 4,394.2 2,728.6<br />
2004 91.4 178.1 4,067 4,883 4,450.6 2,742.3<br />
2005 74.5 179.1 3,348 4,875 4,493.4 2,721.5<br />
2006 65.7 175.7 2,962 4,800 4,505.8 2,732.5<br />
2005 v 1995 -75% +48% -69% +70%
The data reveal several notable disparities <strong>and</strong> changes. To beg<strong>in</strong> with, there are fundamental<br />
differences <strong>in</strong> the ages of the juveniles <strong>in</strong>carcerated <strong>in</strong> both states. In <strong>Texas</strong>, 18% of the youth<br />
<strong>in</strong>carcerated <strong>in</strong> state prisons are younger than 15 compared to four-tenths of 1% <strong>in</strong> California.<br />
Moreover, there are 152 juveniles younger than 18 be<strong>in</strong>g held <strong>in</strong> adult prisons <strong>in</strong> <strong>Texas</strong>, whereas<br />
there are none <strong>in</strong> California.<br />
Additionally, key proportional <strong>in</strong>equalities exist between the juvenile populations imprisoned for<br />
violent <strong>and</strong> non-violent offenses. In 2006, nearly two-thirds of young offenders imprisoned <strong>in</strong><br />
California were held for violent offenses compared to a little more than a quarter of the youth<br />
population <strong>in</strong> <strong>Texas</strong> jails. This means that <strong>Texas</strong> imprisons larger numbers of younger offenders<br />
for less serious crimes, while California <strong>in</strong>carcerates older offenders for more serious crimes.<br />
When evaluat<strong>in</strong>g current trends <strong>in</strong> both states with data from a decade ago, these patterns persist.<br />
In <strong>Texas</strong> today, the profile of <strong>in</strong>carcerated youth has evolved from violent offenders who were<br />
generally male <strong>in</strong> 1995 to young girls arrested for property or drug offenses (Table 2). In<br />
comparison, the profile of those juveniles imprisoned <strong>in</strong> California dur<strong>in</strong>g the decade studied has<br />
changed little, except for the fact that there has been a sharp decl<strong>in</strong>e <strong>in</strong> the number of youths<br />
jailed for property <strong>and</strong> drug offenses.<br />
TABLE 2: Trends <strong>in</strong> Percentages of Incarcerated Offenders.<br />
Characteristics: State 1995 2005 Change<br />
Percentage of <strong>Youth</strong> Incarcerated For:<br />
Murder<br />
Violent crime<br />
California 5.0% 4.0% -20%<br />
<strong>Texas</strong> 5.0% 1.0% -80%<br />
California 65.0% 63.8% -2%<br />
<strong>Texas</strong> 32.0% 27.0% -16%<br />
Property crime<br />
California 23.0% 18.0% -22%<br />
<strong>Texas</strong> 35.0% 39.0% +11%<br />
Drug offenses<br />
California 6.3% 3.0% -52%<br />
<strong>Texas</strong> 9.0% 11.0% +22%<br />
Percent of Wards That Are:<br />
White<br />
Lat<strong>in</strong>o<br />
Black<br />
Female<br />
California 16.4% 13.0% -21%<br />
<strong>Texas</strong> 18.0% 22.0% +22%<br />
California 47.1% 51.0% +8%<br />
<strong>Texas</strong> 42.0% 44.0% +5%<br />
California 27.4% 31.0% +13%<br />
<strong>Texas</strong> 39.0% 34.0% -13%<br />
California 4.1% 5.0% +22%<br />
<strong>Texas</strong> 7.0% 11.0% +57%
Effects on <strong>Crime</strong><br />
What has been the effect on serious youth crime of the two states’ sharply contrast<strong>in</strong>g juvenile<br />
<strong>in</strong>carceration policies? Interest<strong>in</strong>gly, the trends over the last decade <strong>in</strong> <strong>Texas</strong> <strong>and</strong> California are<br />
identical. <strong>Youth</strong> crime rates <strong>in</strong> both states began a steady <strong>and</strong> consistent decl<strong>in</strong>e beg<strong>in</strong>n<strong>in</strong>g <strong>in</strong><br />
1995 <strong>and</strong> cont<strong>in</strong>ued through 2005. <strong>Texas</strong>’ s massive <strong>in</strong>crease <strong>in</strong> youth <strong>in</strong>carceration produced no<br />
changes <strong>in</strong> youth crime rates relative to California (Figure 2 <strong>and</strong> Table 3). One can pick<br />
particular years or offenses to compare <strong>and</strong> f<strong>in</strong>d slight differences, but this exercise only<br />
multiplies the ironies. It is clear that <strong>Texas</strong>’ s policy of <strong>in</strong>carcerat<strong>in</strong>g both violent <strong>and</strong> nonviolent,<br />
juvenile offenders resulted <strong>in</strong> only slightly greater decl<strong>in</strong>es <strong>in</strong> violent crimes overall.<br />
Meanwhile, by reduc<strong>in</strong>g the proportion of nonviolent, juvenile offenders sent to jail for property<br />
<strong>and</strong> drug offenses as well as the number of imprisoned youth overall, California experienced<br />
larger decl<strong>in</strong>es <strong>in</strong> rape, burglary, robbery, car theft, <strong>and</strong> arson.<br />
FIGURE 2: Felony Index <strong>Crime</strong> Arrest per 100,000. Ages 10-17.<br />
<strong>Texas</strong> vs. California (1995-2005).<br />
3000<br />
Felony <strong>in</strong>dex crime arrests per 100,000 population age<br />
10-17, <strong>Texas</strong> v. California, 1995-2005<br />
2500<br />
2000<br />
1500<br />
1000<br />
1995 1996 1997 1998 1999 2000 2001 2002 2003 2004 2005<br />
California<br />
<strong>Texas</strong>
TABLE 3: Index <strong>Crime</strong> Trends (1995-2005).<br />
Arrest <strong>Rates</strong>/100,000 Age 10-17<br />
Arrests<br />
Year California <strong>Texas</strong> California <strong>Texas</strong><br />
1995 2,773.8 2,767.8 101,847 65,923<br />
1996 2,727.5 2,735.1 102,058 67,079<br />
1997 2,545.0 2,462.5 97,431 61,706<br />
1998 2,304.4 2,086.5 89,754 53,170<br />
1999 2,026.0 1,883.1 80,271 48,635<br />
2000 1,804.1 1,768.6 73,338 46,123<br />
2001 1,710.8 1,625.0 71,649 43,307<br />
2002 1,567.8 1,573.0 67,409 42,630<br />
2003 1,502.6 1,472.2 66,028 40,172<br />
2004 1,429.9 1,516.9 63,641 41,598<br />
2005 1,357.1 1,365.6 60,980 37,166<br />
2005 v 1995 -51% -51%<br />
Extend<strong>in</strong>g the trend further back <strong>in</strong> time does not change these f<strong>in</strong>d<strong>in</strong>gs. From 1982 to 1994,<br />
juvenile offenders were arrested at higher rates for serious felonies <strong>in</strong> California than <strong>in</strong> <strong>Texas</strong>.<br />
However, the modest <strong>in</strong>crease <strong>in</strong> California’ s youth <strong>in</strong>carceration rate that occurred dur<strong>in</strong>g this<br />
period was accompanied by only a modest decl<strong>in</strong>e <strong>in</strong> youth crime. Dur<strong>in</strong>g the same years, the<br />
<strong>in</strong>creased <strong>in</strong>carceration of juveniles <strong>in</strong> <strong>Texas</strong> was accompanied by a modest <strong>in</strong>crease <strong>in</strong> the rates<br />
of <strong>in</strong>dex offenses committed by youth. Whether exam<strong>in</strong>ed by crime, year, or historical context,<br />
then, higher <strong>in</strong>carceration rates are not associated with decl<strong>in</strong>es <strong>in</strong> juvenile crime.<br />
Conclusion<br />
The starkly different youth <strong>in</strong>carceration policies of <strong>Texas</strong> <strong>and</strong> California offer a rare opportunity<br />
to test theoretical assertions that tougher sentenc<strong>in</strong>g policies <strong>and</strong> higher <strong>in</strong>carceration reduces<br />
crime. <strong>Texas</strong>’ s youth sentenc<strong>in</strong>g policies over the past ten years emphasized <strong>in</strong>creased<br />
imprisonment for younger offenders for less serious crimes. In contrast, California <strong>in</strong>creased the<br />
overall age of young offenders committed to youth correctional facilities <strong>and</strong> diverted many<br />
juveniles who formerly would have been imprisoned. Under <strong>in</strong>capacitation theory, the<br />
significantly higher rates of youth <strong>in</strong>carceration <strong>in</strong> <strong>Texas</strong> should have produced an accelerated<br />
decrease <strong>in</strong> the crime rate relative to California. However, this study has clearly shown that no<br />
such differential effect occurred <strong>in</strong> the crime rates of the two states. This result suggests that<br />
juvenile crime control policies that emphasize <strong>in</strong>carceration <strong>and</strong> similar punitive measures need<br />
to be reconsidered, <strong>and</strong> that <strong>Texas</strong>’ s current youth <strong>in</strong>carceration policy is unjustified <strong>and</strong><br />
unnecessary. Given the recent human rights abuses occurr<strong>in</strong>g <strong>in</strong> <strong>Texas</strong> <strong>and</strong> California youth<br />
correctional facilities, crime control policies that emphasize non-<strong>in</strong>carcerative options should be<br />
given greater priority. The sav<strong>in</strong>gs achieved by reduced <strong>in</strong>carceration could be re<strong>in</strong>vested <strong>in</strong> a<br />
range of community-based <strong>in</strong>terventions.
References<br />
Bureau of the Census. State population estimates— characteristics. Wash<strong>in</strong>gton, DC: USBOC.<br />
http://www.census.gov/popest/states/asrh/<br />
Federal Bureau of Investigation (1995-2006). Uniform <strong>Crime</strong> Reports for the United States.<br />
Clarksburg, WV: US Department of Justice. http://www.fbi.gov/ucr/ucr.htm#cius<br />
Division of Juvenile Justice. DJJ Research <strong>and</strong> Statistics. Sacramento: California Department of<br />
Corrections <strong>and</strong> Rehabilitation. http://www.cdcr.ca.gov/ReportsResearch/research_tips.html<br />
Characteristics of first admissions to the California <strong>Youth</strong> Authority, 1959-2001, 1994-2005<br />
http://www.cdcr.ca.gov/ReportsResearch/docs/research/charfa_59-01.pdf<br />
A Comparison of the Division of Juvenile Justice's Institution <strong>and</strong> Parole Populations, 1997-2006,<br />
1995-2004 http://www.cdcr.ca.gov/ReportsResearch/docs/research/FY10YR2006.pdf<br />
Population Overview, 2006<br />
http://www.cdcr.ca.gov/ReportsResearch/docs/research/POPOVER2006.pdf<br />
Characteristics of Population http://www.cdcr.ca.gov/ReportsResearch/docs/research/2DEC2006-<br />
CHARACTERISTICS.pdf<br />
Ward per-capita cost 2004/05 http://www.cdcr.ca.gov/ReportsResearch/wardcost_0405.htm<br />
DJJ Facts, Stats, <strong>and</strong> Trends http://www.cdcr.ca.gov/ReportsResearch/facts.html<br />
Lundman, Richard J (2001). Prevention <strong>and</strong> Control of Juvenile Del<strong>in</strong>quency. Oxford University<br />
Press, USA.<br />
<strong>Texas</strong> <strong>Youth</strong> Commission (2006). Research <strong>and</strong> Data. Aust<strong>in</strong>, <strong>Texas</strong>: TYC.<br />
http://www.tyc.state.tx.us/research/<strong>in</strong>dex.html<br />
TYC Population Trends http://www.tyc.state.tx.us/research/growth_charts.html<br />
Commitment Profile http://www.tyc.state.tx.us/research/profile.html<br />
Average cost per day per youth http://www.tyc.state.tx.us/research/cost_per_day.html<br />
The Center on Juvenile <strong>and</strong> Crim<strong>in</strong>al Justice is a nonprofit, nonpartisan organization that offers<br />
policy analysis, program development, <strong>and</strong> technical assistance <strong>in</strong> the crim<strong>in</strong>al justice field. For<br />
more <strong>in</strong>formation, please visit www.cjcj.org or contact Peter Feng at 415-621-5661, ext. 309.