

Development of a Novel Mass Spectrometric ... - Jacobs University
Development of a Novel Mass Spectrometric ... - Jacobs University
Development of a Novel Mass Spectrometric ... - Jacobs University

You also want an ePaper? Increase the reach of your titles
YUMPU automatically turns print PDFs into web optimized ePapers that Google loves.
Results and Discussion<br />
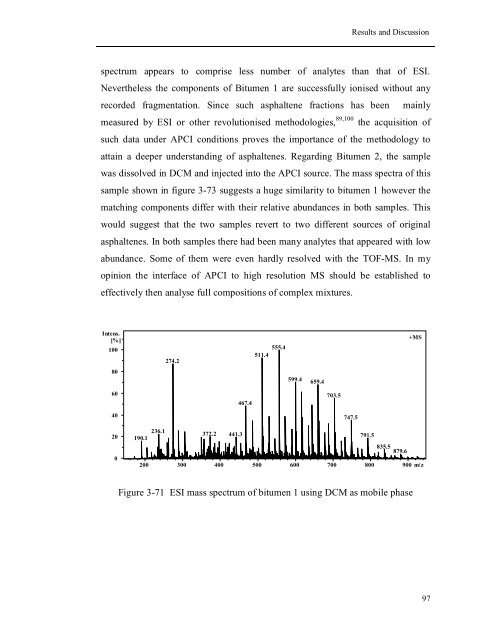
spectrum appears to comprise less number <strong>of</strong> analytes than that <strong>of</strong> ESI.<br />
Nevertheless the components <strong>of</strong> Bitumen 1 are successfully ionised without any<br />
recorded fragmentation. Since such asphaltene fractions has been mainly<br />
measured by ESI or other revolutionised methodologies, 89,100 the acquisition <strong>of</strong><br />
such data under APCI conditions proves the importance <strong>of</strong> the methodology to<br />
attain a deeper understanding <strong>of</strong> asphaltenes. Regarding Bitumen 2, the sample<br />
was dissolved in DCM and injected into the APCI source. The mass spectra <strong>of</strong> this<br />
sample shown in figure 3-73 suggests a huge similarity to bitumen 1 however the<br />
matching components differ with their relative abundances in both samples. This<br />
would suggest that the two samples revert to two different sources <strong>of</strong> original<br />
asphaltenes. In both samples there had been many analytes that appeared with low<br />
abundance. Some <strong>of</strong> them were even hardly resolved with the TOF-MS. In my<br />
opinion the interface <strong>of</strong> APCI to high resolution MS should be established to<br />
effectively then analyse full compositions <strong>of</strong> complex mixtures.<br />
Intens.<br />
[%]<br />
100<br />
80<br />
60<br />
40<br />
20<br />
0<br />
+MS<br />
555.4<br />
511.4<br />
274.2<br />
599.4 659.4<br />
703.5<br />
467.4<br />
747.5<br />
236.1<br />
372.2 441.3<br />
190.1<br />
791.5<br />
835.5 879.6<br />
200 300 400 500 600 700 800 900 m/z<br />
Figure 3-71 ESI mass spectrum <strong>of</strong> bitumen 1 using DCM as mobile phase<br />
97


