Hussain Amjed - International Union of Soil Sciences
Hussain Amjed - International Union of Soil Sciences
Hussain Amjed - International Union of Soil Sciences

Create successful ePaper yourself
Turn your PDF publications into a flip-book with our unique Google optimized e-Paper software.
etween the catch can and EM measured uniformity indices calculated for the whole plot. It also presents<br />
field scale EM data demonstrating the potential to identify irrigation system leaks.<br />
Methodology<br />
This trial used a similar agronomic methodology to that reported by <strong>Hussain</strong> and Raine (2008) for an autumn<br />
sprinkler irrigation trial <strong>of</strong> lettuce conducted on a Black Vertosol (Isbell 2002) at the Queensland Primary<br />
Industries and Fisheries Research Station, Gatton. This subsequent winter trial (August to October 2007)<br />
was also conducted on a 92 × 11 m plot cultivated into seven 1.3 m wide beds separated by 0.3 m furrows.<br />
The site was irrigated using a solid set sprinkler irrigation system consisting <strong>of</strong> ISS Rainsprays fitted with<br />
1.98 mm nozzles on 0.6 m risers and operating at 335-370 kPa. The sprinklers were arranged in a square<br />
pattern with 9 m spacings along the laterals and an 11 m lateral spacing. Four week old Iceberg (cv. Raider)<br />
lettuce was transplanted on the 8/8/07. Three in-crop irrigations were applied to establish the transplants and<br />
then three (Control, Poor-1 and Poor-2) treatment grids (9 ×11 m size) were established. The pressure at<br />
three sprinklers in the Poor-1 and the Poor-2 grids were reduced to 138 or 172 kPa using pressure reducers.<br />
The pressure <strong>of</strong> one <strong>of</strong> the 172 kPa sprinklers was reduced to 103 kPa after the fourth irrigation (18/8/07) in<br />
both Poor grids and to further reduce the uniformity worn sprinkler heads and nozzles were installed after the<br />
fifth irrigation (1/9/07). The sprinkler pressure and heads in the Control grid were not changed at any time.<br />
Irrigations were conducted in the evenings and the catch can data collected the following morning. The<br />
Christiansen (1942) Coefficient <strong>of</strong> Uniformity (CU) was used to evaluate the uniformity <strong>of</strong> the water<br />
application in each plot. The EC a measurements were taken using an EM38 (Geonics Ltd. Mississauga,<br />
Ontario) at ground level in horizontal mode for the 4 th , 5 th and 6 th irrigations. The EM meter was then<br />
mounted on a wooden stand 35 cm above the beds for measurements <strong>of</strong> the 7 th and 10 th irrigations.<br />
Results and Discussion<br />
Irrigation application and ∆ECa<br />
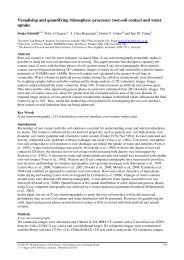
The average volume <strong>of</strong> water application varied from 6.1 to 24.8 mm whilst the difference in apparent soil<br />
electrical conductivity before and after irrigation (∆EC a ) varied from 1.0 to 19.0 mS/m during the season<br />
(data not shown). The example contour map <strong>of</strong> water application (Figure 1) shows that high water<br />
application and ∆EC a values were generally observed close to the sprinklers with low values in the middle <strong>of</strong><br />
the grid.<br />
(a)<br />
(b)<br />
8.25<br />
8.25<br />
6.75<br />
6.75<br />
Distance along lateral (m)<br />
5.25<br />
3.75<br />
Distance along lateral (m)<br />
5.25<br />
3.75<br />
2.25<br />
2.25<br />
0.75<br />
0.78 2.34 3.90 5.46 7.02 8.58 10.14<br />
Distance between laterals (m)<br />
0.75<br />
0.78 2.34 3.90 5.46 7.02 8.58 10.14<br />
Distance between laterals (m)<br />
Figure 1. Pattern <strong>of</strong> (a) water application (mm) and (b) ∆EC a (mS/m) for the Poor-2 grid (10 th irrigation).<br />
The linear correlation between the point measured volume <strong>of</strong> irrigation water applied and the ∆EC a was low<br />
before the fifth irrigation in all the grids (Table 1). The comparatively high sprinkler uniformity and<br />
relatively small volumes <strong>of</strong> water being used by the crop during this period maintained a moist soil pr<strong>of</strong>ile<br />
and produced small differences in soil moisture across the plot. The correlations between water applied and<br />
∆EC a were higher in later irrigations (i.e. after the reduction in sprinkler uniformity) reflecting the larger<br />
variation in water volume applied and increased differences in the soil moisture across the poor grids.<br />
However, there was no correlation between the volume <strong>of</strong> irrigation water applied and the ∆EC a in the<br />
Control (i.e. high irrigation uniformity) grid suggesting that EM measurements are not able to adequately<br />
identify specific spatial patterns <strong>of</strong> water application where the uniformity <strong>of</strong> application is high (e.g. CU ><br />
© 2010 19 th World Congress <strong>of</strong> <strong>Soil</strong> Science, <strong>Soil</strong> Solutions for a Changing World<br />
1 – 6 August 2010, Brisbane, Australia. Published on DVD.<br />
30