Hussain Amjed - International Union of Soil Sciences
Hussain Amjed - International Union of Soil Sciences
Hussain Amjed - International Union of Soil Sciences

Create successful ePaper yourself
Turn your PDF publications into a flip-book with our unique Google optimized e-Paper software.
Can electromagnetic induction be used to evaluate sprinkler irrigation<br />
uniformity for a shallow rooted crop?<br />
<strong>Amjed</strong> <strong>Hussain</strong> A and Steven R Raine B<br />
A Scientist Hydrology, Future Farming Systems Research Division, Department <strong>of</strong> Primary Industries, Tatura, VIC 3616, Australia.<br />
amjed.hussain@dpi.vic.gov.au<br />
B Pr<strong>of</strong>essor, National Centre for Engineering in Agriculture & CRC Irrigation Futures, University <strong>of</strong> Southern Queensland,<br />
Toowoomba, QLD 4350, Australia. Steven.Raine@usq.edu.au<br />
Abstract<br />
The application uniformity <strong>of</strong> sprinkler irrigation systems affects both crop growth and pr<strong>of</strong>itability.<br />
However, traditional catch can measurements <strong>of</strong> irrigation uniformity are labour intensive and are normally<br />
only conducted in a small area <strong>of</strong> the field. A trial was established in a lettuce crop irrigated with a solid set<br />
sprinkler system to evaluate the potential to use electromagnetic sensing for irrigation performance<br />
assessment. After crop establishment, the uniformity <strong>of</strong> the irrigation applications was deliberately modified<br />
within two sprinkler plots (9 m x 11 m) by reducing the sprinkler operating pressures. The uniformity <strong>of</strong> the<br />
water applied during each irrigation was measured using a grid <strong>of</strong> catch cans. The apparent soil electrical<br />
conductivity (EC a ) was measured within the plots for each irrigation during the cropping season using an<br />
EM38. Electromagnetic (EM) measurements were taken with the EM38 either on the ground or 35 cm<br />
above the ground surface. Elevating the EM sensor above the ground level did not improve the correlation<br />
between the point measured catch can volume <strong>of</strong> water applied and the difference in EC a measured before<br />
and after irrigation (∆EC a ). However, the coefficient <strong>of</strong> uniformity calculated using the ∆EC a data was<br />
correlated to the coefficient <strong>of</strong> uniformity calculated from the catch can data. The correlation was improved<br />
where the EM sensor was elevated above the soil surface so that only the root zone was sensed. This<br />
suggests that measurements <strong>of</strong> ∆EC a can be used to estimate the irrigation uniformity for shallow rooted<br />
crops, particularly when the uniformity is low (CU < 70%) and the irrigation application pattern is consistent<br />
throughout the season. ∆EC a measurements also identified the location <strong>of</strong> irrigation system leakages within<br />
the field.<br />
Key Words<br />
Apparent electrical conductivity, irrigation performance, leakage.<br />
Introduction<br />
The uniformity <strong>of</strong> water application is a key performance measure <strong>of</strong> an irrigation system. As the uniformity<br />
<strong>of</strong> water application decreases there is an increasing range <strong>of</strong> volumes applied within the irrigated area (Li<br />
and Rao 2003) which may adversely affect crop growth and pr<strong>of</strong>itability (Barber and Raine 2002; Elms et al.<br />
2001). Catch can measurements are commonly used to evaluate the spatial variability <strong>of</strong> water application.<br />
However, discrete physical sampling can be labour intensive restricting the number <strong>of</strong> samples collected and<br />
the ability to identify all spatial variability in the field (Plant 2001). Electromagnetic (EM) sensors have<br />
been used to measure apparent (or bulk) soil electrical conductivity (EC a ) and identify spatial variations in<br />
soil moisture (Heiniger et al. 2003; Taylor et al. 2003). However, there are few reported studies using EM<br />
sensing for evaluating irrigation uniformity, particularly where small volumes <strong>of</strong> water are applied using<br />
sprinkler irrigation systems.<br />
<strong>Hussain</strong> and Raine (2008) reported on a preliminary study using an EM sensor to evaluate the uniformity <strong>of</strong><br />
application for a sprinkler irrigated lettuce crop. EC a was found to be correlated with the seasonal pattern in<br />
water application where the uniformity <strong>of</strong> water application was low and the spatial pattern <strong>of</strong> application<br />
was consistent throughout the season. The EC a was not well correlated with the uniformity <strong>of</strong> individual<br />
application events or where the irrigation uniformity was comparatively high. However, the EM sensor in<br />
the preliminary study was placed on the soil surface resulting in the soil measurement depth being much<br />
greater than the rooting depth <strong>of</strong> the crop, possibly reducing the ability <strong>of</strong> the instrument to resolve the small<br />
volumes <strong>of</strong> water applied. Similarly, there was some uncertainty over the ability to correlate a point<br />
measured catch can volume with an EM measurement averaged over a larger spatial area. Hence, this paper<br />
reports on a subsequent field study to evaluate whether (a) elevating the EM sensor above the soil surface<br />
improves the ability to identify spatial variations in small water applications and (b) correlations exist<br />
© 2010 19 th World Congress <strong>of</strong> <strong>Soil</strong> Science, <strong>Soil</strong> Solutions for a Changing World<br />
1 – 6 August 2010, Brisbane, Australia. Published on DVD.<br />
29
etween the catch can and EM measured uniformity indices calculated for the whole plot. It also presents<br />
field scale EM data demonstrating the potential to identify irrigation system leaks.<br />
Methodology<br />
This trial used a similar agronomic methodology to that reported by <strong>Hussain</strong> and Raine (2008) for an autumn<br />
sprinkler irrigation trial <strong>of</strong> lettuce conducted on a Black Vertosol (Isbell 2002) at the Queensland Primary<br />
Industries and Fisheries Research Station, Gatton. This subsequent winter trial (August to October 2007)<br />
was also conducted on a 92 × 11 m plot cultivated into seven 1.3 m wide beds separated by 0.3 m furrows.<br />
The site was irrigated using a solid set sprinkler irrigation system consisting <strong>of</strong> ISS Rainsprays fitted with<br />
1.98 mm nozzles on 0.6 m risers and operating at 335-370 kPa. The sprinklers were arranged in a square<br />
pattern with 9 m spacings along the laterals and an 11 m lateral spacing. Four week old Iceberg (cv. Raider)<br />
lettuce was transplanted on the 8/8/07. Three in-crop irrigations were applied to establish the transplants and<br />
then three (Control, Poor-1 and Poor-2) treatment grids (9 ×11 m size) were established. The pressure at<br />
three sprinklers in the Poor-1 and the Poor-2 grids were reduced to 138 or 172 kPa using pressure reducers.<br />
The pressure <strong>of</strong> one <strong>of</strong> the 172 kPa sprinklers was reduced to 103 kPa after the fourth irrigation (18/8/07) in<br />
both Poor grids and to further reduce the uniformity worn sprinkler heads and nozzles were installed after the<br />
fifth irrigation (1/9/07). The sprinkler pressure and heads in the Control grid were not changed at any time.<br />
Irrigations were conducted in the evenings and the catch can data collected the following morning. The<br />
Christiansen (1942) Coefficient <strong>of</strong> Uniformity (CU) was used to evaluate the uniformity <strong>of</strong> the water<br />
application in each plot. The EC a measurements were taken using an EM38 (Geonics Ltd. Mississauga,<br />
Ontario) at ground level in horizontal mode for the 4 th , 5 th and 6 th irrigations. The EM meter was then<br />
mounted on a wooden stand 35 cm above the beds for measurements <strong>of</strong> the 7 th and 10 th irrigations.<br />
Results and Discussion<br />
Irrigation application and ∆ECa<br />
The average volume <strong>of</strong> water application varied from 6.1 to 24.8 mm whilst the difference in apparent soil<br />
electrical conductivity before and after irrigation (∆EC a ) varied from 1.0 to 19.0 mS/m during the season<br />
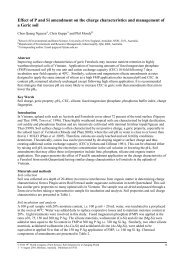
(data not shown). The example contour map <strong>of</strong> water application (Figure 1) shows that high water<br />
application and ∆EC a values were generally observed close to the sprinklers with low values in the middle <strong>of</strong><br />
the grid.<br />
(a)<br />
(b)<br />
8.25<br />
8.25<br />
6.75<br />
6.75<br />
Distance along lateral (m)<br />
5.25<br />
3.75<br />
Distance along lateral (m)<br />
5.25<br />
3.75<br />
2.25<br />
2.25<br />
0.75<br />
0.78 2.34 3.90 5.46 7.02 8.58 10.14<br />
Distance between laterals (m)<br />
0.75<br />
0.78 2.34 3.90 5.46 7.02 8.58 10.14<br />
Distance between laterals (m)<br />
Figure 1. Pattern <strong>of</strong> (a) water application (mm) and (b) ∆EC a (mS/m) for the Poor-2 grid (10 th irrigation).<br />
The linear correlation between the point measured volume <strong>of</strong> irrigation water applied and the ∆EC a was low<br />
before the fifth irrigation in all the grids (Table 1). The comparatively high sprinkler uniformity and<br />
relatively small volumes <strong>of</strong> water being used by the crop during this period maintained a moist soil pr<strong>of</strong>ile<br />
and produced small differences in soil moisture across the plot. The correlations between water applied and<br />
∆EC a were higher in later irrigations (i.e. after the reduction in sprinkler uniformity) reflecting the larger<br />
variation in water volume applied and increased differences in the soil moisture across the poor grids.<br />
However, there was no correlation between the volume <strong>of</strong> irrigation water applied and the ∆EC a in the<br />
Control (i.e. high irrigation uniformity) grid suggesting that EM measurements are not able to adequately<br />
identify specific spatial patterns <strong>of</strong> water application where the uniformity <strong>of</strong> application is high (e.g. CU ><br />
© 2010 19 th World Congress <strong>of</strong> <strong>Soil</strong> Science, <strong>Soil</strong> Solutions for a Changing World<br />
1 – 6 August 2010, Brisbane, Australia. Published on DVD.<br />
30
70%). Raising the EM sensor above the ground level (7 th and 10 th irrigations) did not increase the correlation<br />
between the catch can and ECa measurements (Table 1).<br />
Table 1. Selected irrigation performance data and correlation between water application and ∆EC a<br />
No. <strong>of</strong><br />
irrigation<br />
after<br />
transplant<br />
Average volume <strong>of</strong><br />
water applied<br />
(mm)<br />
Poor-1<br />
grid<br />
Poor-2<br />
grid<br />
Control<br />
grid<br />
Coefficient <strong>of</strong> uniformity<br />
(CU) calculated from catch can<br />
data (%)<br />
Poor-1<br />
grid<br />
Poor-2<br />
grid<br />
Control<br />
grid<br />
Linear correlations between<br />
point measured depth <strong>of</strong> water<br />
applied and ∆EC a (R 2 )<br />
Poor- 1<br />
grid<br />
Poor-2<br />
grid<br />
4 a 13.9 14.7 19.2 75.4 82.6 84.9 0.00 0.03 0.09<br />
5 a 12.1 11.2 16.9 80.0 72.0 84.6 0.31 0.62 0.39<br />
6 a 13.4 13.2 19.2 48.1 63.7 82.8 0.51 0.40 0.16<br />
7 b 15.4 14.9 23.9 65.1 58.3 88.0 0.27 0.23 0.02<br />
10 b 13.6 12.9 21.5 62.0 46.1 87.3 0.21 0.56 0.04<br />
a = EM on the ground, b = EM elevated above the ground<br />
Control<br />
grid<br />
Relationships between CU calculated by catch can and ∆EC a<br />
The coefficient <strong>of</strong> uniformity (CU) calculated using the catch can measurements for each whole plot was<br />
reasonably well correlated (R 2 ~ 0.6) with the CU calculated using the ∆EC a measurements for both trials<br />
(Figure 2a). However, the correlation was substantially improved (R 2 = 0.93) when the EC a measurements<br />
were taken 0.35 m above the ground surface compared to the on-ground measurements (Figure 2b). This<br />
suggests that variations in ∆EC a observed when the EM sensor is elevated may better reflect the change in<br />
root zone soil moisture with small water applications than on-ground EM measurements.<br />
100<br />
(a)<br />
100<br />
(b)<br />
Measured CU (%) <strong>of</strong> ∆ECa<br />
90<br />
80<br />
70<br />
60<br />
50<br />
40<br />
y = 0.6448x + 30.332<br />
R 2 = 0.60<br />
c<br />
y = 0.4203x + 41.541<br />
R 2 = 0.57<br />
Autumn trial<br />
Winter trial<br />
Measured CU (%) <strong>of</strong> ∆ECa<br />
90<br />
80<br />
70<br />
60<br />
50<br />
40<br />
y = 0.4787x + 41.43<br />
R 2 = 0.43<br />
y = 0.4187x + 38.781<br />
R 2 = 0.93<br />
EM on-ground<br />
EM elevated<br />
40 50 60 70 80 90 100<br />
Measured CU (%) <strong>of</strong> water<br />
40 50 60 70 80 90 100<br />
Measured CU (%) <strong>of</strong> water<br />
Figure 2. Linear correlations <strong>of</strong> CU calculated from catch can measurements and ∆EC a (mS/m) for (a) autumn<br />
and winter trial and (b) on-ground and elevated EM measurements.<br />
Utility <strong>of</strong> whole field ∆EC a measurements to identify system leaks<br />
EC a measurements were generally higher after each irrigation (i.e. due to higher soil-water content) and<br />
when the EM sensor was placed on the ground rather than elevated (i.e. due to a larger sensed soil volume).<br />
Some variations in EC a were also observed associated with proximity to metallic irrigation infrastructure.<br />
However, where ∆EC a was mapped for the whole field (e.g. Figure 3) significant differences in ∆EC a were<br />
found in areas which were not associated with the non-uniformity in sprinkler applications. For example,<br />
higher ∆EC a values were observed at several in-field locations (e.g. 0 × 10.14, 78 × 10.14 and 82 × 10.14 m)<br />
for the 4 th irrigation (Figure 3a) and at the top (i.e. 0 m) <strong>of</strong> the field for the 10 th irrigation (Figure 3b). In<br />
these cases, the elevated ∆EC a readings reflect leakage from the irrigation pipe system and suggest that ∆EC a<br />
could be used to identify gross irrigation system problems.<br />
Conclusions<br />
Correlations between the point measured water applied and the ∆EC a measurements were low, particularly<br />
early in the season when crop water use was small and the uniformity <strong>of</strong> the irrigation relatively high.<br />
Elevating the EM sensor above the ground level did not improve the correlation between the point measured<br />
catch can volume <strong>of</strong> water applied and the ∆EC a . However, the coefficient <strong>of</strong> uniformity calculated using the<br />
© 2010 19 th World Congress <strong>of</strong> <strong>Soil</strong> Science, <strong>Soil</strong> Solutions for a Changing World<br />
1 – 6 August 2010, Brisbane, Australia. Published on DVD.<br />
31
∆EC a data was correlated to the coefficient <strong>of</strong> uniformity calculated from the catch can data. The correlation<br />
was improved where the EM sensor was elevated above the soil surface so that only the root zone was<br />
sensed. This suggests that measurements <strong>of</strong> ∆EC a can be used to estimate the irrigation uniformity,<br />
particularly when the uniformity is low (CU < 70%) and the irrigation application pattern is consistent<br />
throughout the season. EM measurements also appear useful for identifying irrigation system leakages<br />
within the field.<br />
Distance between laterals (m)<br />
10.14 5.46 0.78<br />
0 10 20 30 40 50 60 70 80 90<br />
Distance along lateral (m)<br />
Distance between laterals (m)<br />
10.14 5.46 0.78<br />
0 10 20 30 40 50 60 70 80 90<br />
Distance along lateral (m)<br />
Figure 3. Whole field ∆EC a (a) for the 4 th (on-ground) and (b) 10 th (elevated) irrigation measurements.<br />
References<br />
Barber SA, Raine SR (2002) Using commercial distribution uniformity and yield data to improve irrigation<br />
management. <strong>International</strong> Water and Irrigation 22, 17-22.<br />
Christiansen JE (1942) Hydraulics <strong>of</strong> sprinkling systems for irrigation. Transactions <strong>of</strong> American Society <strong>of</strong><br />
Civil Engineering 107, 221-239.<br />
Elms MK, Green CJ, Johnson PN (2001) Variability <strong>of</strong> cotton yield and quality. Communications in <strong>Soil</strong><br />
Science and Plant Analysis 32, 351-68.<br />
Heiniger RW, McBride RG, Clay DE (2003) Using soil electrical conductivity to improve nutrient<br />
management. Agronomy Journal 95, 508-19.<br />
<strong>Hussain</strong> A, Raine SR (2008) A preliminary evaluation <strong>of</strong> the potential to use electromagnetic induction to<br />
assess sprinkler irrigation performance in horticultural crops. In ‘proceedings <strong>of</strong> the Ist Global Workshop<br />
on High Resolution Digital <strong>Soil</strong> Sensing and Mapping’. University <strong>of</strong> Sydney, 5-8 February 2008.<br />
Isbell R (2002) ‘The Australian soil classification.’ (CSIRO Publishing: Collingwood, Vic.)<br />
Li J, Rao M (2003) Field evaluation <strong>of</strong> crop yield as affected by nonuniformity <strong>of</strong> sprinkler-applied water<br />
and fertilizers. Agricultural Water Management 59, 1-13.<br />
Plant RE (2001) Site-specific management: the application <strong>of</strong> information technology to crop production.<br />
Computers and Electronics in Agriculture 30, 9-29.<br />
Taylor JC, Wood GA, Earl R, Godwin, RJ (2003) <strong>Soil</strong> factors and their influence on within-field crop<br />
variability, part II: spatial analysis and determination <strong>of</strong> management zones. Biosystems Engineering 84,<br />
441-53.<br />
© 2010 19 th World Congress <strong>of</strong> <strong>Soil</strong> Science, <strong>Soil</strong> Solutions for a Changing World<br />
1 – 6 August 2010, Brisbane, Australia. Published on DVD.<br />
32