Comparative analysis of fecal fat quantitation via nuclear magnetic ...
Comparative analysis of fecal fat quantitation via nuclear magnetic ...
Comparative analysis of fecal fat quantitation via nuclear magnetic ...

You also want an ePaper? Increase the reach of your titles
YUMPU automatically turns print PDFs into web optimized ePapers that Google loves.
<strong>Comparative</strong> <strong>analysis</strong> <strong>of</strong> <strong>fecal</strong> <strong>fat</strong> <strong>quantitation</strong> <strong>via</strong> <strong>nuclear</strong> <strong>magnetic</strong> resonance<br />
spectroscopy ( 1 H NMR) and gravimetry<br />
Nichole L. Korpi-Steiner 1 , Jennie N. Ward 1 , Vivek Kumar, Joseph P. McConnell ⁎<br />
Department <strong>of</strong> Laboratory Medicine and Pathology, Mayo Clinic, 200 1st Street S.W., Rochester, MN 55905, United States<br />
article info<br />
Article history:<br />
Received 20 June 2008<br />
Received in revised form 1 October 2008<br />
Accepted 2 October 2008<br />
Available online 17 October 2008<br />
Keywords:<br />
Fecal <strong>fat</strong><br />
Lipid<br />
Feces<br />
Nuclear <strong>magnetic</strong> resonance<br />
Gravimetry<br />
1. Introduction<br />
abstract<br />
Malabsorption <strong>of</strong> <strong>fat</strong>s/lipids may be a result <strong>of</strong> atrophy from<br />
malnutrition, or secondary to various pancreatic and intestinal<br />
diseases. Accordingly, <strong>fecal</strong> <strong>fat</strong> <strong>quantitation</strong> is important in diagnosing<br />
steatorrhea as well as monitoring the efficacy <strong>of</strong> treatments. To date,<br />
the classic van de Kamer extraction <strong>of</strong> lipids coupled with gravimetric<br />
or titrimetric methods is typically used to quantitatively measure total<br />
<strong>fecal</strong> <strong>fat</strong> in stool samples; however, these methods are laborious, timeconsuming<br />
(N4 h), and potentially dangerous with the handling <strong>of</strong><br />
toxic solvents during lipid extraction [1,2]. Several authors have<br />
proposed the use <strong>of</strong> infrared spectroscopy as an alternative method to<br />
measure <strong>fecal</strong> <strong>fat</strong>; however, the accuracy <strong>of</strong> <strong>fecal</strong> <strong>fat</strong> <strong>quantitation</strong> by<br />
this method still requires stool homogenization and/or lipid extraction<br />
prior to <strong>analysis</strong> and is unsuitable for quantitating <strong>fecal</strong> <strong>fat</strong> in stool<br />
samples containing N75% water content (e.g. diarrhea stool samples)<br />
[3–6]. Taken together, a reliable, more efficient and safer method to<br />
quantitate <strong>fecal</strong> <strong>fat</strong> is needed.<br />
⁎ Corresponding author. Tel.: +1 507 284 0524; fax: +1 507 266 2888.<br />
E-mail address: mcconnell.joseph@mayo.edu (J.P. McConnell).<br />
1 Authors contributed equally to the contents <strong>of</strong> the manuscript.<br />
0009-8981/$ – see front matter © 2008 Elsevier B.V. All rights reserved.<br />
doi:10.1016/j.cca.2008.10.001<br />
Clinica Chimica Acta 400 (2009) 33–36<br />
Contents lists available at ScienceDirect<br />
Clinica Chimica Acta<br />
journal homepage: www.elsevier.com/locate/clinchim<br />
Background: Fecal-<strong>fat</strong> is typically measured by extracting lipid from homogenized feces with subsequent<br />
gravimetric/titrimetric analyses that are time-consuming and involve toxic solvents. Accordingly, an efficient<br />
and more safe method to quantitate <strong>fecal</strong>-<strong>fat</strong> is needed. The present objective was to adapt CEM SmartTrac ®<br />
technology (i.e. 1 H NMR) to rapidly (b5 min) quantitate <strong>fecal</strong>-<strong>fat</strong> and compare 1 H NMR and gravimetric<br />
performance characteristics.<br />
Methods: 1 H NMR and gravimetric measurements <strong>of</strong> stool-<strong>fat</strong> were conducted using excess stool samples<br />
(72 h collection; n=107) homogenized to semi-liquid consistency prior to analyses.<br />
Results: The 1 H NMR method demonstrated acceptable linearity (R 2 =0.9999) and recovery (mean =105%)<br />
with imprecision (intra-assay CV =1.2–6.5%; inter-assay CV =1.8–5.8%) comparable to or better than<br />
gravimetry (intra-assay CV=1.0–17.2%; inter-assay CV =3.8–6.5%). Excellent correlation between <strong>fecal</strong>-<strong>fat</strong><br />
<strong>quantitation</strong> by 1 H NMR and gravimetry (n=107; R 2 =0.983; y =1.0173x−0.6859) was exhibited; moreover, 1 H<br />
NMR demonstrated good sensitivity (92.3%), specificity (94.5%), negative-predictive value (92.9%) and<br />
positive-predictive value (94.1%) for malabsorption using the reference cut-<strong>of</strong>f <strong>of</strong> ≤7 g <strong>fat</strong>/24 h.<br />
Conclusions: These data demonstrate that 1 H NMR permits rapid and safe <strong>quantitation</strong> <strong>of</strong> <strong>fecal</strong>-<strong>fat</strong> while<br />
maintaining acceptable performance characteristics, thereby supporting the utility <strong>of</strong> 1 H NMR as an<br />
alternative method to gravimetry for <strong>fecal</strong>-<strong>fat</strong> <strong>quantitation</strong>.<br />
© 2008 Elsevier B.V. All rights reserved.<br />
Hydrogen <strong>nuclear</strong> <strong>magnetic</strong> resonance spectroscopy ( 1 H NMR) is a<br />
standard technique in food industry for quantitating <strong>fat</strong>/lipid content<br />
in raw products [7–9]. Similarly, studies have used analogous 1 H NMR<br />
or 13 C NMR procedures to quantitate <strong>fat</strong> content in stool samples but<br />
required freeze-drying <strong>of</strong> the samples prior to <strong>analysis</strong> [10–13]. More<br />
recently, the CEM SmartTrac ® System (Matthews, NC) was developed<br />
which combines microwave drying technology with 1 H NMR for fast<br />
(b5 min) and accurate measurement <strong>of</strong> <strong>fat</strong> and moisture in food<br />
products. In the present study, we proposed to adapt the CEM<br />
SmartTrac ® system to quantitate <strong>fat</strong> content in stool thereby<br />
eliminating the preparation step <strong>of</strong> freeze-drying stool samples that<br />
was previously required in 1 H NMR measurement <strong>of</strong> <strong>fecal</strong> <strong>fat</strong> [10–13].<br />
Accordingly, the aim <strong>of</strong> this study was to determine whether 1 H NMR<br />
using the CEM SmartTrac ® System produces quantitative <strong>fecal</strong> <strong>fat</strong><br />
results comparable to the reference method using gravimetric<br />
measurements, which would support the utility <strong>of</strong> 1 H NMR <strong>analysis</strong><br />
<strong>of</strong> stool <strong>fat</strong> in diagnostic laboratories and future clinical studies.<br />
2. Materials and methods<br />
2.1. Stool sample collection and preparation<br />
Comparison <strong>of</strong> the 1 H NMR and gravimetry analyses <strong>of</strong> stool <strong>fat</strong> was conducted<br />
using excess stool samples (n=107) sent for <strong>fecal</strong> <strong>fat</strong> <strong>analysis</strong> by gravimetry, wherein the
34 N.L. Korpi-Steiner et al. / Clinica Chimica Acta 400 (2009) 33–36<br />
patients' clinical information was not available. The stool samples were collected over a<br />
72 h duration from 107 different individuals. Following collection the stool samples<br />
were homogenized to a semi-liquid consistency prior to <strong>fecal</strong> <strong>fat</strong> <strong>analysis</strong>. If necessary, a<br />
recorded volume <strong>of</strong> water was added to the stool sample to allow for complete<br />
homogenization.<br />
2.2. 1 H NMR <strong>fecal</strong> <strong>fat</strong> measurement<br />
The CEM SmartTrac ® System (Matthews, NC) combines microwave drying with<br />
<strong>nuclear</strong> <strong>magnetic</strong> resonance ( 1 H NMR) to determine the <strong>fat</strong> content <strong>of</strong> samples. The<br />
method has been previously described using sample types other than stool [14,15].<br />
Approximately 2.5 g <strong>of</strong> the well-homogenized stool sample was applied uniformly to an<br />
absorbent sample pad and weighed on the instrument balance pan. A second sample<br />
pad was placed over the sample at which point the sample was microwave-dried to<br />
remove the protons present due to moisture. The microwave contains infrared sensors<br />
that allow the maintenance <strong>of</strong> a steady temperature (b110 °C) without burning the<br />
sample and minimizing loss <strong>of</strong> the more volatile <strong>fat</strong>s (free <strong>fat</strong>ty acids) in the sample. The<br />
microwave time was determined by drying <strong>of</strong> a sample until a constant weight was<br />
achieved which prompted automatic cessation <strong>of</strong> drying (typically 2–4 min/sample).<br />
The sample was then wrapped in CEM Trac film, inserted into the CEM Trac tube, and<br />
analyzed <strong>via</strong> the 1 H NMR. The 1 H NMR pulses the sample with radio-frequency energy<br />
causing any remaining hydrogen protons to generate a signal (free-induction decay)<br />
that is detected and analyzed by the CEM SmartTrac ® System s<strong>of</strong>tware [14,15]. Freeinduction<br />
decay <strong>of</strong> lipid protons occurs at a slower rate than that <strong>of</strong> protons from other<br />
substances in the stool, such as proteins and carbohydrates which permits determination<br />
<strong>of</strong> the percent <strong>fat</strong> in the weighed sample. The total <strong>analysis</strong> time after initial<br />
homogenization <strong>of</strong> stool was ~5.0 min per sample. The final results were expressed as %<br />
moisture, % solid and % <strong>fat</strong> <strong>of</strong> the aliquot analyzed. Finally, based upon the total weight<br />
<strong>of</strong> the homogenized stool specimen collected over 72 h, % <strong>fat</strong> was then converted to<br />
grams <strong>fat</strong>/24 h.<br />
2.3. 1 H NMR calibration and quality control<br />
The CEM SmartTrac ® System balance was calibrated daily using certified 10.0 and<br />
2.0 gram weights. Additionally, the CEM SmartTrac ® system 1 H NMR magnet frequency<br />
and pulse width were adjusted daily and weekly, respectively, using the manufacturer's<br />
supplied oil standard. Two control samples with known values were analyzed daily to<br />
verify assay performance. Bi-yearly calibration <strong>of</strong> the 1 H NMR was performed using<br />
pooled <strong>fecal</strong> samples with known <strong>fat</strong> concentration as determined by the gravimetric<br />
method (see below).<br />
2.4. Gravimetric <strong>fecal</strong> <strong>fat</strong> measurement<br />
Gravimetric measurement <strong>of</strong> <strong>fecal</strong> <strong>fat</strong> was performed. Fat from the <strong>fecal</strong> samples<br />
was extracted as previously described [1,2] and the extract was evaporated to dryness<br />
and weighed. Ten grams <strong>of</strong> weighed, well-emulsified stool sample was saponified in<br />
10 ml KOH (6.2 M) and 40 ml alcohol mixture (0.4% isoamyl alcohol and 95% ethanol) for<br />
30 min with boiling and reflux to convert the esterified lipids to a potassium salt <strong>of</strong> a<br />
<strong>fat</strong>ty acid. The sample was then acidified with 17 ml <strong>of</strong> 8.2 mol/l HCl to decrease the<br />
ionization <strong>of</strong> <strong>fat</strong>ty acids. The total <strong>fecal</strong> lipids were extracted with 50 ml petroleum<br />
ether wherein the petroleum ether and the acid ethanol layers separated quickly (5–<br />
10 min). Following separation, 25 ml <strong>of</strong> the petroleum ether layer was transferred to a<br />
pre-weighed beaker and allowed to evaporate on a steam bath. The beaker was then<br />
dried at 110±5 °C in an oven for 30 min and the residue was weighed gravimetrically.<br />
2.5. Gravimetric <strong>fecal</strong> <strong>fat</strong> quality control<br />
The gravimetric balance was calibrated daily using certified 1.0, 10.0 and 50.0 g<br />
weights. Two control samples with known values were analyzed daily to verify<br />
acceptable assay performance.<br />
2.6. Statistical <strong>analysis</strong><br />
The robustness <strong>of</strong> both assays was analyzed by calculating intra- and inter-assay<br />
precision, and agreement <strong>of</strong> the 1 H NMR method with the gravimetric method was<br />
assessed by performing linear regression <strong>analysis</strong> using Micros<strong>of</strong>t Excel s<strong>of</strong>tware<br />
(Micros<strong>of</strong>t, Redmond, WA). The quantified <strong>fecal</strong> <strong>fat</strong> results determined by both methods<br />
were analyzed using Bland–Altman <strong>analysis</strong>.<br />
3. Results<br />
3.1. Linearity and recovery<br />
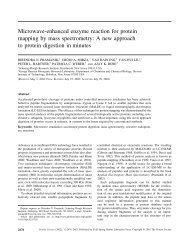
To assess linearity <strong>of</strong> <strong>fecal</strong> <strong>fat</strong> <strong>quantitation</strong> by the 1 H NMR method,<br />
% <strong>fat</strong> was quantitated in serial-dilutions <strong>of</strong> 6 stool samples containing<br />
varying percentages <strong>of</strong> <strong>fat</strong>. Linear regression <strong>analysis</strong> indicates that<br />
<strong>fecal</strong> <strong>fat</strong> values (% <strong>fat</strong>) quantitated by 1 H NMR correlate well with the<br />
expected values, within the range <strong>of</strong> 0.1–21.0% <strong>fat</strong> producing a mean<br />
Fig. 1. Linearity <strong>of</strong> % <strong>fat</strong> in 6 serially diluted samples with varying <strong>fat</strong> concentrations<br />
analyzed by 1 H NMR. Mean linear-regression <strong>analysis</strong> <strong>of</strong> measured versus expected<br />
values, within the range <strong>of</strong> 0.1–21.0% <strong>fat</strong> is y=1.0009x+0.0004; (R 2 = 0.9999).<br />
linear regression equation <strong>of</strong> y=1.0009x+0.0004, (R 2 =0.9999) as<br />
shown in Fig. 1. This range <strong>of</strong> % <strong>fat</strong> comprises N99% <strong>of</strong> samples received<br />
in the laboratory for clinical testing. The percent recovery <strong>of</strong> <strong>fecal</strong> <strong>fat</strong><br />
quantitated by the 1 H NMR was conducted using fresh-homogenized<br />
stool samples containing low (1.2–4.3% <strong>fat</strong>) or high (10.5–14.2% <strong>fat</strong>)<br />
lipid content as determined by 1 H NMR. Combinations <strong>of</strong> low and high<br />
lipid containing homogenized stool samples (25% low:75% high, 50%<br />
low:50% high and 75% low:25% high) were quantitated for lipid<br />
content by the 1 H NMR method and results were compared to the<br />
expected % lipid content to determine % recovery (n=3 combination<br />
sets or n=9). Expected lipid content ranged from 3.5–14.4% and data<br />
indicate a recovery range <strong>of</strong> 93–112% with a mean recovery <strong>of</strong> 105%<br />
(n=3 combination sets or n=9).<br />
3.2. Imprecision<br />
Imprecision results for <strong>fecal</strong> <strong>fat</strong> <strong>quantitation</strong> by the 1 H NMR and<br />
gravimetric methods are summarized in Table 1. Analysis <strong>of</strong> 1 H NMR<br />
and gravimetric intra-assay and inter-assay imprecision was conducted<br />
on the results obtained from different stool samples with<br />
varying levels <strong>of</strong> <strong>fecal</strong> <strong>fat</strong> (1.17–18.3 g <strong>fat</strong>/24 h). The CVs for 1 H NMR<br />
intra-assay (1.2–6.5%) and inter-assay (1.8–5.8%) imprecision are<br />
similar to, or better than imprecision results using the gravimetric<br />
method (intra-assay CV=1.0–17.2%; inter-assay CV=3.8–6.5%).<br />
3.3. Method comparison<br />
The method comparison results are presented in Fig. 2, that<br />
illustrate a strong positive correlation between <strong>fecal</strong> <strong>fat</strong> <strong>quantitation</strong><br />
by the 1 H NMR method and the well-established gravimetric method<br />
(R 2 =0.98; y=1.0173x−0.6859; n=107; Fig. 2A). The quantified <strong>fecal</strong> <strong>fat</strong><br />
values ranged from 1.0–150.4 g 1<strong>fat</strong>/24 h by 1 H NMR and 0.3–130.6 g<br />
<strong>fat</strong>/24 h by gravimetry with a mean value <strong>of</strong> 18.5 g <strong>fat</strong>/24 h and 18.9 g<br />
<strong>fat</strong>/24 h, respectively. Moreover, 1 H NMR and gravimetric <strong>analysis</strong> <strong>of</strong><br />
the stool samples produced median values <strong>of</strong> 7.0 and 6.6 g <strong>fat</strong>/24 h,<br />
respectively. A comparison <strong>of</strong> the percent <strong>of</strong> <strong>fat</strong> in the aliquot <strong>of</strong><br />
homogenate measured by each method in these 107 samples was also<br />
performed (R 2 =0.95; y=0.9887x−0.0661). Percent <strong>fat</strong> values ranged<br />
from 0.14 to 21.0%. As shown in Fig. 2B, comparison <strong>of</strong> <strong>fecal</strong> <strong>fat</strong><br />
measurements by 1 H NMR and gravimetric <strong>analysis</strong> near the reference<br />
cut-<strong>of</strong>f value <strong>of</strong> ≤7 g <strong>fat</strong>/24 h (n=68 <strong>of</strong> 107 samples measured <strong>fecal</strong> <strong>fat</strong><br />
content b12 g <strong>fat</strong>/24 h and were included in Fig. 2B) indicates 3 falsepositive<br />
and 4 false-negative results for malabsorption detected by 1 H<br />
NMR compared to the reference gravimetric method. Therefore, when<br />
compared to the gravimetric method, 1 H NMR measurement <strong>of</strong> <strong>fecal</strong>
Table 1<br />
Impression <strong>of</strong> <strong>fecal</strong> <strong>fat</strong> assays by gravimetric and 1 H NMR methods<br />
Gravimetric<br />
1<br />
H NMR<br />
Intra-assay Inter-assay Intra-assay Inter-assay<br />
Sample: A B C D E F G H 1 2 3 4 5 6 7 8<br />
Mean a (g/24 h) 1.17 2.55 4.21 13.9 17.9 1.2 2.7 4.3 1.2 2.6 4.3 14.2 18.3 1.2 2.6 4.4<br />
SD b<br />
0.20 0.06 0.08 1.73 0.18 0.05 0.17 0.16 0.08 0.04 0.05 0.25 0.30 0.04 0.05 0.25<br />
CV c (%) 17.2 2.5 1.8 12.4 1.0 4.1 6.5 3.8 6.5 1.5 1.2 1.7 1.7 3.2 1.8 5.8<br />
a<br />
Mean value <strong>of</strong> 5 determinations for intra-assay imprecision and 3 determinations over 1.5 years for inter-assay imprecision.<br />
b<br />
SD is the standard de<strong>via</strong>tion.<br />
c<br />
CV is the coefficient <strong>of</strong> variance.<br />
<strong>fat</strong> has a sensitivity <strong>of</strong> 92.3%, specificity <strong>of</strong> 94.5%, negative-predictive<br />
value <strong>of</strong> 94.1% and positive-predictive value <strong>of</strong> 92.9% for malabsorption<br />
using the reference cut-<strong>of</strong>f value (≤7 g <strong>fat</strong>/24 h) previously<br />
established by the gravimetric method [16]. A Bland–Altman <strong>analysis</strong><br />
<strong>of</strong> the method comparison data for <strong>fecal</strong> <strong>fat</strong> measurement by 1 H NMR<br />
and gravimetry is shown in Fig. 3. Fecal <strong>fat</strong> measured by the 1 H NMR<br />
method compared to the gravimetric approach demonstrated a mean<br />
absolute difference <strong>of</strong> 0.36 g <strong>fat</strong>/24 h.<br />
4. Discussion<br />
This study demonstrates a novel and simple method to quantitate<br />
<strong>fecal</strong> <strong>fat</strong> using CEM SmartTrac ® technology (i.e. 1 H NMR). The CEM<br />
Fig. 2. Comparison between <strong>fecal</strong> <strong>fat</strong> content measured <strong>via</strong> gravimetry after van de<br />
Kamer extraction and by 1 H NMR. A) Linear-regression <strong>analysis</strong> <strong>of</strong> <strong>fecal</strong> <strong>fat</strong> results<br />
measured by gravimetry and 1 H NMR (R 2 =0.98; n=107). B) Comparison <strong>of</strong> <strong>fecal</strong> <strong>fat</strong><br />
measurements by 1 H NMR and gravimetric <strong>analysis</strong> near the reference cut-<strong>of</strong>f value <strong>of</strong><br />
≤7 g <strong>fat</strong>/24 h (includes 68 <strong>of</strong> 107 samples measuring <strong>fecal</strong> <strong>fat</strong> content b12 g <strong>fat</strong>/24 h).<br />
The dashed-lines indicate the reference range cut-<strong>of</strong>f value (≤7 g <strong>fat</strong>/24 h). Open<br />
triangles indicate false-positive results and open circles indicate false-negative results<br />
detected by 1 H NMR compared to the reference gravimetric method.<br />
N.L. Korpi-Steiner et al. / Clinica Chimica Acta 400 (2009) 33–36<br />
SmartTrac ® System combines microwave drying technology with 1 H<br />
NMR, which permits rapid (b5 min) <strong>quantitation</strong> <strong>of</strong> lipid content in<br />
stool samples and eliminates the laborious and dangerous handling <strong>of</strong><br />
toxic solvents that are required using the well-established gravimetric<br />
method. Moreover, the performance characteristics and <strong>fecal</strong> <strong>fat</strong><br />
<strong>quantitation</strong> by 1 H NMR correlate well with the gravimetric reference<br />
method. Accordingly, this study supports the utility <strong>of</strong> the 1 H NMR to<br />
quantitate <strong>fecal</strong> <strong>fat</strong> in diagnostic laboratories and future clinical<br />
studies.<br />
To date, the “gold standard” for <strong>fecal</strong> <strong>fat</strong> <strong>quantitation</strong> is the classic<br />
van de Kamer extraction <strong>of</strong> lipids coupled with titrimetric or<br />
gravimetric <strong>quantitation</strong> <strong>of</strong> total <strong>fecal</strong> <strong>fat</strong> in individual stool samples.<br />
However, this method is laborious, time-consuming (N4 h), and<br />
potentially dangerous as it involves handling <strong>of</strong> toxic, corrosive and<br />
flammable solvents during lipid extraction [1,2]. Conversely, our<br />
newly developed method for quantitating <strong>fecal</strong> <strong>fat</strong> uses 1 H NMR as<br />
part <strong>of</strong> the CEM SmartTrac ® System, which eliminates the lipid<br />
extraction process including the handling and disposal <strong>of</strong> toxic solvents,<br />
thereby eliminating potential for errors and enhancing safety.<br />
Moreover, the <strong>quantitation</strong> <strong>of</strong> <strong>fecal</strong> <strong>fat</strong> <strong>via</strong> 1 H NMR can be accomplished<br />
in less than 5 min with minimal stool sample processing, as<br />
well as the <strong>fecal</strong> <strong>fat</strong> results can be automatically transferred to the<br />
laboratory information system (LIS) <strong>via</strong> interfacing the CEM Smart-<br />
Trac ® system with the LIS, which minimizes post-analytical errors.<br />
Consequently, 1 H NMR <strong>quantitation</strong> <strong>of</strong> <strong>fecal</strong> <strong>fat</strong> using the CEM Smart-<br />
Trac ® system <strong>of</strong>fers numerous advantages compared to the reference<br />
gravimetric method.<br />
In order to utilize 1 H NMR <strong>fecal</strong> <strong>fat</strong> results clinically, it was essential<br />
to appropriately validate the assay and determine if the results were<br />
acceptable and comparable to the <strong>fecal</strong> <strong>fat</strong> results obtained by the<br />
standard gravimetric method. Therefore, we first determined that the<br />
Fig. 3. Bland–Altman plot illustrating the limit <strong>of</strong> agreement between the gravimetric<br />
and 1 H NMR methods for <strong>fecal</strong> <strong>fat</strong> measurement. Fecal <strong>fat</strong> measured by the 1 H NMR<br />
method compared to the gravimetric approach indicates a mean difference <strong>of</strong> 0.36 g <strong>fat</strong>/<br />
24 h (upper limit <strong>of</strong> agreement: 12.0 g <strong>fat</strong>/24 h; lower limit <strong>of</strong> agreement: −19.8 g). The<br />
horizontal dotted and solid lines indicate the mean difference <strong>of</strong> <strong>fecal</strong> <strong>fat</strong> measured<br />
±1SD and ±2SD, respectively.<br />
35
36 N.L. Korpi-Steiner et al. / Clinica Chimica Acta 400 (2009) 33–36<br />
linearity, recovery and imprecision <strong>of</strong> <strong>fecal</strong> <strong>fat</strong> <strong>quantitation</strong> by 1 H NMR<br />
were acceptable. The <strong>fecal</strong> <strong>fat</strong> linearity values quantified by 1 H NMR<br />
within the range <strong>of</strong> 0.1–21.0% <strong>fat</strong> correlated well with the expected<br />
values (Fig.1). The coefficients <strong>of</strong> variance (CVs) for 1 H NMR intra-assay<br />
(1.2–6.5%) and inter-assay (1.8–5.8%) imprecision were comparable to<br />
or better than the gravimetric method imprecision results (intra-assay<br />
CV=1.0–17.2%; inter-assay CV=3.8–6.5%; Table 1). Additionally, the<br />
recovery <strong>of</strong> <strong>fecal</strong> <strong>fat</strong> quantitated by the 1 H NMR indicated a recovery<br />
range <strong>of</strong> 93–112% with a mean recovery <strong>of</strong> 105%. Taken together, these<br />
data indicate that 1 H NMR and gravimetric methods have comparable<br />
performance characteristics, thereby supporting 1 H NMR as a reasonable<br />
alternative to gravimetric <strong>quantitation</strong> <strong>of</strong> <strong>fecal</strong> <strong>fat</strong>.<br />
Stool samples from 107 different patients with varying stool <strong>fat</strong><br />
excretion were used for comparative <strong>analysis</strong> <strong>of</strong> <strong>fecal</strong> <strong>fat</strong> <strong>quantitation</strong><br />
by 1 H NMR and gravimetric methods. A positive correlation between<br />
stool <strong>fat</strong> <strong>quantitation</strong> by 1 H NMR and gravimetry was exhibited<br />
(R 2 =0.98; y=1.0173x−0.6859; Fig. 2A), demonstrating that the 1 H<br />
NMR method produces results similar to that generated by gravimetry.<br />
Bland–Altman <strong>analysis</strong> demonstrates a mean absolute difference <strong>of</strong><br />
0.36 g <strong>fat</strong>/24 h between 1 H NMR and gravimetric measurement <strong>of</strong><br />
<strong>fecal</strong> <strong>fat</strong> (Fig. 3). Accordingly, with similar analytical performance<br />
characteristics between the two methods, it is not surprising that <strong>fecal</strong><br />
<strong>fat</strong> measurement using the 1 H NMR also demonstrates good sensitivity<br />
(92.3%), specificity (94.5%), negative-predictive value (92.9%),<br />
and positive-predictive value (94.1%) for malabsorption when compared<br />
to the gravimetric method using the established clinical cutpoint<br />
<strong>of</strong> ≤7 g <strong>fat</strong>/24 h established by gravimetry. Comparison <strong>of</strong> <strong>fecal</strong><br />
<strong>fat</strong> measurements by 1 H NMR and gravimetric <strong>analysis</strong> near the<br />
reference cut-<strong>of</strong>f value <strong>of</strong> ≤7 g <strong>fat</strong>/24 h (n=68 <strong>of</strong> 107 samples<br />
measured <strong>fecal</strong> <strong>fat</strong> content b12 g <strong>fat</strong>/24 h) indicated 3 false-positive<br />
and 4 false-negative results for malabsorption detected by 1 H NMR<br />
compared to the reference gravimetric method (Fig. 2B). In view <strong>of</strong> the<br />
above results it may be stated that the utility <strong>of</strong> 1 H NMR-derived <strong>fecal</strong><br />
<strong>fat</strong> results for identifying patients with malabsorption is similar to that<br />
<strong>of</strong> gravimetry. Regardless <strong>of</strong> the methodology, <strong>fecal</strong> <strong>fat</strong> results near the<br />
cut-<strong>of</strong>f for malabsorption (7±1 g) should be interpreted carefully with<br />
consideration <strong>of</strong> the patient's symptoms and repeated as necessary.<br />
In summary, this study demonstrates a novel and simple method<br />
to quantitate <strong>fecal</strong> <strong>fat</strong> using 1 H NMR as part <strong>of</strong> the CEM SmartTrac ®<br />
technology. This method permits rapid (b5 min) <strong>quantitation</strong> <strong>of</strong> lipid<br />
content in stool samples and eliminates the laborious and dangerous<br />
handling <strong>of</strong> toxic, corrosive and flammable solvents that are required<br />
when using the well-established gravimetric method. Fecal <strong>fat</strong><br />
<strong>quantitation</strong> by 1 H NMR correlates well with the gravimetric reference<br />
method and demonstrates comparable performance characteristics,<br />
thereby supporting the utility <strong>of</strong> the 1 H NMR to quantitate <strong>fecal</strong> <strong>fat</strong> in<br />
diagnostic laboratories and future clinical studies.<br />
Acknowledgements<br />
We thank Dr. Lawrence K. Oliver and Shannon D. Hodel-Hanson for<br />
their suggestions and review <strong>of</strong> method validation studies and Sara J.<br />
Minnich, Aaron J. Stelpflug, John Christian, Jennifer E. Brown, and<br />
Karen Kloke for their technical support.<br />
References<br />
[1] Van de Kamer J, Ten Bookkel Huinink H, Weyers H. Rapid method for the<br />
determination <strong>of</strong> <strong>fat</strong> in feces. J Biol Chem 1949:347–55.<br />
[2] Van De Kamer JH. Quantitative determination <strong>of</strong> the saturated and unsaturated<br />
higher <strong>fat</strong>ty acids in <strong>fecal</strong> <strong>fat</strong>. Scand J Clin Lab Invest 1953;5:30–6.<br />
[3] Jakobs BS, Volmer M, Swinkels DW, H<strong>of</strong>s MT, Donkervoort S, Joosting MM, et al.<br />
New method for faecal <strong>fat</strong> determination by mid-infrared spectroscopy, using a<br />
transmission cell: an improvement in standardization. Ann Clin Biochem 2000;37<br />
(Pt 3):343–9.<br />
[4] Bekers O, Postma C, Lombarts AJ. Determination <strong>of</strong> faecal <strong>fat</strong> by near-infrared<br />
spectroscopy. Eur J Clin Chem Clin Biochem 1995;33:83–6.<br />
[5] Jakobs BS, Volmer M, H<strong>of</strong>s MT, Swinkels DW. Enhanced time-saving extraction<br />
procedure for the <strong>analysis</strong> <strong>of</strong> <strong>fecal</strong> <strong>fat</strong> by Fourier transform infrared spectroscopy.<br />
Clin Chem 2000;46:1019–20.<br />
[6] Franck P, Sallerin JL, Schroeder H, Gelot MA, Nabet P. Rapid determination <strong>of</strong> <strong>fecal</strong><br />
<strong>fat</strong> by Fourier transform infrared <strong>analysis</strong> (FTIR) with partial least-squares<br />
regression and an attenuated total reflectance accessory. Clin Chem 1996;42:<br />
2015–20.<br />
[7] Casey JC, Miles CA. Determination <strong>of</strong> the <strong>fat</strong> content <strong>of</strong> meat using <strong>nuclear</strong><br />
<strong>magnetic</strong> resonance. J Sci Food Agric 1974;25:1155–61.<br />
[8] Chaland B, Mariette F, Marchal P, De Certaines J. 1H <strong>nuclear</strong> <strong>magnetic</strong> resonance<br />
relaxometric characterization <strong>of</strong> <strong>fat</strong> and water states in s<strong>of</strong>t and hard cheese.<br />
J Dairy Res 2000;67:609–18.<br />
[9] Mariette F, Lucas T. NMR signal <strong>analysis</strong> to attribute the components to the solid/<br />
liquid phases present in mixes and ice creams. J Agric Food Chem 2005;53:<br />
1317–27.<br />
[10] Schneider MU, Demling L, Jones SA, Barker PJ, Domschke S, Heptner G, et al. NMR<br />
spectrometry. A new method for total stool <strong>fat</strong> quantification in chronic pancreatitis.<br />
Dig Dis Sci 1987;32:494–9.<br />
[11] Schneider MU, Demling L, Domschke S, Heptner G, Merkel I, Domschke W. NMR<br />
spectrometric stool <strong>fat</strong> <strong>analysis</strong>—a new technique for quantifying steatorrhea and<br />
establishing the indication for enzyme replacement in chronic pancreatitis.<br />
Hepatogastroenterology 1985;32:210–5.<br />
[12] Kunz P, Kunnecke B, Kunz I, Lengsfeld H, von Kienlin M. Natural abundance<br />
13<br />
C-NMR spectroscopy for the quantitative determination <strong>of</strong> <strong>fecal</strong> <strong>fat</strong>. Clin<br />
Biochem 2003;36:505–10.<br />
[13] Eugene M, Thuillier F, Le Moyec L, Messing B. Proton NMR <strong>analysis</strong> <strong>of</strong> <strong>fecal</strong> lipids in<br />
gastroenterological patients. Clin Biochem 1994;27:191–4.<br />
[14] Keeton JT, Hafley BS, Eddy SM, Moser CR, McManus BJ, Leffler TP. Rapid<br />
determination <strong>of</strong> moisture and <strong>fat</strong> in meats by microwave and <strong>nuclear</strong> <strong>magnetic</strong><br />
resonance <strong>analysis</strong>—PVM 1:2003. J AOAC Int 2003;86:1193–202.<br />
[15] Cartwright G, McManus BH, Leffler TP, Moser CR. Rapid determination <strong>of</strong> moisture/<br />
solids and <strong>fat</strong> in dairy products by microwave and <strong>nuclear</strong> <strong>magnetic</strong> resonance<br />
<strong>analysis</strong>. J AOAC Int 2005;88:107–20.<br />
[16] Burtis C, Ashwood E. Tietz textbook <strong>of</strong> clinical chemistry. 3rd Edition. Philadelphia,<br />
PA: WB Saunders Company; 1998.