although the MCU does not provide a debug trace port - iSYSTEM
although the MCU does not provide a debug trace port - iSYSTEM
although the MCU does not provide a debug trace port - iSYSTEM

Create successful ePaper yourself
Turn your PDF publications into a flip-book with our unique Google optimized e-Paper software.
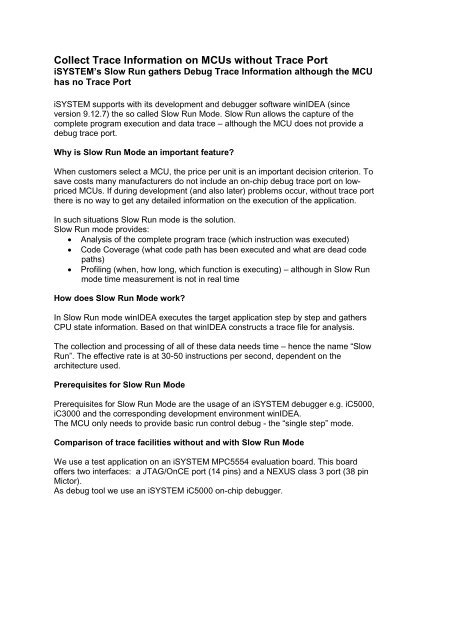
Collect Trace Information on <strong>MCU</strong>s without Trace Port<br />
<strong>iSYSTEM</strong>’s Slow Run ga<strong>the</strong>rs Debug Trace Information <strong>although</strong> <strong>the</strong> <strong>MCU</strong><br />
has no Trace Port<br />
<strong>iSYSTEM</strong> sup<strong>port</strong>s with its development and <strong>debug</strong>ger software winIDEA (since<br />
version 9.12.7) <strong>the</strong> so called Slow Run Mode. Slow Run allows <strong>the</strong> capture of <strong>the</strong><br />
complete program execution and data <strong>trace</strong> – <strong>although</strong> <strong>the</strong> <strong>MCU</strong> <strong>does</strong> <strong>not</strong> <strong>provide</strong> a<br />
<strong>debug</strong> <strong>trace</strong> <strong>port</strong>.<br />
Why is Slow Run Mode an im<strong>port</strong>ant feature?<br />
When customers select a <strong>MCU</strong>, <strong>the</strong> price per unit is an im<strong>port</strong>ant decision criterion. To<br />
save costs many manufacturers do <strong>not</strong> include an on-chip <strong>debug</strong> <strong>trace</strong> <strong>port</strong> on lowpriced<br />
<strong>MCU</strong>s. If during development (and also later) problems occur, without <strong>trace</strong> <strong>port</strong><br />
<strong>the</strong>re is no way to get any detailed information on <strong>the</strong> execution of <strong>the</strong> application.<br />
In such situations Slow Run mode is <strong>the</strong> solution.<br />
Slow Run mode <strong>provide</strong>s:<br />
Analysis of <strong>the</strong> complete program <strong>trace</strong> (which instruction was executed)<br />
Code Coverage (what code path has been executed and what are dead code<br />
paths)<br />
Profiling (when, how long, which function is executing) – <strong>although</strong> in Slow Run<br />
mode time measurement is <strong>not</strong> in real time<br />
How <strong>does</strong> Slow Run Mode work?<br />
In Slow Run mode winIDEA executes <strong>the</strong> target application step by step and ga<strong>the</strong>rs<br />
CPU state information. Based on that winIDEA constructs a <strong>trace</strong> file for analysis.<br />
The collection and processing of all of <strong>the</strong>se data needs time – hence <strong>the</strong> name “Slow<br />
Run”. The effective rate is at 30-50 instructions per second, dependent on <strong>the</strong><br />
architecture used.<br />
Prerequisites for Slow Run Mode<br />
Prerequisites for Slow Run Mode are <strong>the</strong> usage of an <strong>iSYSTEM</strong> <strong>debug</strong>ger e.g. iC5000,<br />
iC3000 and <strong>the</strong> corresponding development environment winIDEA.<br />
The <strong>MCU</strong> only needs to <strong>provide</strong> basic run control <strong>debug</strong> - <strong>the</strong> “single step” mode.<br />
Comparison of <strong>trace</strong> facilities without and with Slow Run Mode<br />
We use a test application on an <strong>iSYSTEM</strong> MPC5554 evaluation board. This board<br />
offers two interfaces: a JTAG/OnCE <strong>port</strong> (14 pins) and a NEXUS class 3 <strong>port</strong> (38 pin<br />
Mictor).<br />
As <strong>debug</strong> tool we use an <strong>iSYSTEM</strong> iC5000 on-chip <strong>debug</strong>ger.
In <strong>the</strong> following tests we compare what data<br />
is available over <strong>the</strong> different interfaces.<br />
Trace over Nexus:<br />
Details on <strong>the</strong> Nexus interface:<br />
The Nexus interface is available in different<br />
classes. The MPC5554 evaluation board<br />
<strong>provide</strong>s a Nexus class 3 interface (38pins).<br />
Nexus class 3 offers a <strong>trace</strong> <strong>port</strong> and allows<br />
additionally to Run Control Debug also real<br />
time data <strong>trace</strong> and real time read/write of<br />
memory areas without stopping <strong>the</strong> <strong>MCU</strong>.<br />
Debug test:<br />
Connect <strong>the</strong> iC5000 over <strong>the</strong> Nexus interface<br />
Figure 1: Test Setup over Nexus<br />
to <strong>the</strong> MPC5554 board and start <strong>the</strong> <strong>trace</strong>.<br />
Simultaneously to program execution winIDEA shows <strong>the</strong> complete program and data<br />
<strong>trace</strong>. The data acquisition is handled in real time - without interrupting or slowing down<br />
<strong>the</strong> <strong>MCU</strong> and without effects on <strong>the</strong> application’s behavior. Additionally <strong>the</strong> occurrence<br />
and reaction on external signals (e.g. AUX) can be tracked.<br />
Based on this <strong>trace</strong> execution profiling (when, how long, which function is executing) as<br />
well as Code Coverage analysis (what source code is executed and what are “dead”<br />
code paths) is available.<br />
Figure 2: Trace Results over NEXUS
„Trace“ over JTAG/OnCE:<br />
Details on <strong>the</strong> JTAG/OnCE interface:<br />
JTAG/OnCE interface <strong>provide</strong>s only Run<br />
Control <strong>debug</strong> (e.g. start/stop program<br />
execution, read/write registers, set of<br />
breakpoints and watches). A complete<br />
program execution <strong>trace</strong> is <strong>not</strong> available.<br />
Debug test:<br />
When <strong>the</strong> iC5000 is connected over <strong>the</strong><br />
JTAG interface to <strong>the</strong> MPC5554<br />
demonstration board, <strong>the</strong> <strong>trace</strong> is <strong>not</strong><br />
available.<br />
The only way to <strong>debug</strong> is analysis of <strong>the</strong><br />
disassembly code and registers content<br />
while <strong>the</strong> program execution is manually<br />
stopped e.g. by breakpoints or run until.<br />
Figure 3: Test Setup over JTAG<br />
Figure 4: Trace Results over JTAG (without Slow Run)<br />
“Trace” over JTAG/OnCE – using Slow Run Mode:<br />
Details on <strong>the</strong> interface:<br />
The interface is <strong>the</strong> same as described in section “„Trace“ over JTAG/OnCE”.<br />
Debug test:<br />
When you connect <strong>the</strong> iC5000 over <strong>the</strong> JTAG interface, select “Slow Run” ( in<br />
winIDEA’s “Debug” menu) and start <strong>the</strong> <strong>trace</strong>, you get a complete program execution<br />
<strong>trace</strong> (similar to <strong>the</strong> <strong>trace</strong> over <strong>the</strong> Nexus interface).<br />
The resulting <strong>trace</strong> file allows analysis of <strong>the</strong> program execution and data <strong>trace</strong> plus<br />
profiling and code coverage examination. The time base in this case is <strong>the</strong> number of<br />
instructions executed.
Figure 5: Trace Results over JTAG (with Slow Run)<br />
Comparison of run times with and without Slow Run Mode<br />
As in <strong>the</strong> previous example we use a test application on <strong>the</strong> MPC5554 demonstration<br />
board. The <strong>debug</strong> tool is again an <strong>iSYSTEM</strong> iC5000 on-chip <strong>debug</strong>ger.<br />
We track <strong>the</strong> execution duration over <strong>the</strong> Nexus 3 interface with and without Slow Run<br />
Mode.<br />
Table 1: Time Duration with and without Slow Run<br />
Interface<br />
Nexus 3<br />
46 instructions e.g. library<br />
call for cast operation:<br />
int i; float fRet;<br />
i = fRet;<br />
without Slow<br />
Run<br />
9,87µs +<br />
171Kb<br />
Trace File<br />
with Slow<br />
Run<br />
2s + 171Kb<br />
Trace File<br />
„Step over“ over a function<br />
7038 instructions<br />
without Slow<br />
Run<br />
522,7 µs +<br />
190Kb<br />
Trace File<br />
with Slow<br />
Run<br />
85s +<br />
190Kb<br />
Trace File<br />
Limitations of Slow Run<br />
Slow Run is well-suited to <strong>trace</strong> small <strong>port</strong>ions of an application.<br />
If library functions are called (see above table), Slow Run may need a long time to<br />
return, because much code is added. Likewise <strong>the</strong> execution of a function can last very<br />
long in Slow Run mode (see above table, example “Step over”).<br />
If a <strong>trace</strong> of a complete application is needed, it is recommended to run <strong>the</strong> data<br />
acquisition in Slow Run mode overnight.
Ano<strong>the</strong>r limitation of Slow Run mode is <strong>the</strong> possibly changed behavior of <strong>the</strong><br />
application. Due to step by step execution <strong>the</strong> reaction on external signals e.g. timers,<br />
interrupts, can be delayed or <strong>not</strong> happen at all, e.g. if an interrupt is lost.<br />
Conclusion<br />
Slow Run mode allows to <strong>debug</strong> and to analyze <strong>the</strong> complete program <strong>trace</strong> including<br />
profiling and code coverage also on <strong>MCU</strong>s without <strong>trace</strong> <strong>port</strong>.<br />
The most im<strong>port</strong>ant use case for Slow Run is unit testing with testIDEA. Here <strong>the</strong><br />
tested functions are relatively short in terms of op-codes executed, but at <strong>the</strong> same<br />
time <strong>the</strong> execution coverage information is a critical measure of <strong>the</strong> quality of test<br />
vectors. If necessary, a test can be executed twice – under Slow Run to determine<br />
vector quality and under regular execution to verify <strong>the</strong> outcome also in real-time<br />
conditions.<br />
Slow Run mode is <strong>not</strong> a substitute for powerful <strong>MCU</strong>s with <strong>trace</strong> <strong>port</strong>s and according<br />
<strong>debug</strong>gers. It is <strong>not</strong> suitable for system test or for testing modules under real-time<br />
conditions. However, it can <strong>provide</strong> insights into execution of application parts which<br />
would o<strong>the</strong>rwise remain invisible.<br />
Pictures<br />
Figure 1:<br />
Figure 2:<br />
Figure 3:<br />
Figure 4:<br />
Figure 5:<br />
TestSetupNexus.jpg<br />
NexusTraceProfilerCC-2.jpg<br />
TestSetupJTAG.jpg<br />
JTAGkeinTRPRof.jpg<br />
JTAGSlowRunTraceProfilerCC.jpg<br />
About <strong>iSYSTEM</strong> - Debug & Test Tools - All under One Umbrella<br />
<strong>iSYSTEM</strong> specializes in embedded development and test tools.<br />
We <strong>provide</strong> <strong>debug</strong>ger and analyzer solutions for more than 50 CPU architectures and<br />
<strong>the</strong>ir derivatives (2500+ microcontrollers). The Windows and/or Eclipse based<br />
development environment (winIDEA) is easy to learn and use. The flexible integration<br />
and application of <strong>iSYSTEM</strong> solutions within <strong>the</strong> entire development process is enabled<br />
by open and public interfaces (APIs).<br />
<strong>iSYSTEM</strong>‘s new iC5000 platform is fully software configurable and adapts to a multifunctional<br />
analyzer, development and test tool for many different processors and<br />
controllers. An optional I/O module adds <strong>the</strong> capability to generate, monitor and <strong>trace</strong><br />
digital as well as analog signals. Additionally, <strong>the</strong> iC5000 can measure <strong>the</strong> power and<br />
current consumption on target level.<br />
Testing in general and especially according to functional safety standards is gaining<br />
more and more im<strong>port</strong>ance in <strong>the</strong> embedded world. <strong>iSYSTEM</strong> <strong>provide</strong>s a real-time unit<br />
test tool (testIDEA) integrated in <strong>iSYSTEM</strong>'s development environment winIDEA that<br />
allows execution of test cases without code instrumentation!<br />
To qualify <strong>iSYSTEM</strong>‘s tool functionality we make our development and test process<br />
transparent to customers. In addition we <strong>provide</strong> access to our regression test tool<br />
suite. This enables our customers to prove that <strong>iSYSTEM</strong> tools perfectly fit in <strong>the</strong><br />
context of, e.g., a safety project as required by a standard.
Links to <strong>iSYSTEM</strong><br />
www.isystem.com<br />
www.twitter.com/isystemag<br />
Blog: www.embedded.typepad.com<br />
Contact<br />
Erol Simsek<br />
<strong>iSYSTEM</strong> AG<br />
Sales & Marketing<br />
Phone +49 (8138) 6971-56<br />
Fax +49 (8138) 6971-46<br />
e-Mail: erol.simsek@isystem.com